As a general fact, Sales Forecasting refers to the process of estimating sales of any company/firm based on the previous sales and current conditions. Accurate sales forecasts enable companies to make informed business decisions and predict short-term and long-term performance. Companies can base their forecasts on past sales data, industry-wide comparisons, and economic trends. Sales forecasting gives insight into how a company should manage its workforce, cash flow, and resources. In addition to helping a company allocate its internal resources effectively, predictive sales data is important for businesses when looking to acquire investment capital.
Given the sales data(as mentioned below), it is required to predict the future sales for a given period of time.
The data provided, consists of monthly Sales and Budget of the Laptops from the year 2014-2018. It is required to predict the monthly sales of laptops in year 2019.
Initially, the data is standarised by converting them from string to numeric form . Also, the date format can be changed if required and NaN values are handled accordingly.
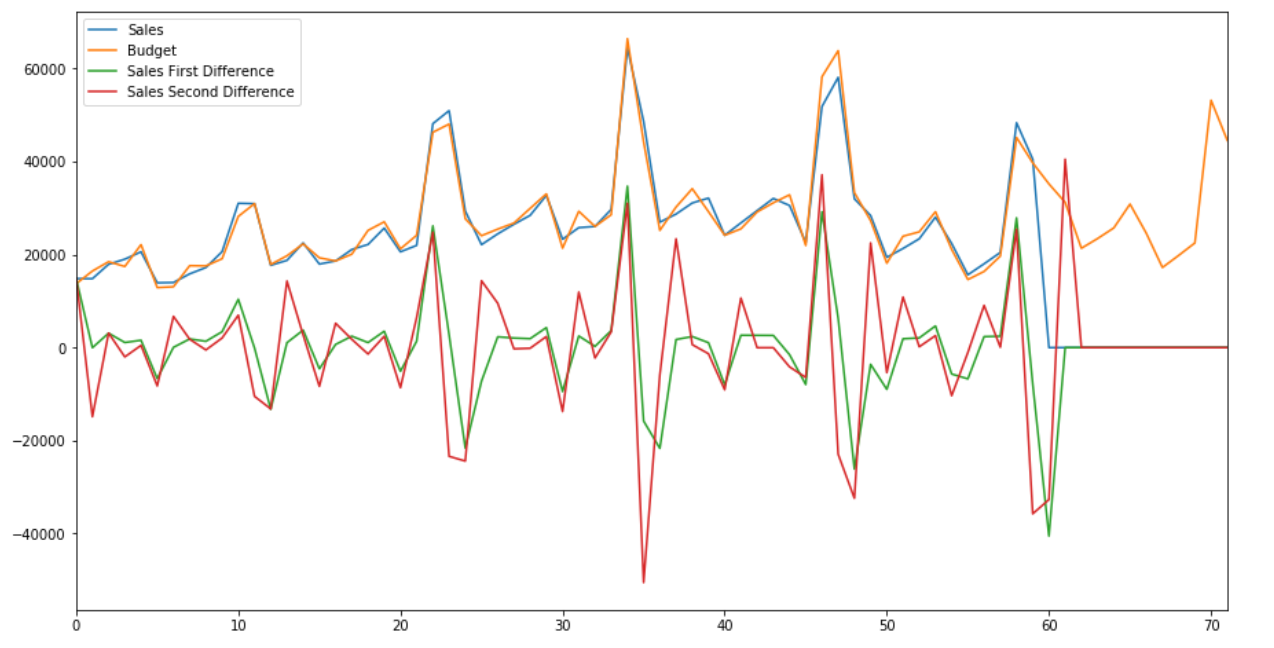
Adfuller(ADF) test is performed on the sales data to check if data is stationary. The process continues till Sales second difference, where stationarity is achieved.
Summerised data:
ARIMA, short for 'Auto Regressive Integrated Moving Average' is actually a class of models that 'explains' a given time series based on its own past values, that is, its own lags and the lagged forecast errors, so that equation can be used to forecast future values.
- AR: Autoregression. A model that uses the dependent relationship between an observation and some number of lagged observations.
- I: Integrated. The use of differencing of raw observations (e.g. subtracting an observation from an observation at the previous time step) in order to make the time series stationary.
- MA: Moving Average. A model that uses the dependency between an observation and a residual error from a moving average model applied to lagged observations.
Now, ACF and PACF correlations are applied to determine the values of p,d and q variables which are to be applied in ARIMA model.
A time series can have components like trend, seasonality, cyclic and residual. ACF considers all these components while finding correlations hence it’s a ‘complete auto-correlation plot’. PACF is a partial auto-correlation function. Basically instead of finding correlations of present with lags like ACF, it finds correlation of the residuals (which remains after removing the effects which are already explained by the earlier lag(s)) with the next lag value hence ‘partial’ and not ‘complete’ as we remove already found variations before we find the next correlation.
The model is checked with various values of p, d and q but the error value in case of ARIMA is very high.
A problem with ARIMA is that it does not support seasonal data. That is a time series with a repeating cycle. Therefore, Seasonal-ARIMA is considered.
Seasonal Autoregressive Integrated Moving Average, SARIMA or Seasonal ARIMA, is an extension of ARIMA that explicitly supports univariate time series data with a seasonal component.It adds three new hyperparameters to specify the autoregression (AR), differencing (I) and moving average (MA) for the seasonal component of the series, as well as an additional parameter for the period of the seasonality. It is stated SARIMAX instead of SARIMA because the “X” addition to the method name means that the implementation also supports exogenous variables.
SARIMA Elements
- p: Trend autoregression order
- d: Trend difference order
- q: Trend moving average order
- P: Seasonal autoregressive order
- D: Seasonal difference order
- Q: Seasonal moving average order
- m: The number of time steps for a single seasonal period
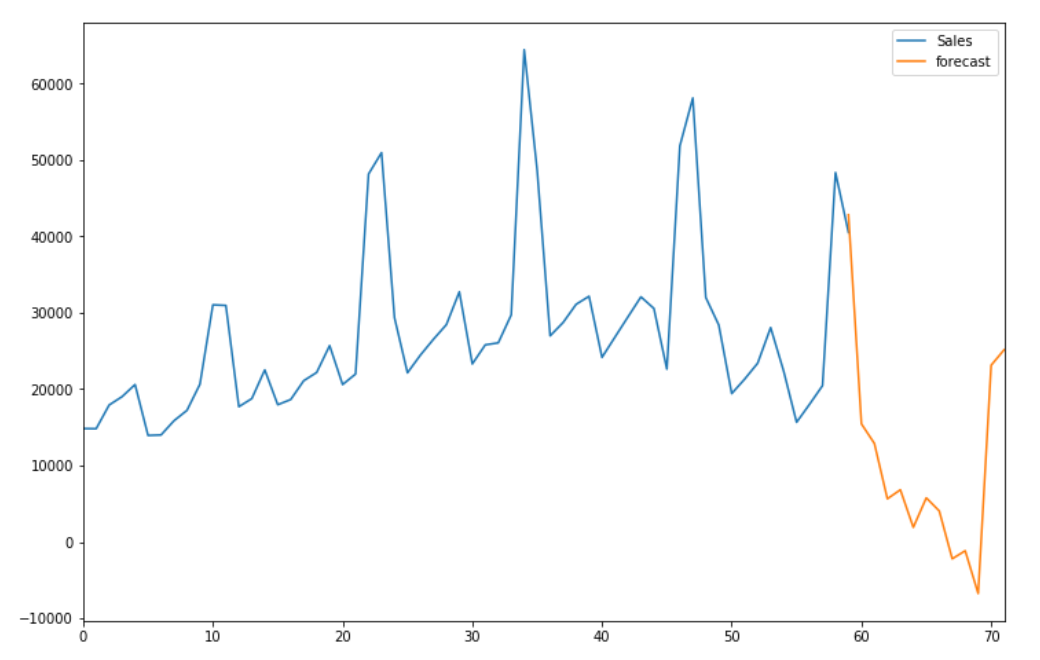
SARIMA(p,d,q)(P,D,Q)mThe final sales forecast after applying SARIMAX comes to be this:

