This project is a Python based user interface for digital multimeters. I built the frontend so that anyone can change the device that it talks to by writing only a couple functions in a class. The frontend uses wxPython for the GUI and Matplotlib for the trend plot and histogram.
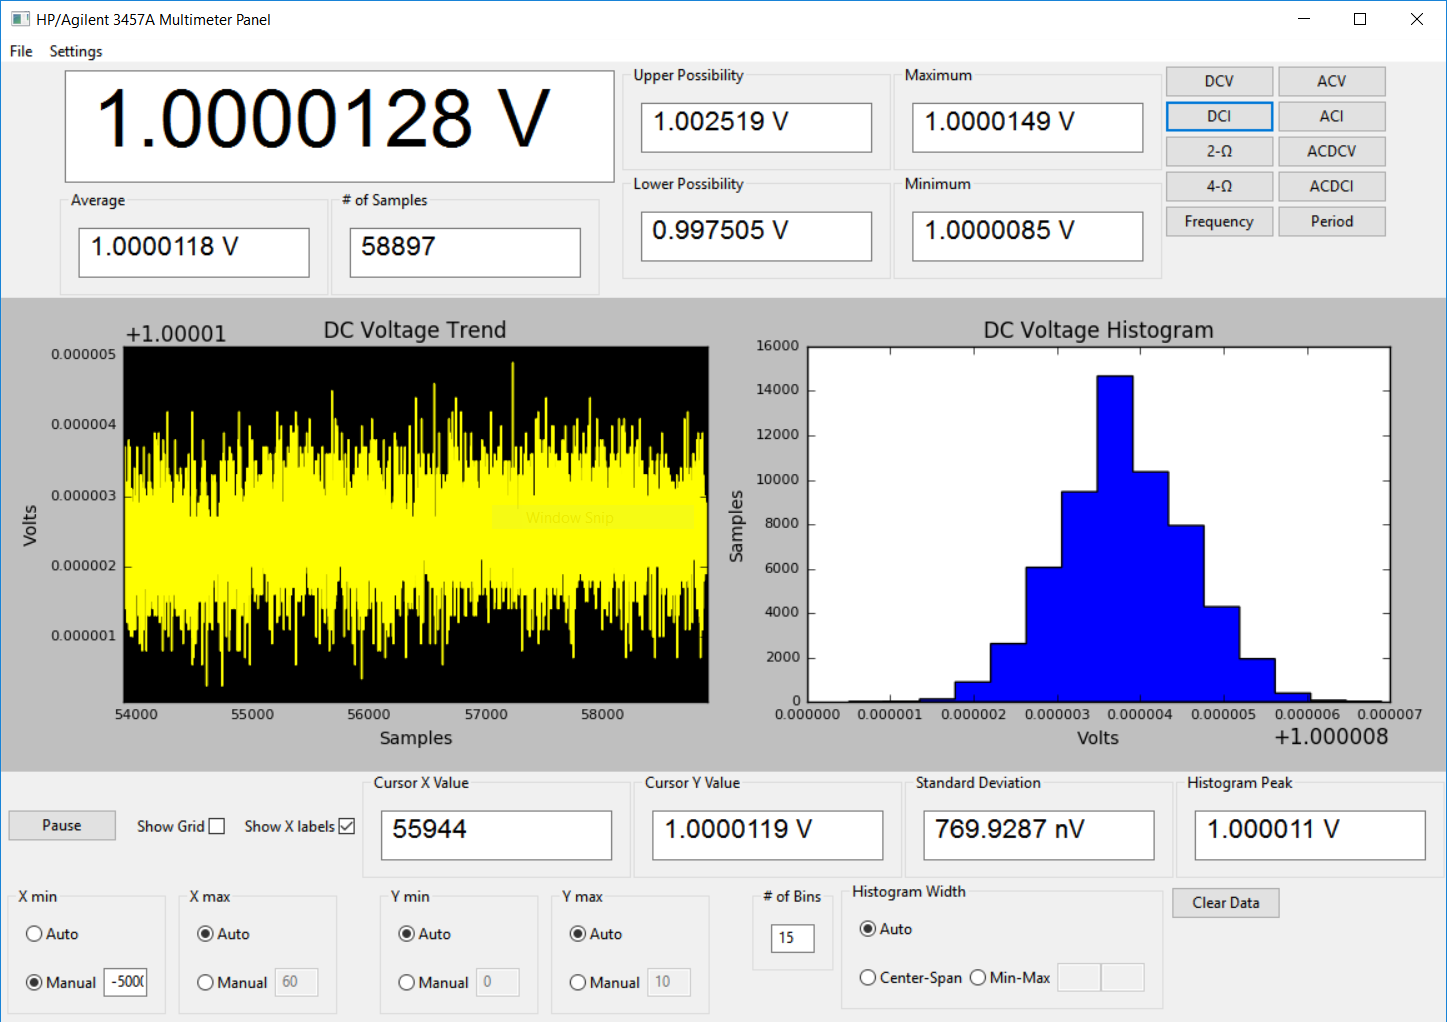
The most important features are located in the top panel of the interface. These features include the main readout, average, number of samples, minimum, maximum, possible offset based on accuracy specifications, and finally the measurement buttons.
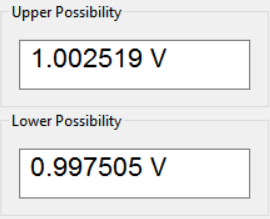
This section shows the greatest and least possible value of a measurement for a given reading. The offset is based on the worst stated specification of the HP/Agilent 3457A for each range and measurement. This section is helpful to determine if a meter is within specification or, conversely, if the thing you are measuring is within specification.
In addition to simply recording data, this project plots the data over time and also as a histogram.
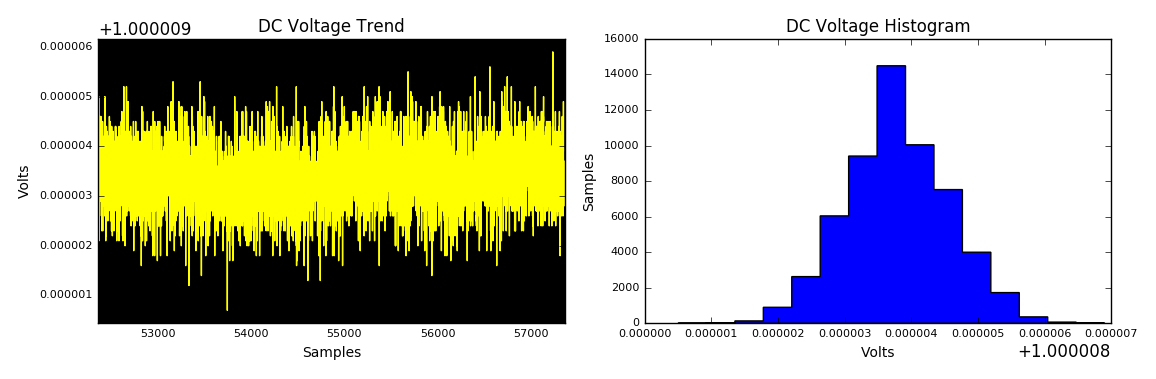
The plot window and histogram can be modified by the controls in the bottom panel.
- X min - Auto or Manual range of the minimum x value of the trendline. The manual value can be negative, this means that the window will be z amount behind the current reading. Auto keeps the window to 100 readings.
- X max - Auto or Manual range for the maximum of the trendline. Auto keeps the maximum at the most recent reading.
- Y min - Auto or Manual range for the minimum of the y axis for the trendline. Auto keeps the minimum 5% below the minimum value of the readings in the current window.
- Y max - Auto or Manual range for the maximum of the y axis for the trendline. Auto keeps the maximum 5% above the maximum value of the readings in the current window.
- Cursor X Value - This is the reading number under your mouse pointer in the trendline
- Cursor Y Value - This is the reading at the Cursor X Value, which is where your pointer is
Histogram
- # of Bins - The number of bins used to hold all the readings and shown in the histogram
- Histogram Width - Auto, Center-Span, or Min-Max. Center-Span allows the user to enter the center point for the histogram and the amount of span from the center, which the histogram is then plotted with. Min-Max allows the user to enter the minimum and maximum values to use to plot the histogram
- Histogram Peak - This is the value of the highest part of the histogram
Standard Deviation - This value is the standard deviation of all the past readings
- Serial Port - Set serial port used to communicate with the digital multimeter
- NPLC - Set the number of powerline cycles used to integrate each reading
- Set Terminals - Allows the user to switch terminals used between front and back panel
- Save Plot - Saves current plotting window as a png
- Save Data to CSV - Save the data to a csv file