NOTE: this is far from being released. Future development happens at https://github.com/Pandas-Quant-Finance
However, this library is stable enough for my personal use for stock trading algorithms powered by ML models. It is intended to be used together with pandas-ml-utils.
There are also a couple of nice plotting extensions.
There is a new ta_plot(rows, columns, figsize) function which returns as TaPlot object:
from quant_ml import pd

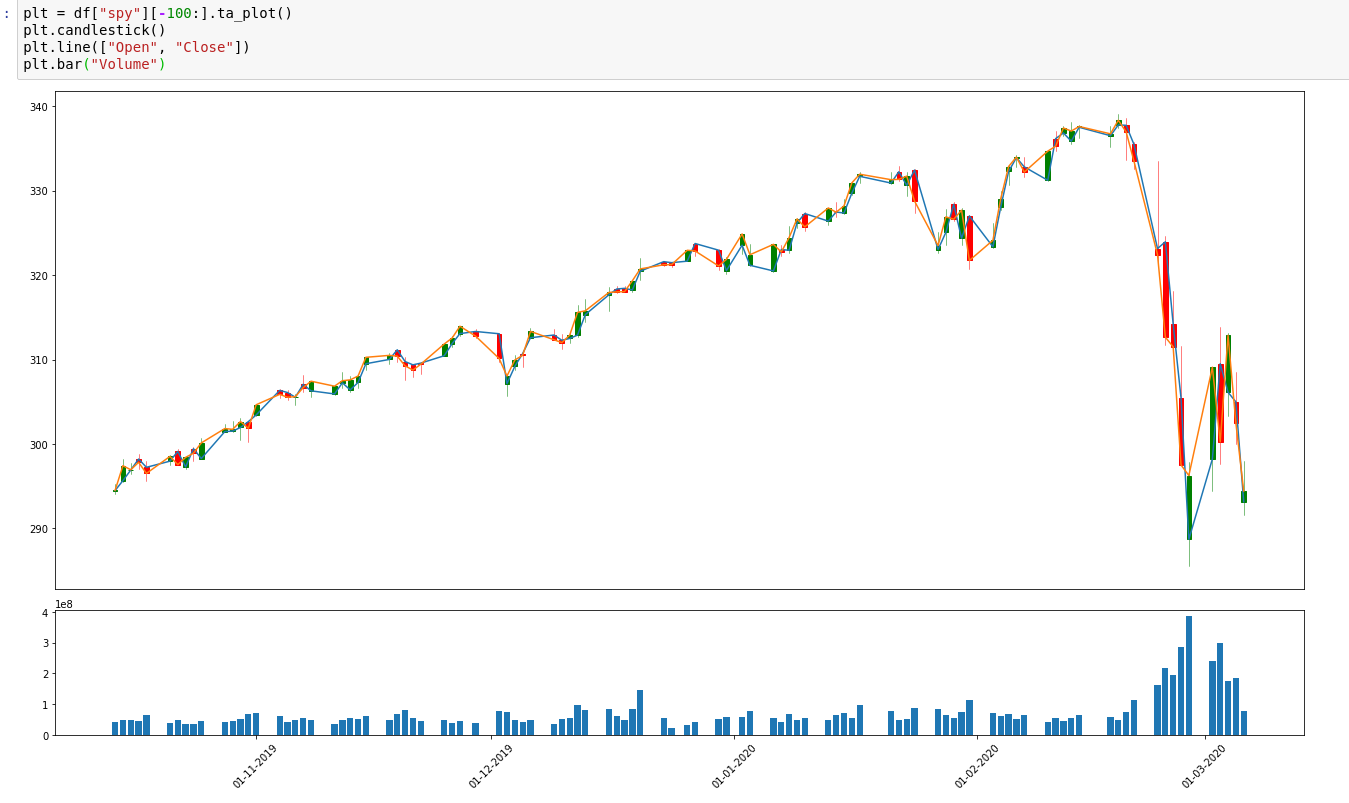
plt = pd.fetch_yahoo("SPY")[-100:].ta_plot()
plt.candlestick()
plt.line(["Open", "Close"])
plt.bar("Volume")
Or just via shortcut
from quant_ml import pd

pd.fetch_yahoo("QQQ").ta_plot()()
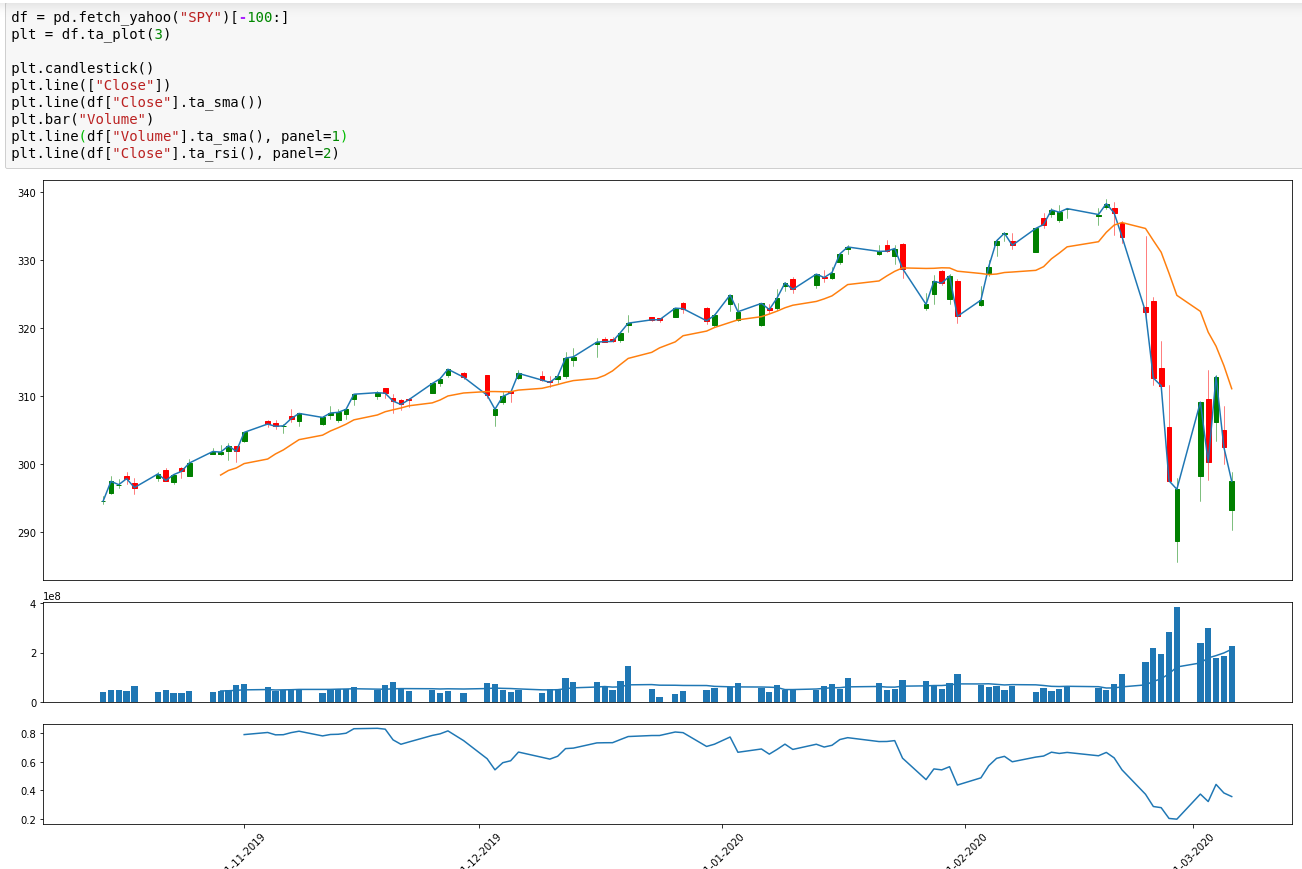
Of course you can add as many panels as you like
from quant_ml import pd

df = pd.fetch_yahoo("SPY")[-100:]
plt = df.ta_plot(3)

plt.candlestick()
plt.line(["Close"])
plt.line(df["Close"].ta_sma())
plt.bar("Volume")
plt.line(df["Volume"].ta_sma(), panel=1)
plt.line(df["Close"].ta_rsi(), panel=2)
ideas: we need to implement a Back-test Summary which is like a Zipline implementation
provide pure python TA-Lib functionality which are suitable for ML (meaning oscillators or other indicators having a bounded domain of [-1, 1]).


