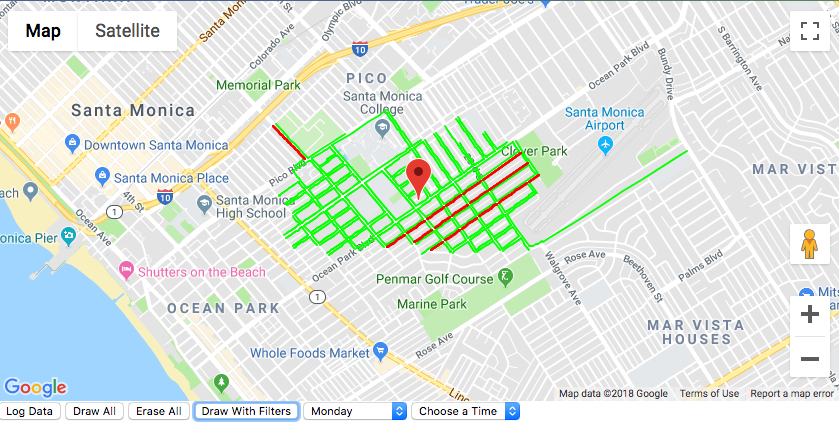
This project started out as a way to make parking easier for our clients. It is turning into a library to visualize open data from Santa Monica GIS Data Portal. The library uses fetch to get the data as a JSON object, then parses the data to work with the Google Maps API.
 A portion of the map is selected from the API endpoint and drawn on the map.
 An attribute can be selected and overlayed onto the map.
 Attribute data can be combined to get more specific visualizations.
(note: you will need to use your own google maps API key to run the application
- for more information see this link
the API key will go in the index.html file
  <script async defer src="https://maps.googleapis.com/maps/api/js?key=YOUR_API_KEY&callback=initMap"
  type="text/javascript"></script>
- for more information on how to set up a google maps project see this link )
- sorts the data based on 1 feature attribute,
- parses the lat lng data into google maps friendly format
- draws the polylines on the map & stores the data to erase the paths
-
states what attributes you would like to sort by (ex DAY, TIME etc)
-
creates an object from an array to be passed as filterAttributes to the filterDataSet() function
-
when the object is created the values for keys are empty strings the object keys are updated with the updateFilterAttributes() function
- takes an object{},
- takes an attribute as a string, convention with this dataset seems to be a string in all caps for attribute names
- takes a value, currently string but could possibly be something else for other datasets, use this.value for the implemented dropdown
aliases that can be used in the filterDataSet() function a simple example is seeing all of the options for DAY and TIME but other insights can be gained by comparing various field aliases from the database