Situation: The outcome of Basketball games can be influenced by multiple factors and it's accurate prediction is used by Odd-makers to create profit from betting customers
Task: Create a way of predicting the winner of a basketball game in the National Basketball Association (NBA)
Action:
- Collected data relevant for the prediction from multiple sources for 26000 games played in the NBA (seasons: 2000-2021)
- Explored the importance of different features by checking distributions, correlation and shapely values
- Compared the accuracy of predictions for different models (Logistic Regression, XGBoost, K-Nearest Neighbors, Multilayer Perceptron, Random Forest)
Result:
- Home court advantage plays a large role for the outcome of NBA games. 59.5% +- 0.3% of games are won by the home town team
- The team strength calculated by an Elo-like algorithm yields great predictive power. Teams with a higher Elo/Trueskill rating win 64.3% +- 0.3% of the games. The FiveThirtyEight-Elo calculation which combines home court advantage and an Elo algorithm has an accuracy of 66.3% +- 0.3%
- The different models achieve similar accuracies
- Highest accuracy of predicting the correct winner is ~67%
Betting on the outcome of sports games has been a popular activity for a long time. Professional Odd-makers can use data collected in the past to predict the probability of future events. The more precise these predicted probabilities are the more profit can be generated from betting people.
The data was collected from three different sources:
- nba_api: API Client for www.nba.com
- Team stats for each game played in the NBA
- FiveThirtyEight (FTE):
- FTEs own Elo calculation described in this article. A nice visualization is provided in this article
- payroll data for the NBA teams scraped from Hoopshype.com
List of Features investigated:
- is_back_to_back: True if the team has played a game on the day before
- fraction_total_payroll: payroll(team)/Sum of all payrolls
- ELO: standard Elo value
- ELO_winprob: win probability calculated from the Elo of both teams
- trueskill_mu: Elo equivalent for Trueskill
- trueskill_winprob: Approximate win probability from the Trueskill of both teams
- FTE_ELO: Elo calculated by FiveThirtyEight (FTE)
- FTE_ELO_winprob: win probability provided by FTE and based on FTE_ELO
- payroll_oppo_ratio: payroll(team)/payroll(opponent)
- won_last_game: True if the team has won its last game
The following features are averaged over the last 20 games (excluding the game trying to predict) (postfix: _20G):
- WL: Win/Loss record
- ELO_mean: mean of ELO
- ELO_mean_change: mean ELO change
- trueskill_mu_mean: mean of trueskill_mu
- trueskill_mu_mean_change: mean trueskill_mu change
- FTE_ELO_mean: mean FTE_ELO
- FTE_ELO_mean_change: mean FTE_ELO change
- PTS1_frac: fraction of total points scored coming from free throws
- FT_PCT: Free throw %
- PTS2_frac: fraction of total points scored coming from two-pointers
- FG2_PCT: two-pointers %
- PTS3_frac: fraction of total points scored coming from three-pointers
- FG3_PCT: three-pointers %
- PTS_oppo_ratio: pts(team) / pts(opponent)
- FGM_AST_frac: AST/FGM - fraction of field goals assited on
All features are available for the home (prefix: HOME_) and away (prefix: AWAY_) team
Other features:
- is_Playoffs: True if the game is a Playoff game
- random_winprob: random number uniformly distributed between 0 and 1. Used for validation purposes
Elo algorithms are used to estimate the strength of a team. All teams start with the same rating and after each game the rating is updated. The winning team gains rating while the opponent loses rating. The amount of rating lost/won depends on the difference in ratings before the game. In this analysis three different implementations of these algorithms
- Elo: an algorithm most famously used in Chess. All teams start with a rating of 1400 and the maximum possible adjustment per game, called the K-factor, is set to 20
- FiveThirtyEight (FTE) Elo: An adapted version of the Elo algorithm. This algorithm also takes into account the home court advantage by adding 100 ranking points to the home team for the calculation of the win probability. K-factor is set to 20.
- Trueskill: Rating system developed by Microsoft for the goal of high quality match making in online games. The mu factor represents the rating value and sigma has a similar function as the K-factor. The sigma value is set to 8 at the very beginning and is reduced by each game played. At the begin of each season it is reset to 4 in order to give the algorithm enough flexibility to adjust to changes in team strength.
The following models were tested:
- XGBoost: some of the hyper-parameters of the XGBoost model are optimized using a grid search approach with cross-validation implemented in the scikit-learn library.
- Logistic Regression
- KNN
- MLP
- Random Forrest
- From the 26000 games that were collected the first 1000 games are removed from the training in order to give the Elo and Trueskill algorithm times to settle in. Of the remaining 25000 games, 20000 are randomly collected for the training and 5000 for the test data set.
- During training the trainings data set is split using a 10-fold method for cross-validation purposes.
- The input features are normalized using the sklearn.preprocessing.StandardScalar
The following table shows the accuracy of predicting the correct winner when using low-level algorithms:
| Method | Accuracy [%] |
|---|---|
| Home team wins | 59.5 +- 0.3 |
| Trueskill | 64 +- 0.3 |
| Elo | 64.2 +- 0.3 |
| FTE Elo | 66.3 +- 0.3 |
We can see that the team with home-court advantage wins 59.5% of the time. The accuracy for Elo and Trueskill is around 64% and for the FTE-Elo algorithm (which incorparates home-court advantage and Elo) the accuracy is 66.3%. Note on uncertainties: All uncertainties are calculated using the standard deviation of a Binomial distribution which are propagated using the standard propagation of uncertainty. The only exceptions are the cases where an uncertainty from a cross-validation method is available.
The above figure shows the home team win probability per season. One interesting feature here is the significant drop for the last two seasons (2019/2020 & 2020/2021). One likely reason for this could be the Corona pandemic and the restrictions implemented by the NBA. The 2019/2020 playoffs were famously held in "The Bubble" at Disneyland and fans were only allowed to connect remotely to the games. Similar restrictions were in place for the 2020/2021 Regular season and Playoffs which can be clearly seen in the attendance rate which is roughly 6 times lower than in normal seasons. This indicates that a large portion of the home-court advantage originates from the fans cheering for their team.
This figure shows again the accuracy of predictions per season but for the FTE-Elo algorithm
The above figure shows a closure test. In the top most panel a histogram is shown in which each game is sorted into bins based on the predicted win probability for the home team using the FTE-Elo algorithm. The red colored portion of the histograms are the games in which the home team has actually won. In the middle panel the red markers show the actual win probability, i.e. the fraction of red in the bins compared to the whole bin. The bottom panel shows the ratio of predicted win probability and actual win probability. For a perfect algorithm these should be compatible with 1.
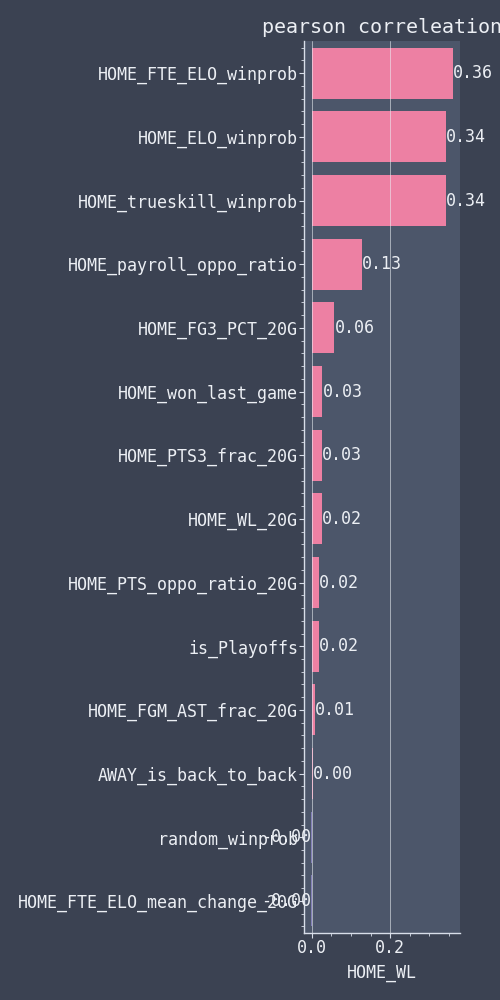
The pearson correlation of a selection of features can be seen in the following two plots:
We see that the FTE_ELO_winprob has the highest correlation with the home team winning (HOME_WL). The different Elo algorithms are also highly correlated among each other. Another feature strongly correlated with HOME_WL is the HOME_payroll_oppo_fraction which is the ratio of the home team salary over the away team salary. However, it is also highly correlated with the Elo-algorithms which makes it less useful for the algorithms that are being tested. But it does show the not so surprising fact that if you want to have a strong team, you should be willing to spend more money than the other teams. This is further illustrated in the following scatter plot.
For each season and team a point in the scatter plot represents the FTE-Elo the team had on the last day of the season and its payroll.
The Shap python package allows to efficiently calculate the Shapely values that are widely used in game theory. These values can be interpreted as a measure of feature importance (See here for an in-depth explanation). The following shows this interpretation for the 20 most important features of the XGBoost model:
As we can see, the Elo-based algorithm have the biggest impact on the decision making in the XGBoost model that was trained.
Model accuracies when including all features:
| Algorithm | Test [%] | Validation [%] | Train [%] |
|---|---|---|---|
| Logistic Regression | 67.6 +- 0.7 | 66.5 +- 0.9 | 66.7 +- 0.3 |
| XGBoost | 67.1 +- 0.7 | 66 +- 0.9 | 66.9 +- 0.3 |
| Random Forrest | 67 +- 0.7 | 66.5 +- 1 | 66.6 +- 0.3 |
| MLPClassifier | 67.7 +- 0.7 | 66.4 +- 0.8 | 67 +- 0.3 |
| KNN | 66.8 +- 0.7 | 65.3 +- 0.9 | 67.4 +- 0.3 |
The accuracies calculated on the train, validation and test set are compatible with each other, ensuring that no significant over-fitting is present. These accuracies are not significantly different from those obtained only using the FTE-Elo algorithm for prediction.
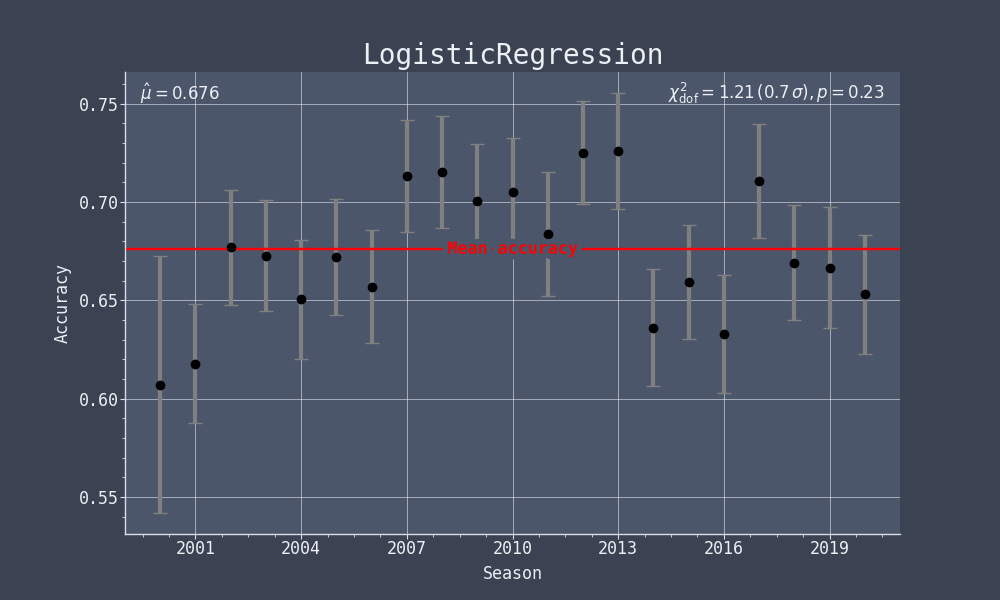
The following two plots show the prediction accuracy and the closure test for the logistic regression model. For a detailed explanation please see the description for the version of these plots with the FTE-Elo algorithm. Note that these plots were made using the test data set and therefore have a larger uncertainty compared to the equivalent FTE-Elo plots which were made using the full data set.
Based on the p-value (0.23) we can see that the prediction accuracy per season is compatible with the over all mean accuracy.
The p-value (0.6) for this plot shows that the predicted probabilities and the actual probabilities are compatible within the binning chosen. This is a good sign for being a profitable method of setting betting odds.
The training was also performed with a reduced number of features (13, 3 and 2) but the accuracy did not change significantly.
Using the methods described here the winner of an NBA game can be predicted with an accuracy of ~67%. The most influential parameters for the predictions are which team is playing on their home court and what win probability is given by the FTE-Elo algorithm. Other features that were investigated showed no significant improvement.
- Player transactions and injuries can have a big impact on the team strength and the elo algorithms need some time to adjust for this. Including this data in the algorithms could improve the accuracy of predictions
- Compare to accuracy of predictions from Odd-makers
- Check differences in predicted probabilities compared to Odd-makers
Getting Started
- python 3.10
- python poetry
poetry install
pre-commit installA Docker image is also available:
docker pull janikvapp/nba-game-prediction:latestScripts should be run in the following order:
poetry shell
python nba_game_prediction/scripts/collect_game_data.py
python nba_game_prediction/scripts/create_train_data.py
python nba_game_prediction/scripts/plot_train_data.py
python nba_game_prediction/scripts/train_model.py
Running plot_train_data.py is optional
Most Configuration can be done using the config file in data/config.yaml
Only running unit tests:
make testsRunning integration tests (this is slow):
make integration


