Repository for 3D Eit measurement with a modified Ender 5 3D printer and the ScioSpec Eit device.
Based on: sciospeceit
The standart full measurement notebook is provided here.
Import the required libraries:
from src.classes import BallAnomaly, HitBox, TankProperties32x2
from src.functions import compute_hitbox, create_meas_coordinates, print_coordinates_props
from src.visualization import plot_meas_coords, plot_meas_coords_wball
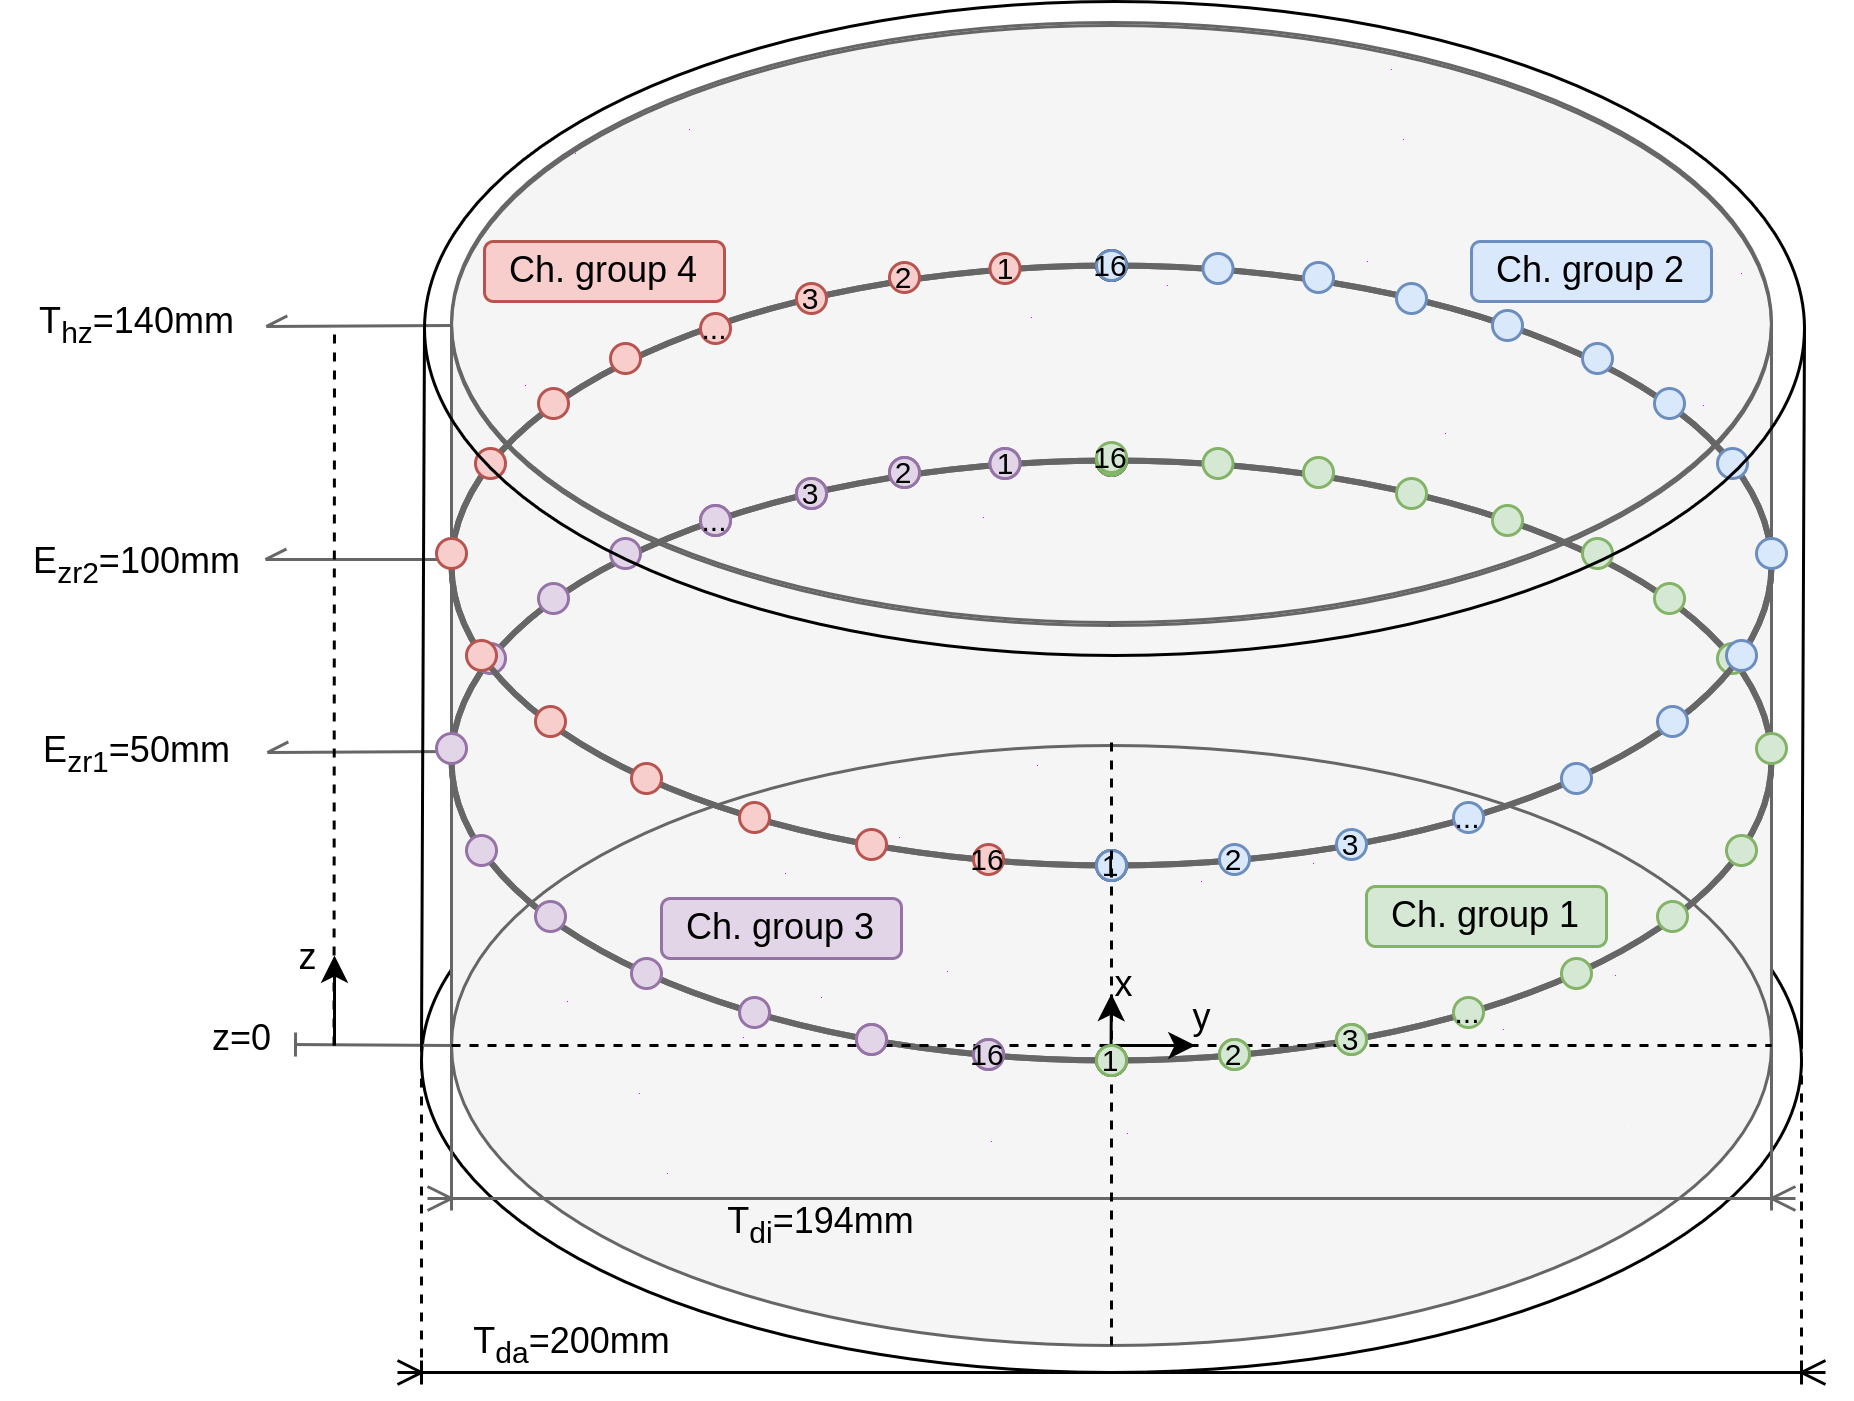
Define variables that contain the information and parameters of the tank, ball, and hitbox, saved in the provided dataclasses.
tank = TankProperties32x2()
ball = BallAnomaly(x=0, y=0, z=0, r=20, material=None)
hitbox = compute_hitbox(tank, ball, safety_tolerance=0)
Create the measurement coordinates using the create_meas_coordinates() function.
This function uses the numpy np.meshgrid function. Mind that the final x,y,z meshgrid is masked by the hitbox to prohibite collisions with the phantom tank.
This means that the final number of measurements is much smaller than x_pts$\cdotz_pts
coordinates = create_meas_coordinates(hitbox, x_pts=20, y_pts=20, z_pts=10)
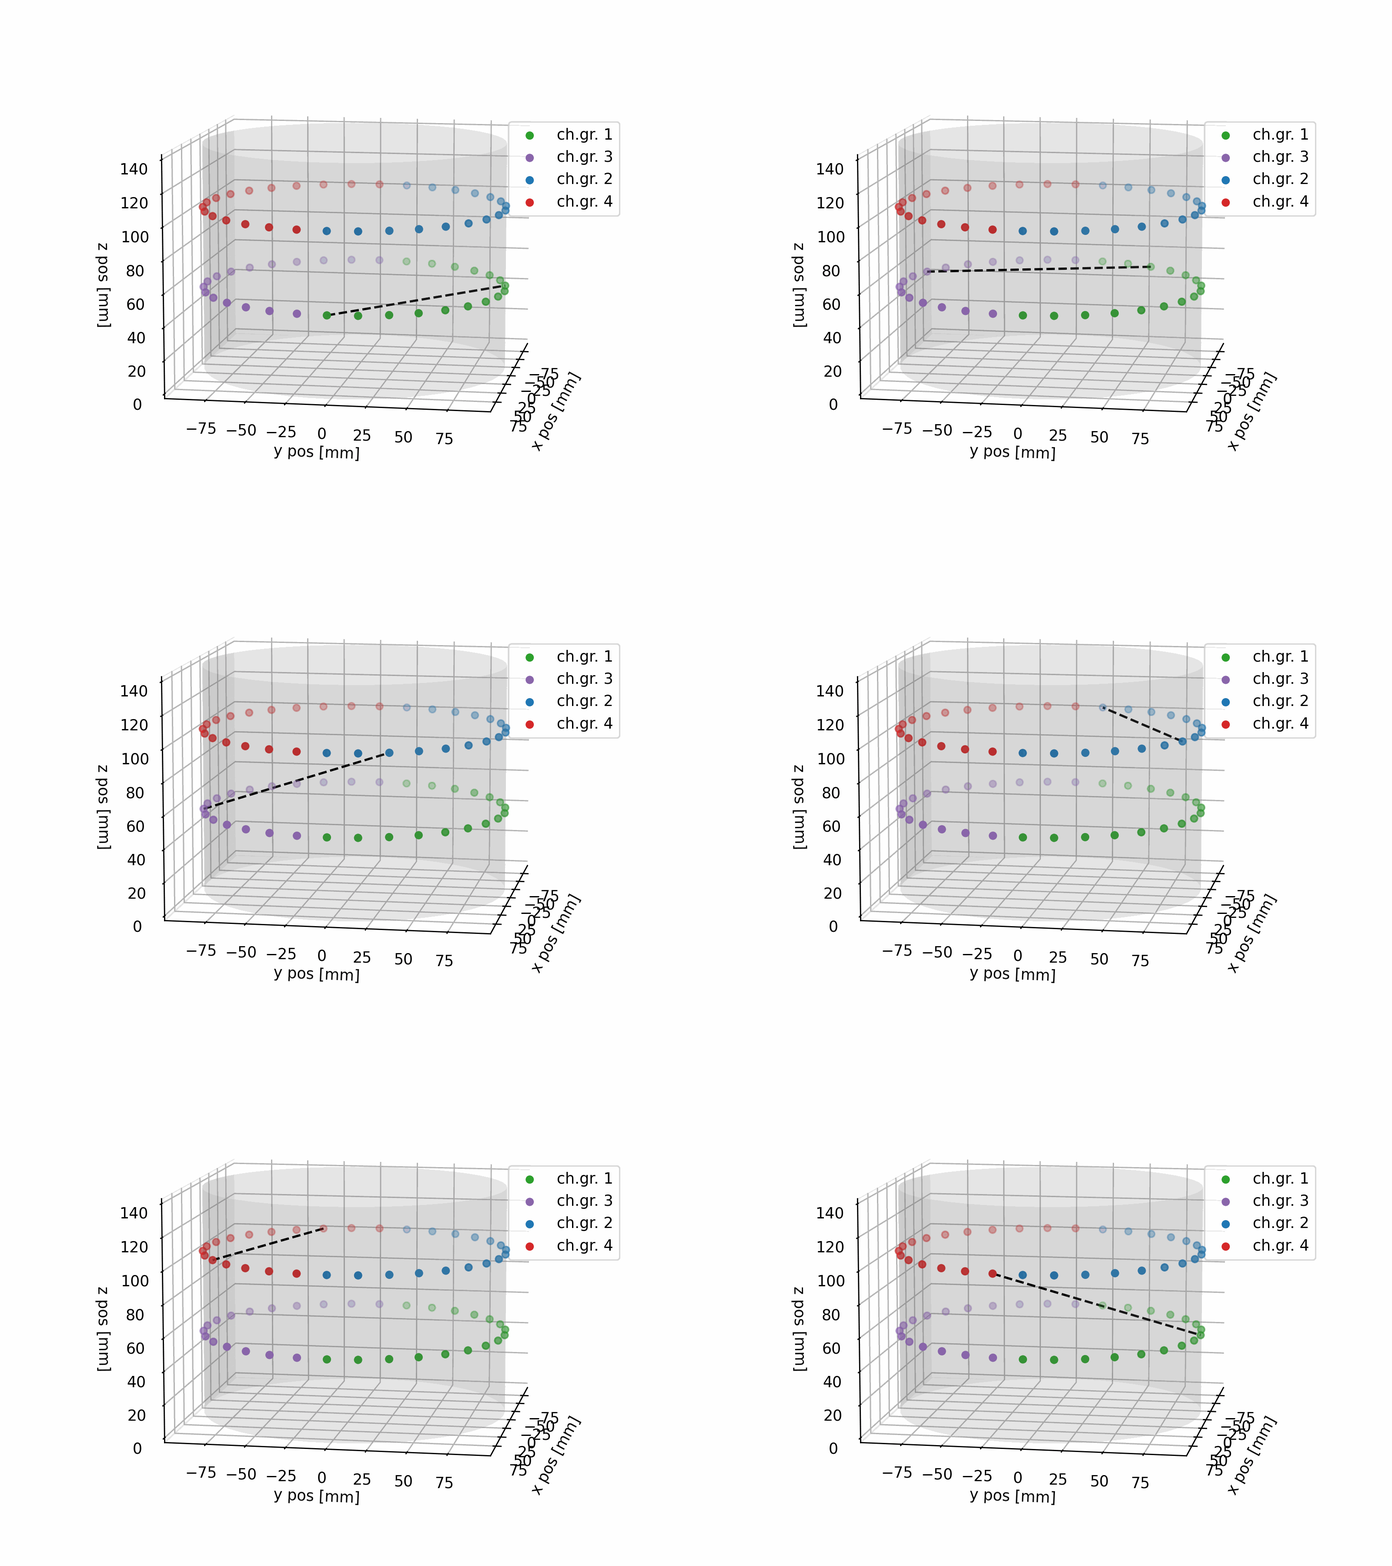
To get further information about coordinates you can apply the function print_coordinates_props().
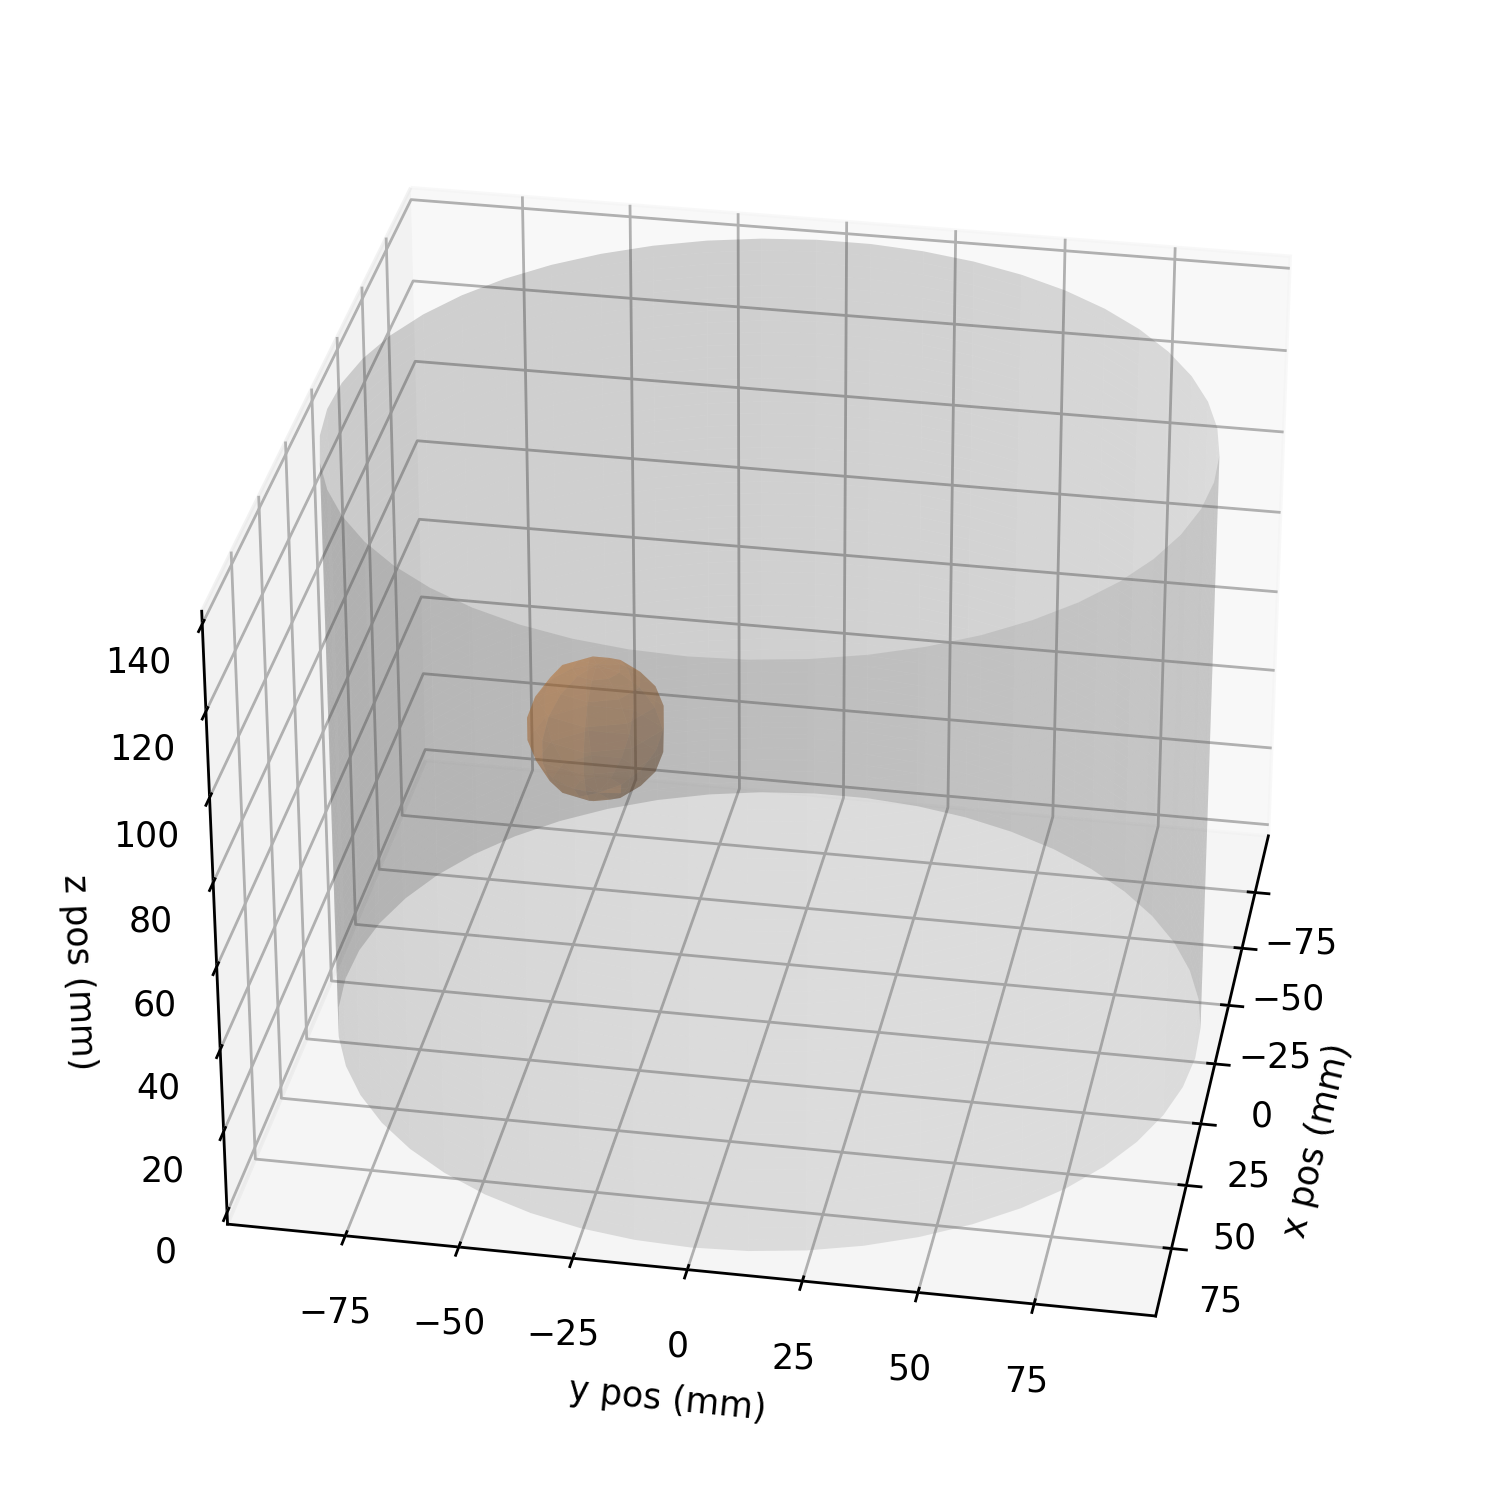
For visualizing the created points the two functions plot_meas_coords() and plot_meas_coords_wball() are provided. For further information, call the docstring documentation.
plot_meas_coords_wball(tank=tank, meas_coords=coordinates, ball=ball, p_select=34)
For ground truth visualization a point cloud is used. The corresponding class and "mesh" generation can be used by:
# define tank and object properties
tank = TankProperties32x2()
ball = BallAnomaly(x=0, y=0, z=50, r=20, perm=10, material="acryl-glass")
mesh_obj = create_mesh(tank)
# visualization
plot_mesh(mesh_obj, tank, show_tank_brdr=True)
# set the perm
mesh_obj = set_perm(mesh_obj, ball)
The Ender 5 is used for object placement and movement inside the phantom tank. The nozzle for printing was replaced with a mounting construction.
The coordinate system for controlling the Ender 5 is different from the python standard coordinate axis. The


