Try this chatbot in
- Telegram and
- Web Demo (text-only chat).
A version for Facebook Messenger (here's the bot page) (very similar to the one in Telegram) is also available but not public yet (waiting for approval; in case anybody is interested I can add you to testers on FB).
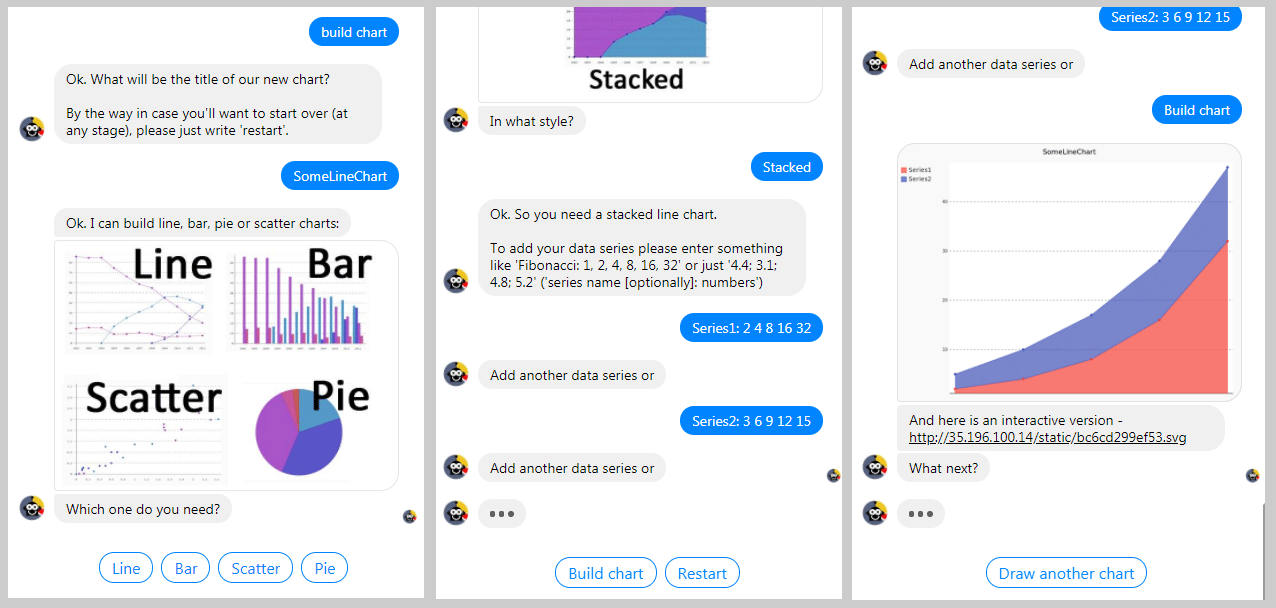
Here’s how it looks in Telegram and Web Demo:

And here’s the version for Facebook Messenger:
General info
This chatbot was build for learning purposes/proof of concept, without specific practical assignment, and is open source (including Dialogflow’s part - see PlotBot.zip).
PlotBot can build bar, line, pie charts (each in several subtypes like basic/horizontal/stacked for bar and line charts and basic/”donut”/half-pie in case of pie charts), and also scatter diagrams. Webhooks are written on Python. Pygal python library is used for charting. Charts are presented as png and svg (interactive) images. I'm hosting my webhooks on a server with Ubuntu and nginx, which is working on a virtual machine in Google Cloud.
Structure
Intents structure for PlotBot is as follows (a big image 5k pixels width ;):

These scheme seems to be rather redundant and already now, after building my 2nd chatbot I would have shortened it to 1 block instead of 4 with using more webhooks.
Entities (chart types and subtypes/styles) - quite simple:

Possible further improvements
If desired,
- PlotBot can be restructured from current rigid “slot-filling” style when it successively defines chart name >> chart type >> chart subtype >> data series to a more intelligent one, for example, to understand complex user-initiated inputs like “build bar chart for data 10, 20, 30, 40”;
- as I’ve mentioned the structure of the bot probably can be simplified on the Dialogflow’s side by using more webhooks;
- in addition to the 4 chart types that PlotBot can already build other chart types can be added. Also another charting library or service can be used instead of Pygal (for example, I thought about DASH).
- porting to other platforms (besides Telegram and FB),
but I decided to stop with this bot where it is and proceed to my other ideas/topics to learn.