This package contains tools for visualizing profiling data collected with Julia's built-in sampling profiler. It can be helpful for geting a big-picture overview of the major bottlenecks in your code, and optionally highlights lines that trigger garbage collection as potential candidates for optimization.
This type of plot is known as a flame graph.
Within Julia, use the package manager:
Pkg.add("ProfileView")To demonstrate ProfileView, first we have to collect some profiling data. Here's a simple test function for demonstration:
function profile_test(n)
    for i = 1:n
        A = randn(100,100,20)
        m = max(A)
        Afft = fft(A)
        Am = mapslices(sum, A, 2)
        B = A[:,:,5]
        Bsort = mapslices(sort, B, 1)
        b = rand(100)
        C = B.*b
    end
end

profile_test(1)  # run once to trigger compilation
Profile.clear()  # in case we have any previous profiling data
@profile profile_test(10)
ProfileView.view()
Now that we have profiling data, visualizing it is a simple matter:
julia> using ProfileView

julia> ProfileView.view()
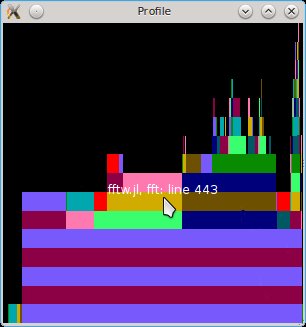
If you're following along, you should see something like this:
This plot is a visual representation of the call graph of the code that you just profiled. The "root" of the tree is at the bottom; if you move your mouse over the long horizontal purple bar at the bottom, you'll see it's _start in client.jl. As is explained elsewhere, this is the first Julia function called in launching the REPL. If you move your mouse upwards, you'll see the nest of functions called by _start, including run_repl, eval_user_input, etc.
While the vertical axis therefore represents nesting depth, the
horizontal axis represents the amount of time (more precisely, the
number of backtraces) spent at each line. One sees on the 6th line
from the bottom, there are several differently-colored bars, each
corresponding to a different line of profile_test. The fact that
they are all positioned on top of the lower purple bar means that all
of these lines are called by the same "parent" function. Within a
block of code, they are sorted in order of increasing line number, to
make it easier for you to compare to the source code.
From this visual representation, we can very quickly learn several things about this function:
-
The most deeply-nested line corresponds to
mapslices(sort, B, 1), resulting in the tall "stack" of bars on the right edge. However, this call does not take much time, because these bars are narrow horizontally. -
In contrast, the two most time-consuming operations are the calls to
fftandmapslices(sum, A, 2). (This is more time-consuming than themapslices(sort,...)simply because it has to process more data.) -
In this plot, red is a special color: it is reserved for function calls that trigger garbage collection, a time-consuming process that often serves as a bottleneck. Here one could see an example of garbage-collection occuring inside
fftw.jl's fft(),fftw.jl's Plan(), and in the lineB = A[:,:,5]. -
You may notice some very narrow bars along the bottom at the left edge of this plot. If you hover over them, you'll see that these correspond to operations that are performed by your code, but whose "parents" are not known. These are the highly-offensive (well, to the author) truncated backtraces. Whistle a happy tune and pretend they aren't there (although of course they, like all other operations, contribute to the total run-time of your code).
Further discussion of the proper interpretation of the red bars can be found below.
-
Right-clicking on a bar will cause information about this line to be printed in the REPL. This can be a convenient way to "mark" lines for later investigation.
-
Click-drag lets you zoom in on a specific region of the image. Double-click to restore the full view.
The view command has the following syntax:
function view(data = Profile.fetch(); C = false, colorgc = true, fontsize = 12, combine = true)
Here is the meaning of the different arguments:
-
The first is the vector containing backtraces. You can use
data1 = copy(Profile.fetch()); Profile.clear()to store and examine results from multiple profile runs simultaneously. -
Cis a flag controlling whether lines corresponding to C and Fortran code are displayed. (Internally, ProfileView uses the information from C backtraces to learn about garbage-collection and to disambiguate the call graph). -
colorgc, whentrue, causes lines triggering garbage-collection to be displayed in red. -
fontsizecontrols the size of the font displayed as a tooltip. -
combineis explained elsewhere.
You should expect the width and placement of the red bars to vary from one profile to the next, because garbage-collection is an infrequent event and therefore highly variable.
Lines triggering garbage-collection are often fruitful targets for optimization. However, note that red bars indicate garbage-collection, not allocation, and in reality it's the latter that is usually the true source of trouble. It's quite possible to have a large allocation that procedes without garbage collection (and therefore doesn't take much time), only to be followed by a tiny allocation that triggers garbage collection but which cannot itself be profitably optimized. Your best way to avoid being fooled is to collect quite a lot of profiling data (i.e., run your code for longer), so that all operations allocating memory will likely trigger a garbage-collection at some point.
