Python script for crypto trading analysis using RSI and MACD indicators. It's a personal study script for education purposes ONLY.
Create a python script using Binance API and Pandas TA that can indicate buy and sell operations aiming profit in the crypto market. Utilizing Relative Strength Index (RSI) and Moving Average Convergence/Divergence (MACD), both technical indicators in the financial market.
The strategy of this script was based on article How to Use RSI and MACD Indicators to Have Profitable Crypto Trades (Ehsan Yazdanparast, 2021).
It's composed by two technical indicators and has 4 steps to complete an operation. Steps for an operation:
- Buy signal (RSI);
- Buy confirmation (MACD);
- Sell signal (RSI);
- Sell confirmation (MACD).
After one complete operation, it's possible to evaluate the profit.
In the article the data was evaluated every 4 hours, so, the time frame was 4 hours. But it's totally possible to try different setups for the strategy, for example, I've used the 1 hour time frame. The possible time frames can be consulted here.
As this is an analysis based on past data, it's necessary to indicate the whole time frame of the analysis.
RSI will be used for buy and sell signals (that have to be approved by MACD).
- Length: 10;
- Source: Closed values.
RSI line must to goes below 30 and after touches back the line of 30 again, so a buy signal is flagged.
If the RSI line goes above 70, a sell signal is flagged.
MACD will be used for buy and sell confirmations.
- Fast Length: 8;
- Slow Length: 21;
- Signal Smoothing: 5;
- Source: Closed values;
- Oscillator MA Type: EMA;
- Signal Line MA Type: EMA.
After a buy signal, if "MACD line" goes over the "Signal line" a buy confirmation is flagged.
After a buy signal, if "MACD line" goes below the "Signal line" a buy confirmation is flagged.
Will be disposed three scripts (main.py, keys.py and time_set.py). The first one is the software that will perform the connection with Binance, obtain the data, do the analysis, etc. The second one, it's a template for your Binance API keys, that the "main.py" utilizes for doing the connection. The third one, it's a script that I used to set the time of my laptop equal to the Binance server time, just if you need.
It's necessary to create an API from your Binance Account and then replace your API key and secret key in the file "keys.py". When you run the main.py script, it will use these keys to connect into your Binance account.
Select the symbol of a currency that you have interest in.
If you run the script, the data will be obtained automatically. If you would like to use a different source of data, it's possible.
The indicators will be obtained with the Pandas TA library.
Will be performed the previously mentioned strategy.
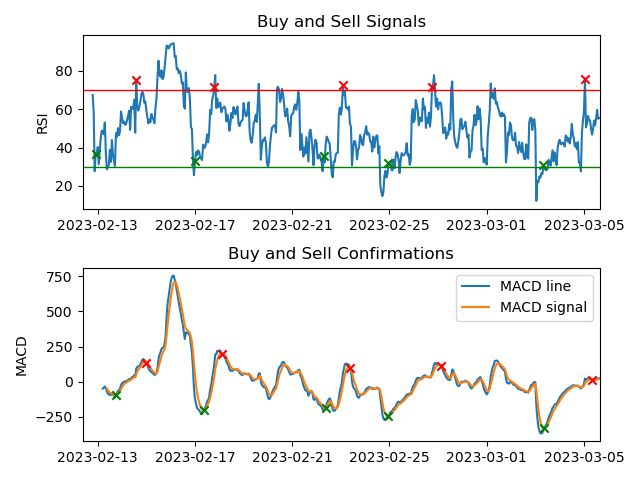
Will be showed a simulation of the strategy with an initial value that you can change. A RSI and MACD plot, with the points of interest, will be showed.
- Binance API;
- Pandas;
- Pandas TA;
- Matplotlib;
- NumPy.
Here is a run done in 05 mars 2023 17h24 (GMT +01). I used "1HOUR" as the time frame, "512 hours ago" as the whole time frame and "BTCUSDT" as the currency symbol.
Each x are signals or confirmations points. The greens for buy and the reds for sell.
---------- Operations Records ----------
BUY - 2023-02-12 22:00:00 - BTC: $21794.52
SELL - 2023-02-14 14:00:00 - BTC: $22247.39
BUY - 2023-02-17 00:00:00 - BTC: $23713.37
SELL - 2023-02-17 19:00:00 - BTC: $24524.49
BUY - 2023-02-22 07:00:00 - BTC: $24060.95
SELL - 2023-02-23 02:00:00 - BTC: $24531.61
BUY - 2023-02-24 23:00:00 - BTC: $23185.29
SELL - 2023-02-26 18:00:00 - BTC: $23486.43
BUY - 2023-03-03 08:00:00 - BTC: $22430.33
SELL - 2023-03-05 01:00:00 - BTC: $22591.68
---------- Results ----------
Initial Wallet: $500.00
Post-operations Wallet: $542.30
Profit: $42.30
Percentage of profit: 8.46%
