rapa provides a robust, freely usable and shareable tool for creating and analyzing more accurate machine learning (ML) models with fewer features in Python. View documentation on ReadTheDocs.
rapa is currently developed on top of DataRobot's Python API to use DataRobot as a "model-running engine", with plans to include open source software such as scikit-learn, tensorflow, or pytorch in the future. Install using pip!
Contents
pip install rapa
Majority of rapa's utility comes from the DataRobot auto-ML platform. To utilize DataRobot through Python, an API key is required. Acquire an API key from app.datarobot.com after logging into an account. (More information about DataRobot's API keys)
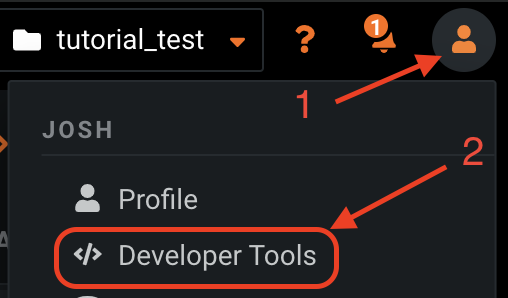
First, log in and find the developer tools tab.
Then create an API key for access to the API with Python.
NOTE
This API key lets anyone who has it access your DataRobot projects, so never share it with anyone.
To avoid sharing your API accidentally by uploading a notebook to github, it is suggested to use the rapa function to read in a pickled dictionary for the API key or using datarobot's configuration for authentication.
Once having obtained an API key, use rapa or datarobot to initialize the API connection.
Using rapa, first create the pickled dictionary containting an API key.
# DO NOT UPLOAD THIS CODE WITH THE API KEY FILLED OUT
# save a pickled dictionary for datarobot api initialization in a new folder named 'data'
import os
import pickle

api_dict = {'tutorial':'APIKEYHERE'}
if 'data' in os.listdir('.'):
    print('data folder already exists, skipping folder creation...')
else:
    print('Creating data folder in the current directory.')
    os.mkdir('data')

if 'dr-tokens.pkl' in os.listdir('data'):
    print('dr-tokens.pkl already exists.')
else:
    with open('data/dr-tokens.pkl', 'wb') as handle:
        pickle.dump(api_dict, handle)
Then use rapa to initialize the API connection!
# Use the pickled dictionary to initialize the DataRobot API
import rapa

rapa.utils.initialize_dr_api('tutorial')
rapa.utils.initialize_dr_api takes 3 arguments: token_key - the dictionary key used to store the API key as a value, file_path - the pickled dataframe file path (default: data/dr-tokens.pkl), endpoint - and the endpoint (default:https://app.datarobot.com/api/v2).
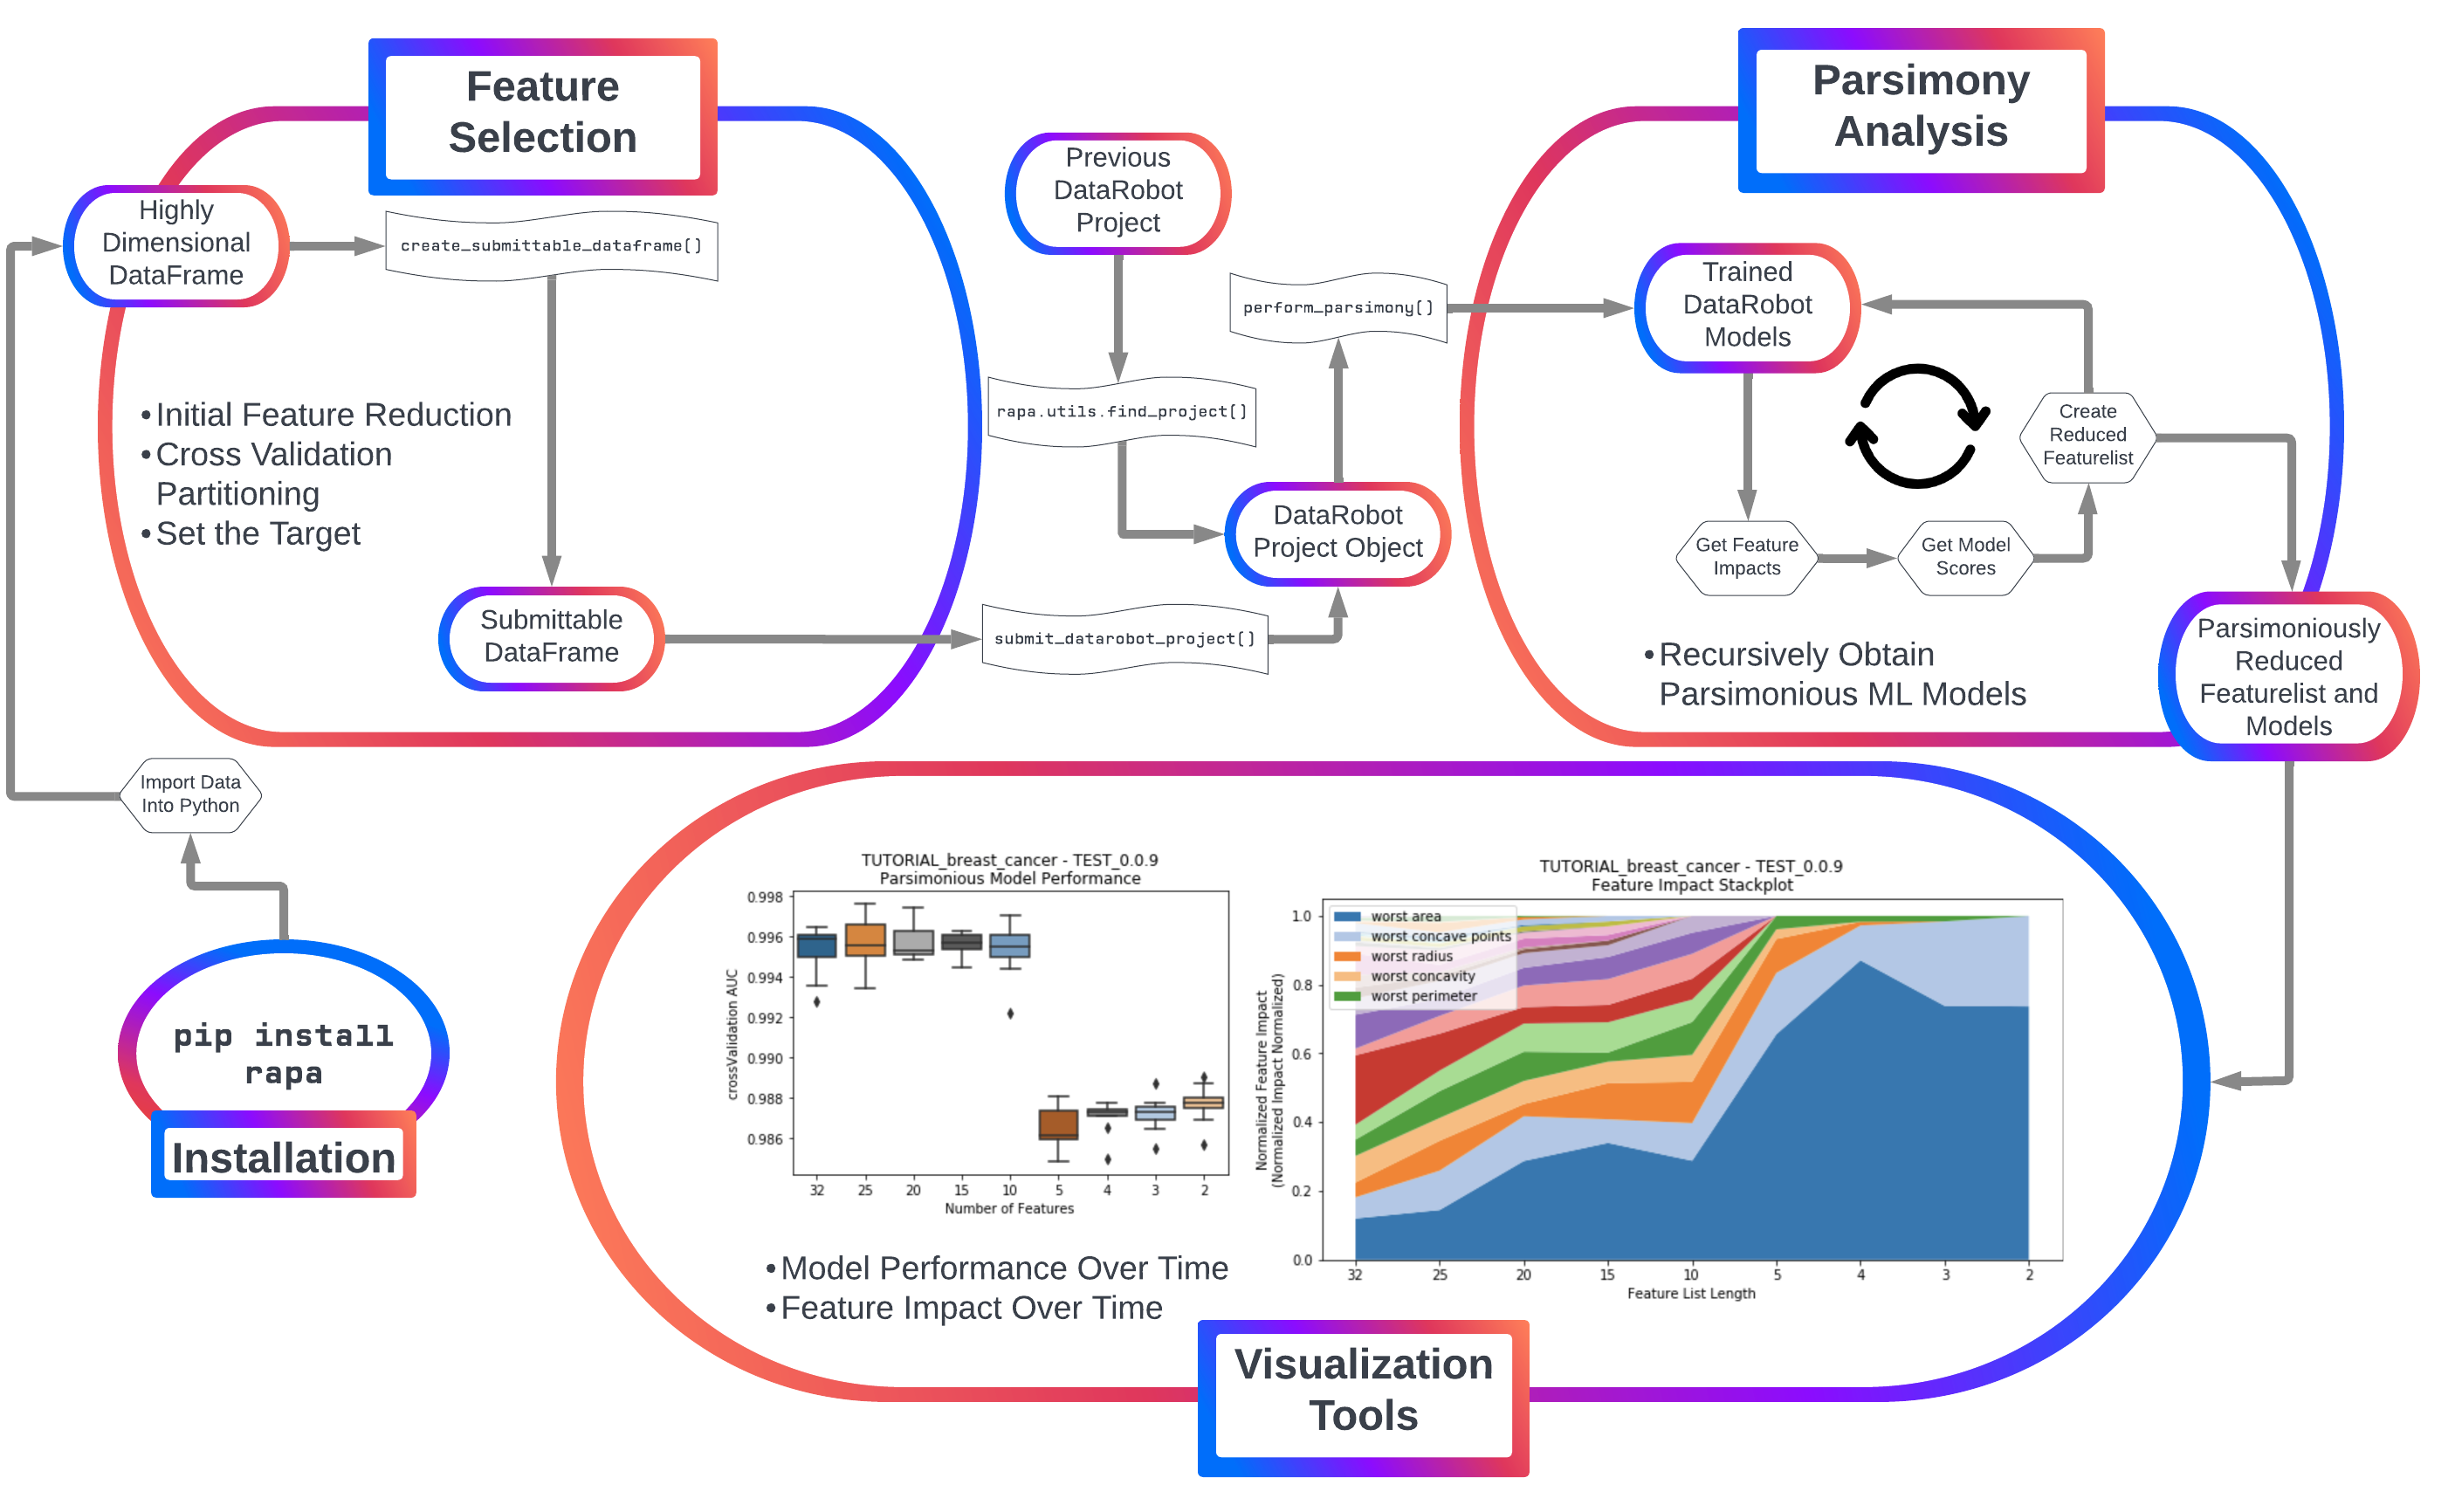
Currently, rapa provides two primary features:
1. Initial feature filtering to reduce a feature list down to a size that DataRobot can receive as input.
2. Automated parsimony analysis using feature importance metrics directly tied to the feature's impact on accurate models (permutation importance).
Automated machine learning is easily applicable to samples with fewer features, as the time and resources required reduces significantly as the number of initial features decreases. Additionally, DataRobot's automated ML platform only accepts projects that have up to 20,000 features per sample.
For feature selection, rapa uses sklearn's f_classif or f_regression to reduce the number of features. This provides an ANOVA F-statistic for each sample, which is then used to select the features with the highest F-statistics.
# first, create a rapa classification object
rapa_classif = rapa.Project.Classification()

# then provide the original data for feature selection
sdf = rapa_classif.create_submittable_dataframe(input_data_df=input,
                                                target_name='target_column',
                                                n_features=2000)
NOTE
When calling create_submittable_dataframe, the provided input_data_df should have all of the features as well as the target as columns, and samples as the index.
If the number of features is reduced, then there should be no missing values.
To start automated parsimony analysis using Datarobot, a DataRobot project with a target and uploaded data must already be created.
To use a previously created DataRobot project, you must have access to the project with the account that provided the API key.
- First, initialize the API connection with an API key that provides access to the project of interest.
rapa.utils.initialize_dr_api('tutorial')- Then, provide either a project id or unique project name to
rapa.utils.find_projectand get adatarobot.models.Projectobject for further analysis.
project = rapa.utils.find_project('PROJECT_OF_INTEREST')When creating a new DataRobot project, the API key used should be from an account which the project will be created. Additionally, the data for training will be submitted, and the target will be provided and selected with the API.
- First, initialize the API connection with an API key that provides access to the account where the project will be created.
rapa.utils.initialize_dr_api('tutorial')- Load the data for machine learning using
pandas
# load data (make sure features are columns, and samples are rows)

from sklearn import datasets # data used in this tutorial
import pandas as pd # used for easy data management

# loads the dataset (as a dictionary)
breast_cancer_dataset = datasets.load_breast_cancer()

# puts features and targets from the dataset into a dataframe
breast_cancer_df = pd.DataFrame(data=breast_cancer_dataset['data'], columns=breast_cancer_dataset['feature_names'])
breast_cancer_df['benign'] = breast_cancer_dataset['target']- Create a
rapaobject for either classification or regression (this example is a classification problem)
# Creates a rapa classifcation object
bc_classification = rapa.Project.Classification()- Make a DataRobot submittable dataframe using
create_submittable_dataframe
# creates a datarobot submittable dataframe with cross validation folds stratified for the target (benign)
sub_df = bc_classification.create_submittable_dataframe(breast_cancer_df, target_name='benign')
NOTE
rapa's create_submittable_dataframe takes the number of features to initially filter to.
If filtering features, either the sklearn function sklearn.feature_selection.f_classif or sklearn.feature_selection.f_regression is used depending on the rapa instance that is called. In the case of this example, the function is being called by a Project.Classification object, so f_classif will be used.
Additionally, create_submittable_dataframe can take a random state as an argument. When changing the random state, the features that are filtered can sometimes change drastically. This is because the average ANOVA F score over the cross-validation folds is calculated for selecting the features, and the random state changes which samples are in each cross-validation fold.
- Finally, submit the 'submittable dataframe' to DataRobot as a project
# submits a project to datarobot using our dataframe, target, and project name.
project = bc_classification.submit_datarobot_project(input_data_df=sub_df, target_name='benign', project_name='TUTORIAL_breast_cancer')
NOTE
This will run DataRobot's autopilot feature on the data submitted.
Once a DataRobot project object is loaded into Python, the parsimonious model analysis can begin.
Using an initialized rapa object (Project.Classification or Project.Regression), call the perform_parsimony function. This function returns None.
# perform parsimony on the breast-cancer classification data
# use a featurelist prefix `TEST`
# start with the `Informative Features` featurelist provided by datarobot
# use a feature range starting with 25 features, down to 1
# have 5 `lives`, so if the models do not become more accurate, it will stop feature reduction
# try and reduce overfitting with a cross-validation average mean error limit of 0.8
# graph feature performance over time, as well as model performance
bc_classification.perform_parsimony(project=project,
                                    featurelist_prefix='TEST',
                                    starting_featurelist_name='Informative Features',
                                    feature_range=[25, 20, 15, 10, 5, 4, 3, 2, 1],
                                    lives=5,
                                    cv_average_mean_error_limit=.8,
                                    to_graph=['feature_performance', 'models'])
While running perform_parsimony, rapa is checking job status with DataRobot. This is displayed to the user as printed statements while running the function. Additionally, if the progress_bar argument is True, the tqdm progress bar will display updates in text.
NOTE
The perform_parsimony function takes, at minimum, a list of desired featurelist sizes (feature_range) and a DataRobot project (project). Additional arguments allow for choosing the featurelist to begin parsimonious feature reduction (starting_featurelist), what prefix to use for rapa reduced featurelists (featurelist_prefix), what metric to use for deciding the 'best' models (metric), which visuals to present (to_graph), etc. To get in-depth descriptions of each argument, visit the documentation for perform_parsimony.
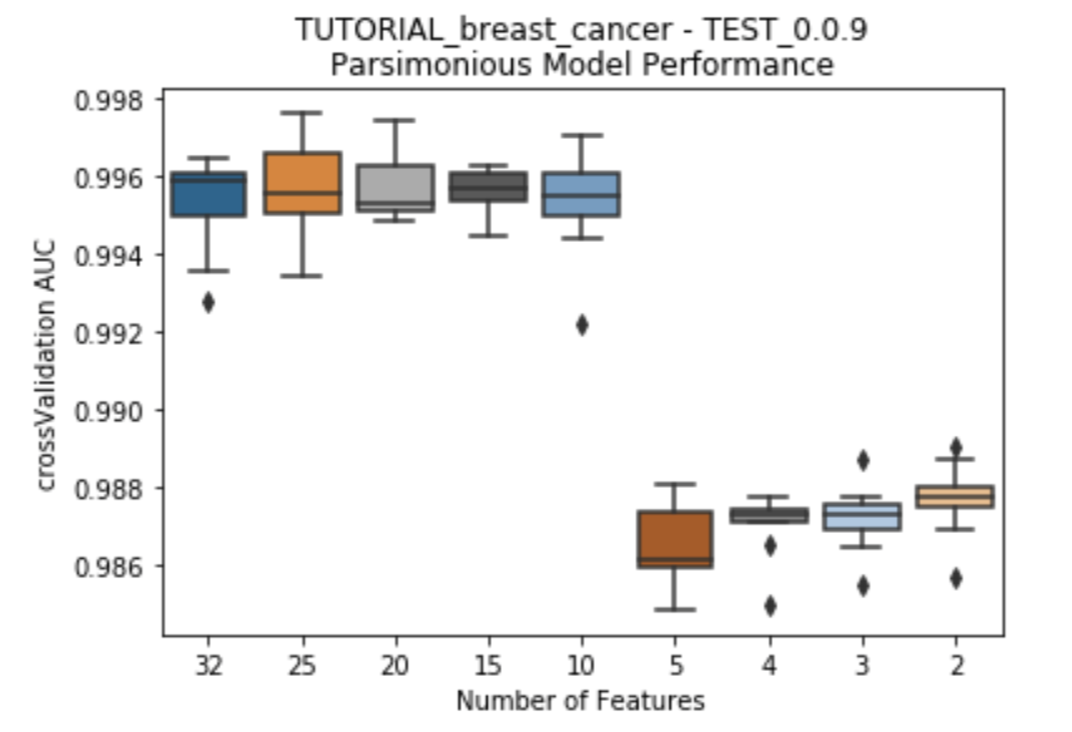
To present to the user the trade-off between the size of Feature List and the model performance for each Feature List, a series of boxplots can be plotted. The y-axis uses the chosen measurment of accuracy for the models (AUC, R-squared, etc.), while the x-axis has the featurelist sizes decreasing from left to right. Choose to plot either after each feature reduction during parsimony analysis (provide the argument to_graph=['models'] to perform_parsimony), or use the function rapa.utils.parsimony_performance_boxplot and provide a project and the featurelist prefix used.
rapa.utils.parsimony_performance_boxplot(project=project,
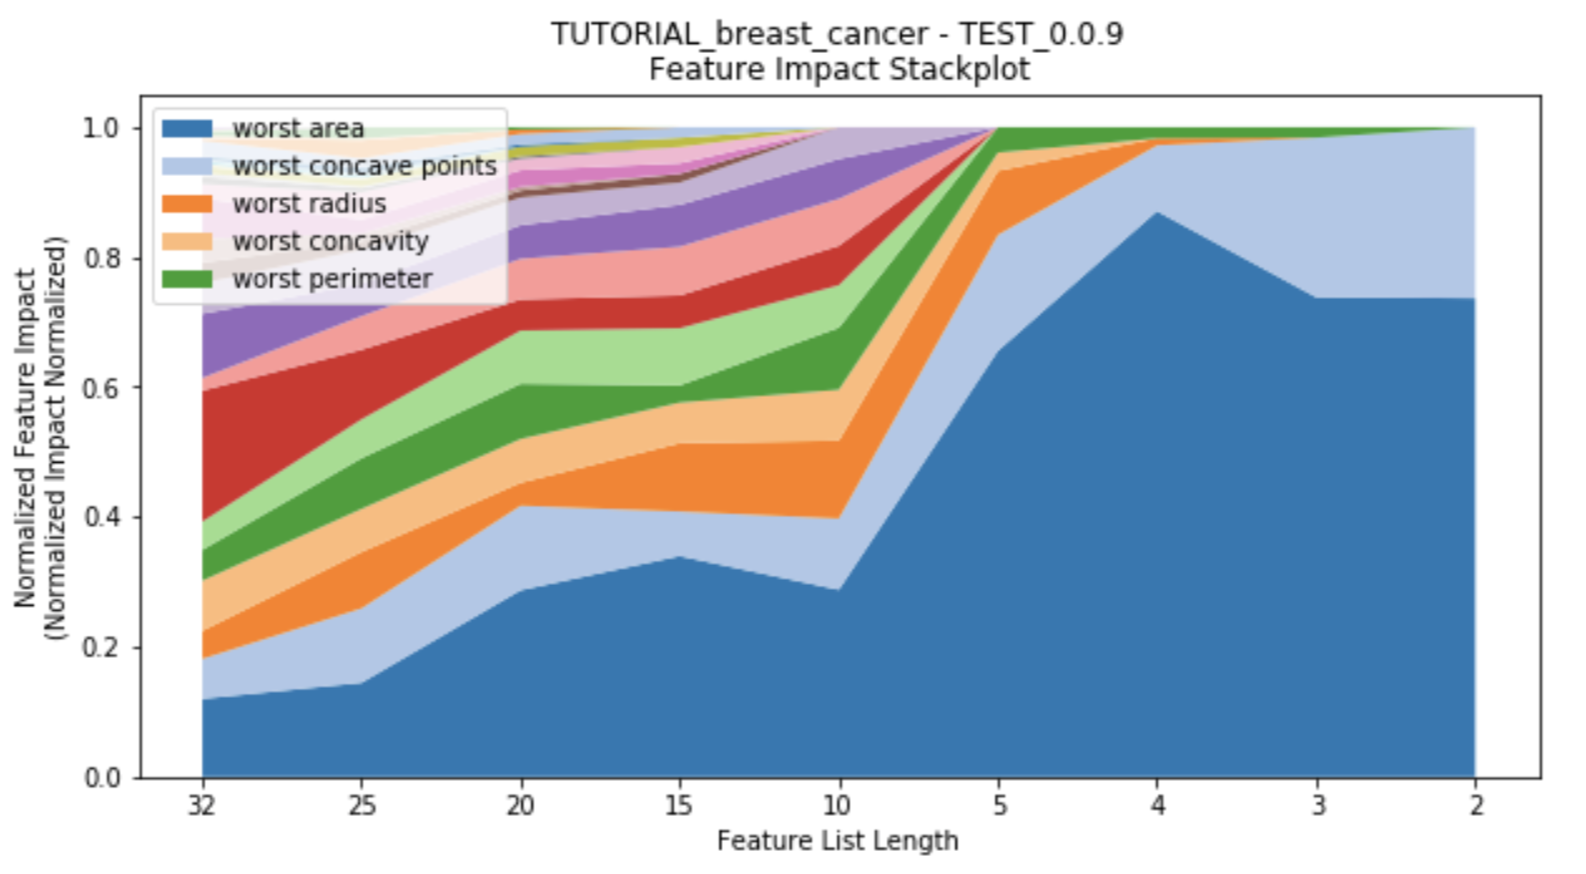
starting_featurelist='Informative Features')While the number of features decreases, each feature's impact changes as well. Features which had previously had high impact on the models with many other features may no longer have significance once more features are removed. This suggests towards the multi-variate nature of feature impact and it's ability to create parsimonious models. A stackplot using height in the y-axis to represent impact provides insight into the evolution of each feature's impact as the number of features decreases. Choose to plot either after each feature reduction during parsimony analysis (provide the argument to_graph=['feature_performance'] to perform_parsimony), or use the function rapa.utils.feature_performance_stackplot and provide a project and the featurelist prefix used.
rapa.utils.feature_performance_stackplot(project=project,
starting_featurelist='Informative Features')In addition to this readme, there is a tutorial for using rapa with DataRobot and readily available data from sklearn that is currently demonstrated in general_tutorial.ipynb, which is also in the documentation.
Although the current implementation of these features will be based on basic techniques such as linear feature filters and recursive feature elimination, we plan to rapidly improve these features by integrating state-of-the-art techniques from the academic literature.


