Daily resetting ETFs are often called a poor long term investment. This is mainly because of volatility decay, also called beta decay. The most common example I see is that whenever the underlying index drops 10% then gains 10% the next day, a leveraged portfolio would lose a lot more value compared to the underlying.
Underlying: 100 -> 90 -> 99 - 1% loss
3x Leverage: 100 -> 70 -> 91 - 9% loss
A 9% loss is not a 3x of 1% loss!
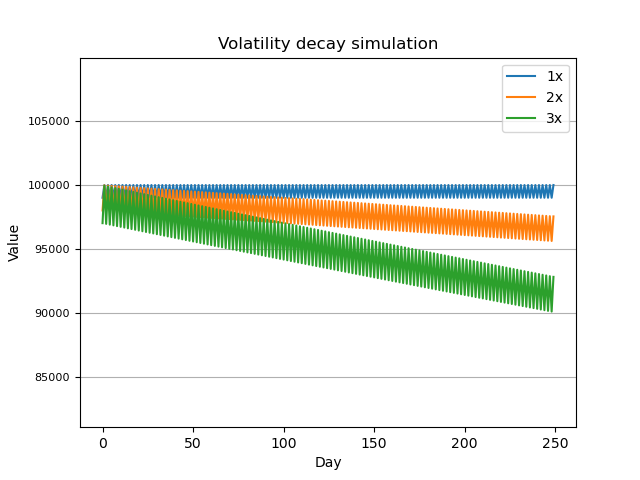
A plot showing what it means in practice:
What is often forgotten, is that the daily resetting also helps and serves as protection in some cases. Let's take an example where the underlying drops 10% four days in a row:
Underlying: 100 -> 90 -> 81 -> 73 -> 65 - 35% loss
3x Leverage: 100 -> 70 -> 49 -> 35 -> 24 - 76% loss
A 76% loss is a lot less than 3x of 35% loss. If it did not reset daily, the leveraged portfolio would be wiped out as 35*3 = 105% loss!
The same is also true when the underlying increases multiple days in a row:
Underlying: 100 -> 110 -> 121 -> 133 -> 146 - 46% gain
3x Leverage: 100 -> 130 -> 169 -> 220 -> 286 - 186% gain
A 186% gain is a lot better than the expected 46*3 = 138% gain.
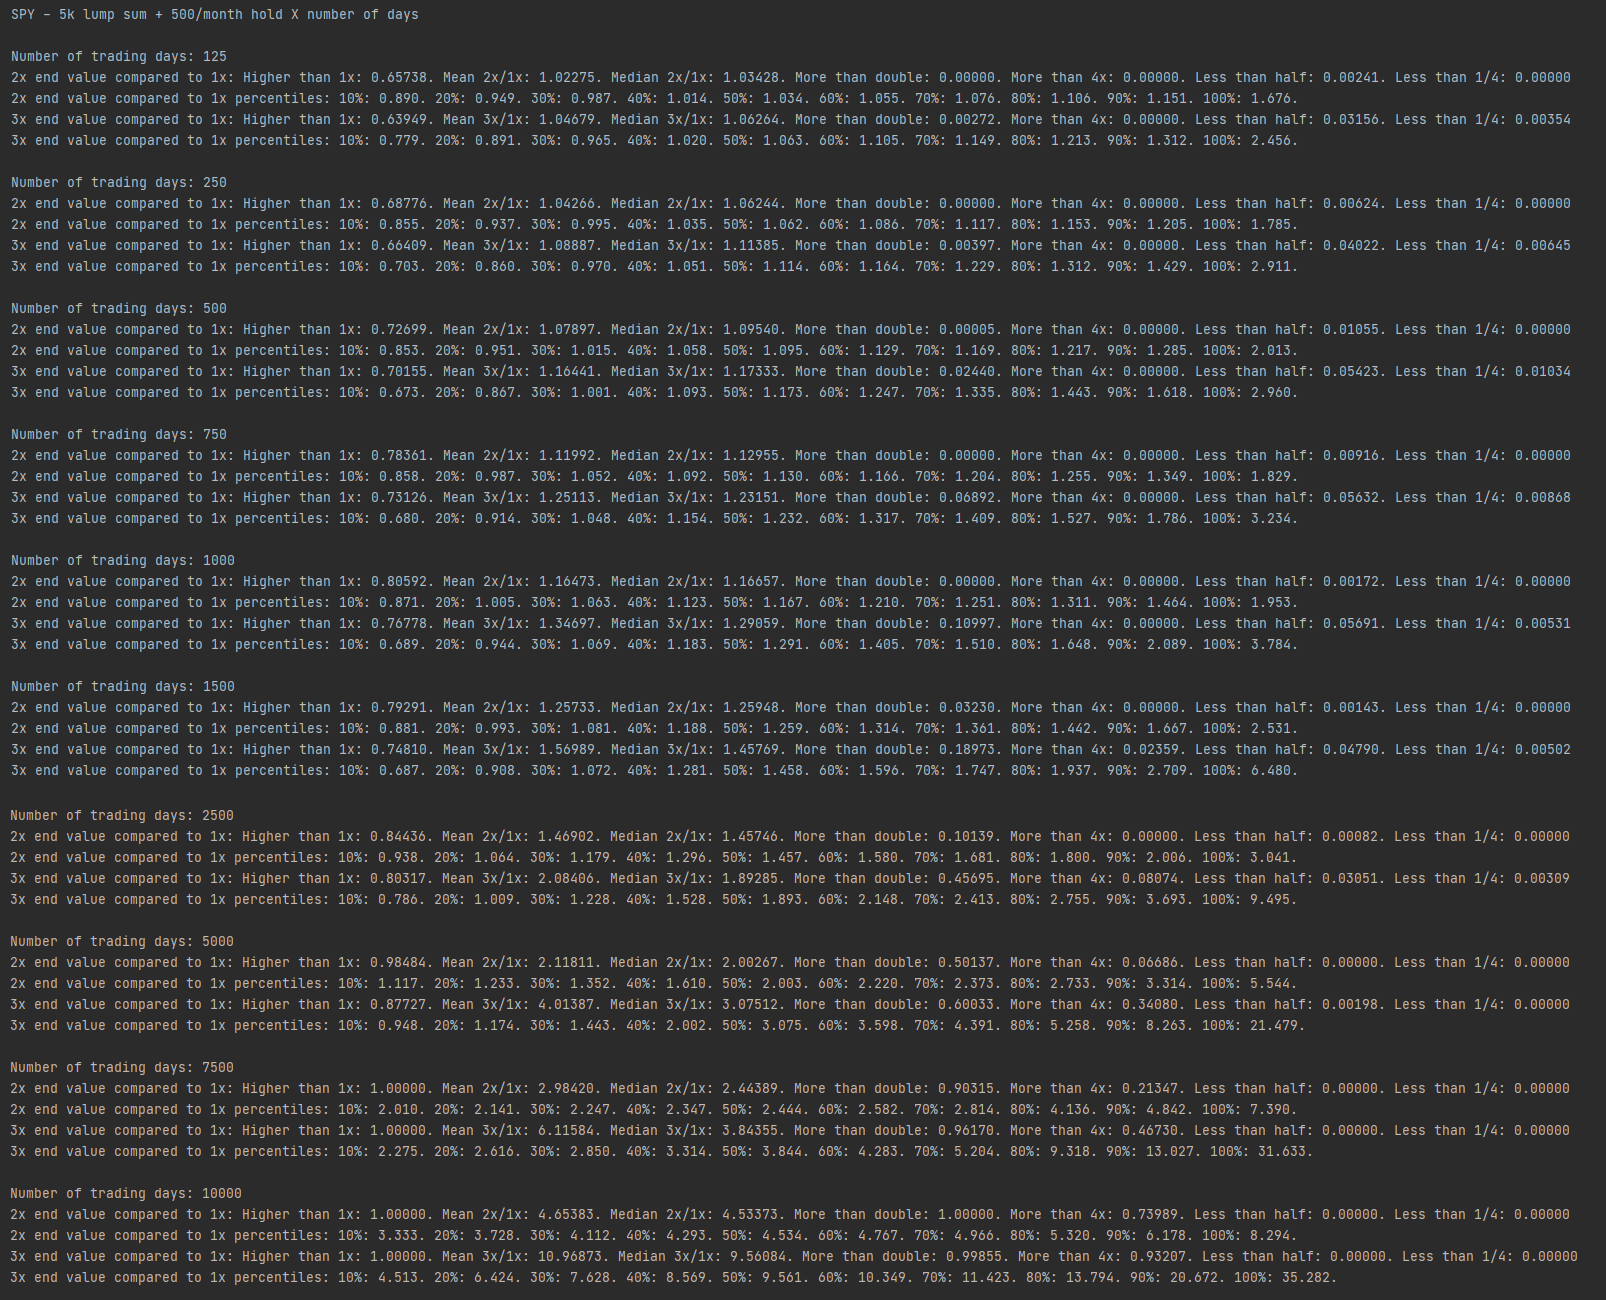
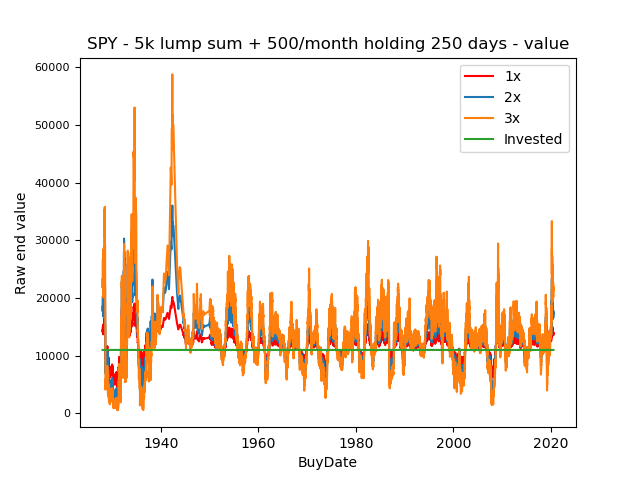
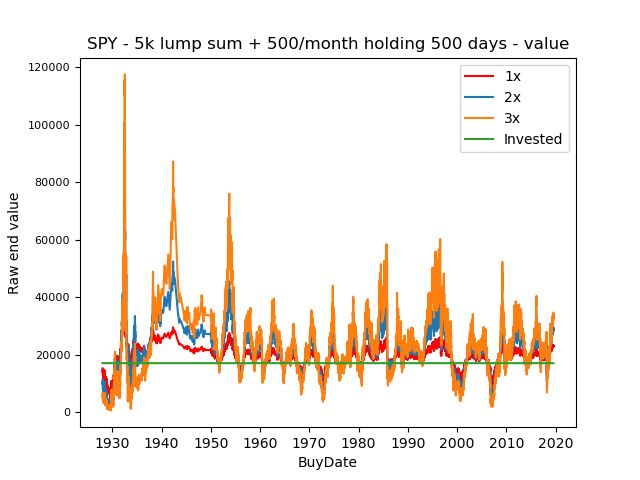
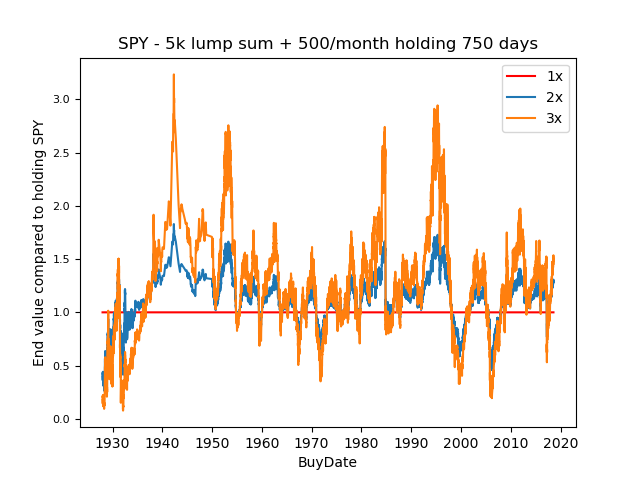
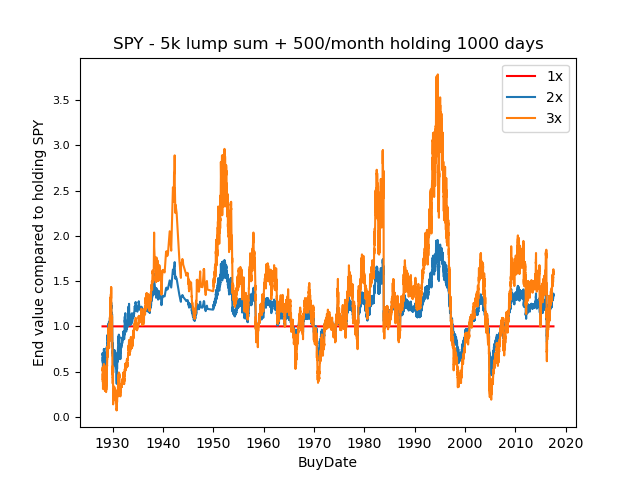
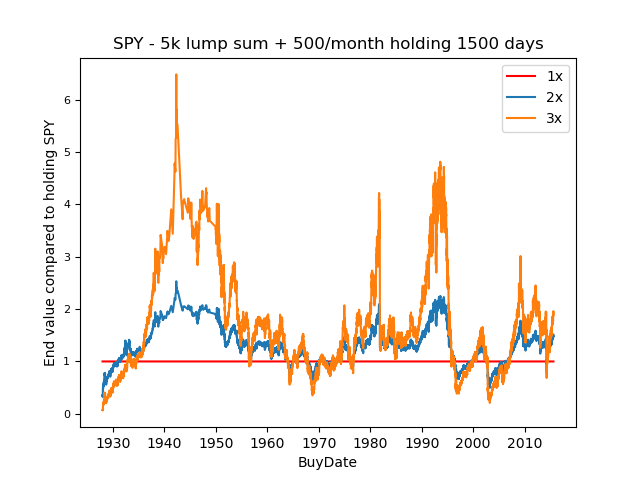
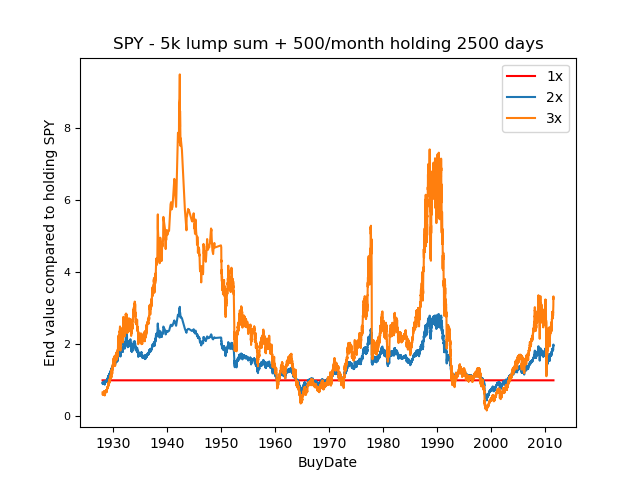
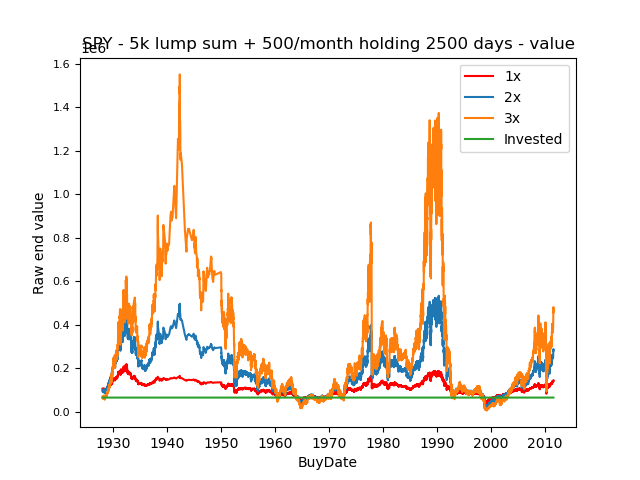
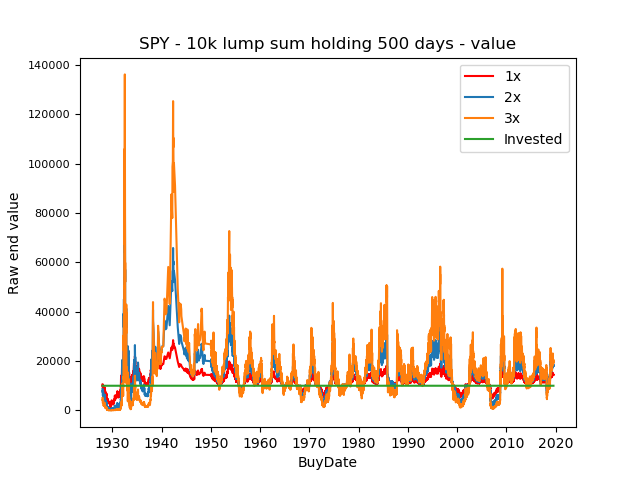
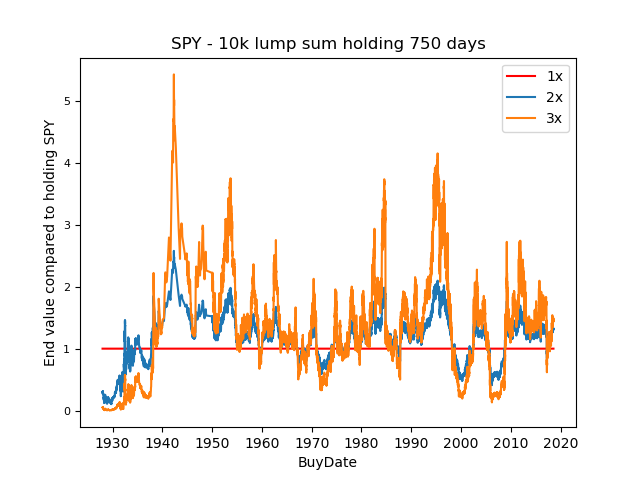
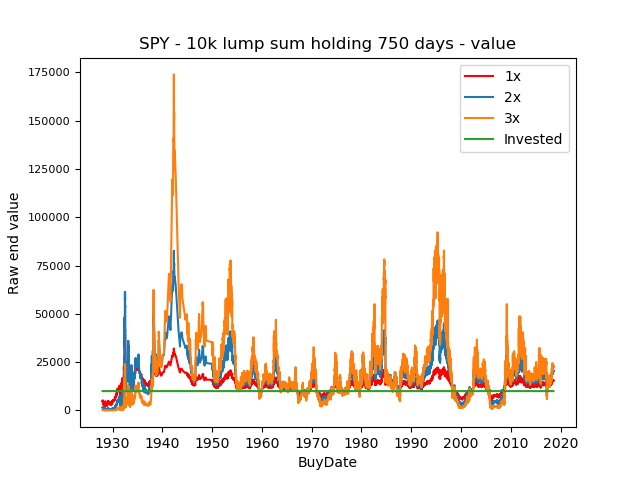
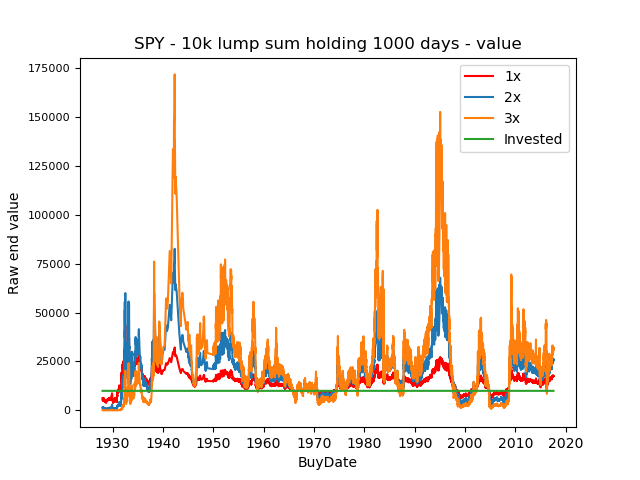
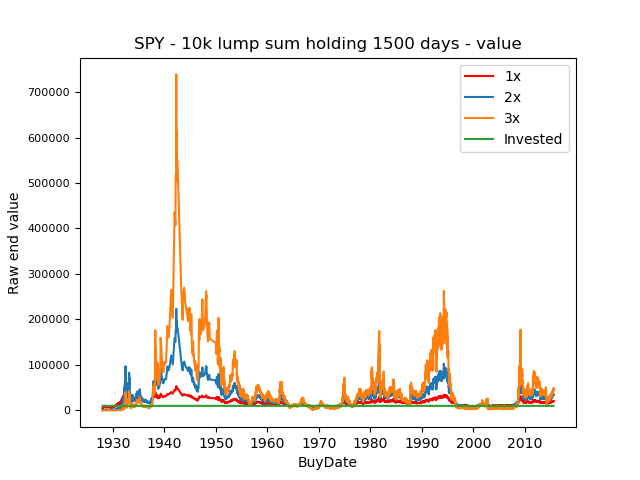
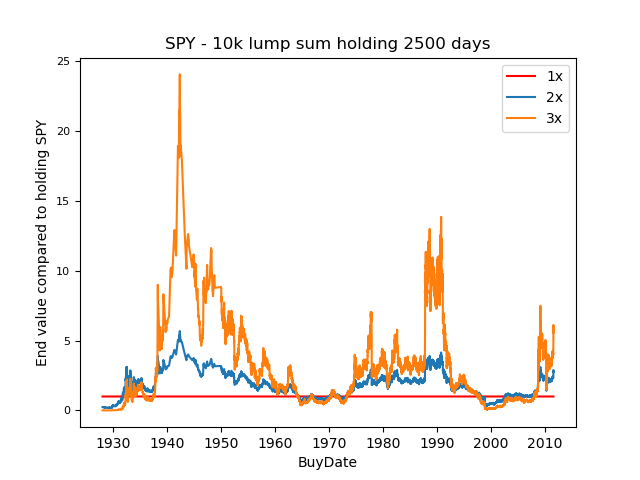
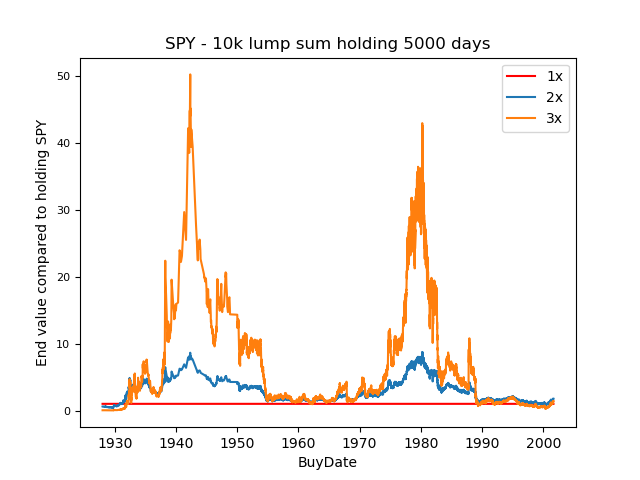
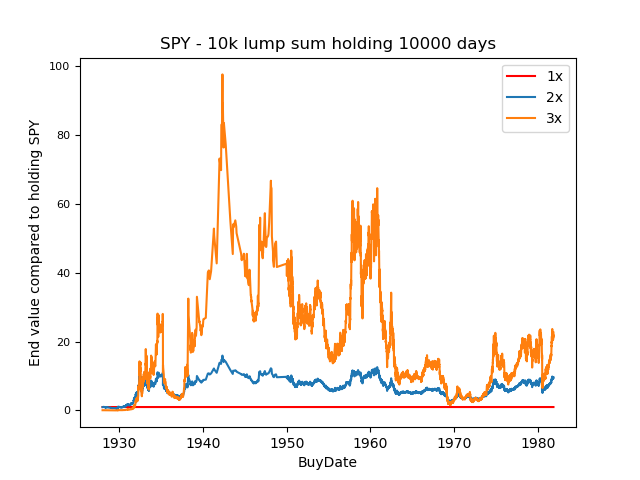
250 trading days = 1 year
| End value compared to SPY | Raw end values |
|---|---|
 |
 |
 |
 |
 |
 |
 |
 |
 |
 |
 |
 |
 |
 |
 |
 |
 |
 |
 |
 |
| End value compared to SPY | Raw end values |
|---|---|
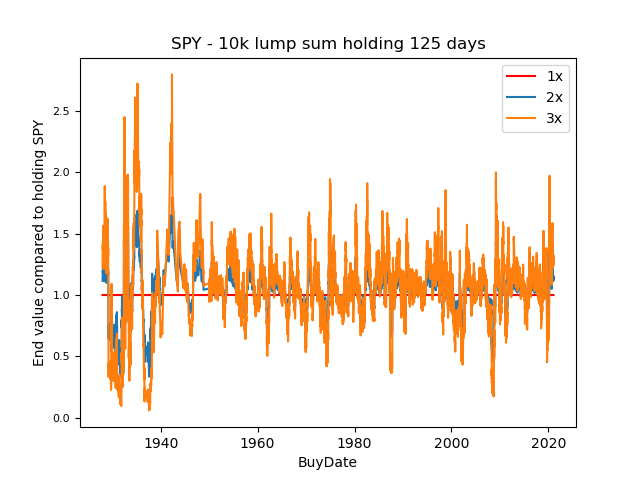 |
 |
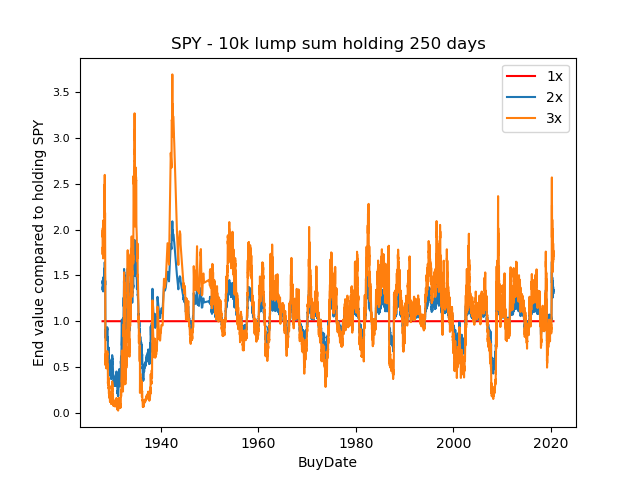 |
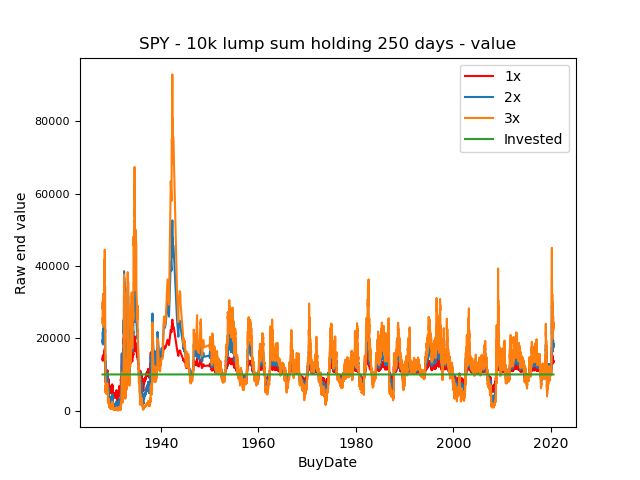 |
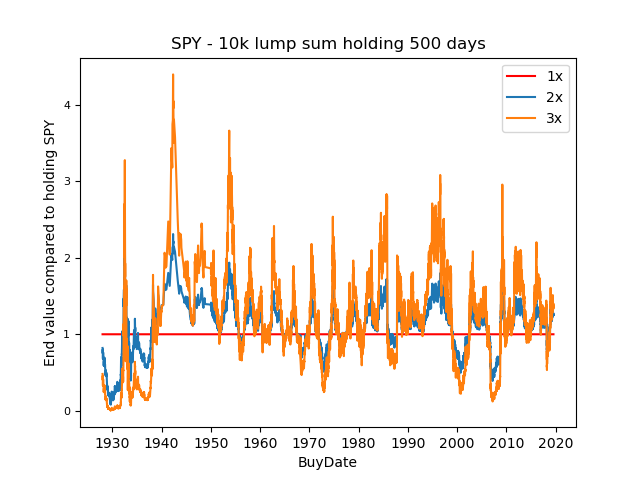 |
 |
 |
 |
 |
 |
 |
 |
 |
 |
 |
 |
 |
 |
 |
 |
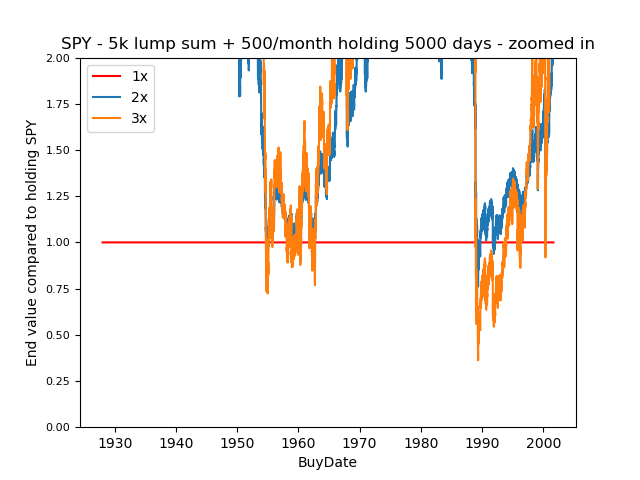
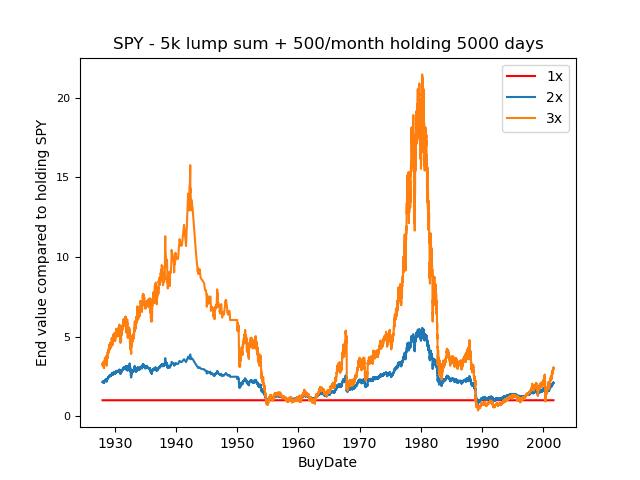
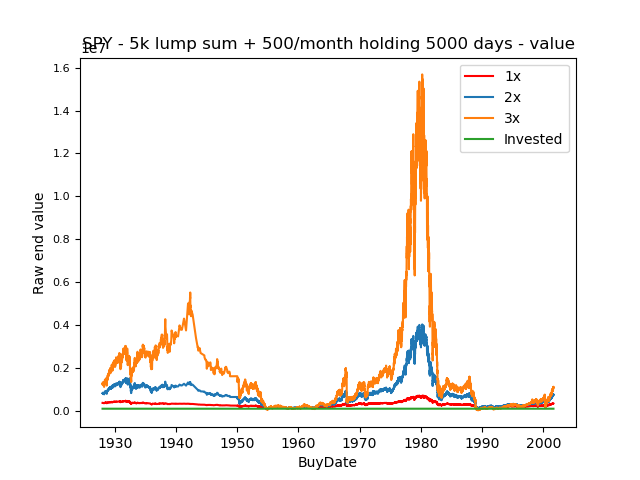
5000 days (20 years) DCA:
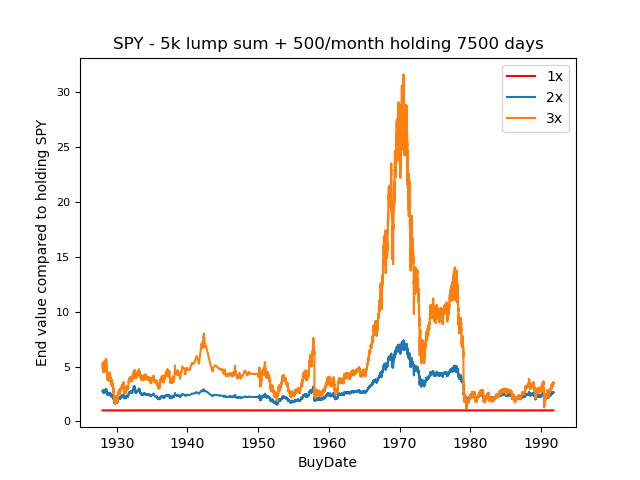
7500 days (30 years) DCA:
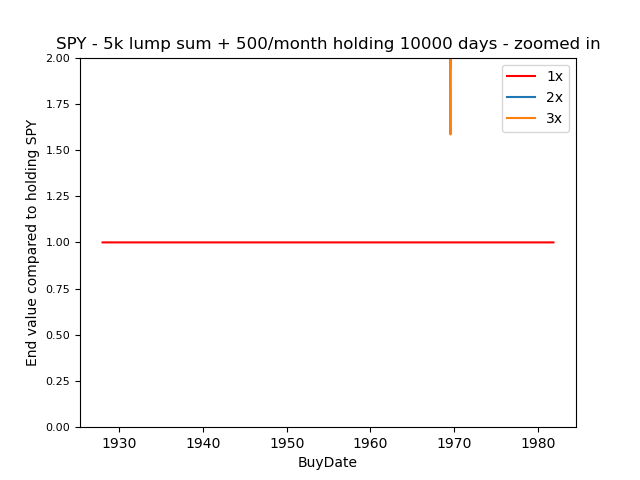
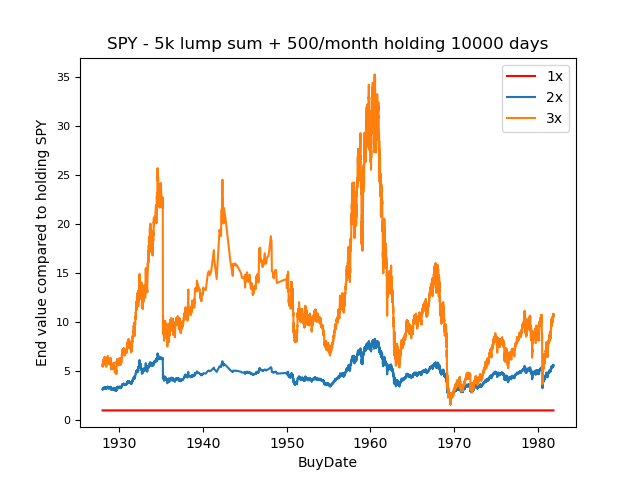
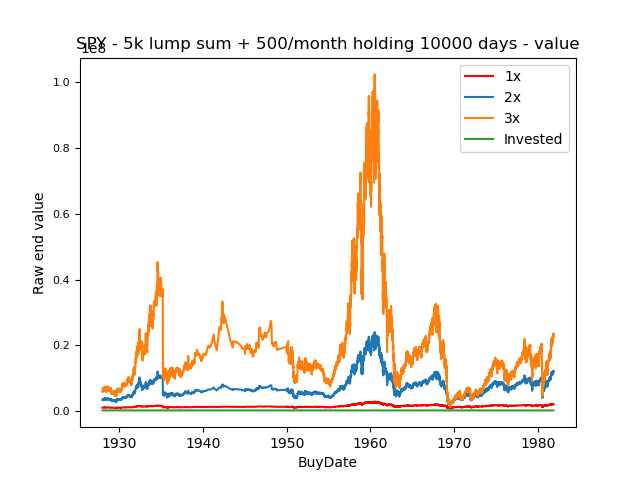
10000 days (40 years) DCA:
There is not a single 30 or 40 year timeframe since 1927 where DCAing into either 2x SPY or 3x SPY lost money compared to just buying SPY, even when holding through the depression in the 1930s, 1970s stagflation, the lost decade from 1999 to 2009, or ending the period at the bottom of the Covid-19 crash.
Past performance does not guarantee future results and all that stuff, but it does seem like having at least a portion of your portfolio in leveraged index funds is a great way to increase wealth, with the rewards heavily outweighing the risks. The hard part is having to stomach watching the extreme portfolio drawdowns during market corrections.
