Analyzing colour in motion pictures is a computationally intensive process. It is therefore necessary to reduce the number of data points to something manageable with the computational resources of a desktop computer or laptop.
The workflow involved in analysing colour in the cinema involves two stages:
- Sampling: selecting frames for inclusion in an analysis based on their timecode (every n-th frame or n frames per second) or their representativeness based on the segmentation of a film into coherent sequences.
- Data reduction: the pixels in a frame are reduced to a single value or a small set of values that are usually based on either the average or dominant colour of the pixels, or the representativeness of a set of exemplar colours in a palette based on clustering methods.
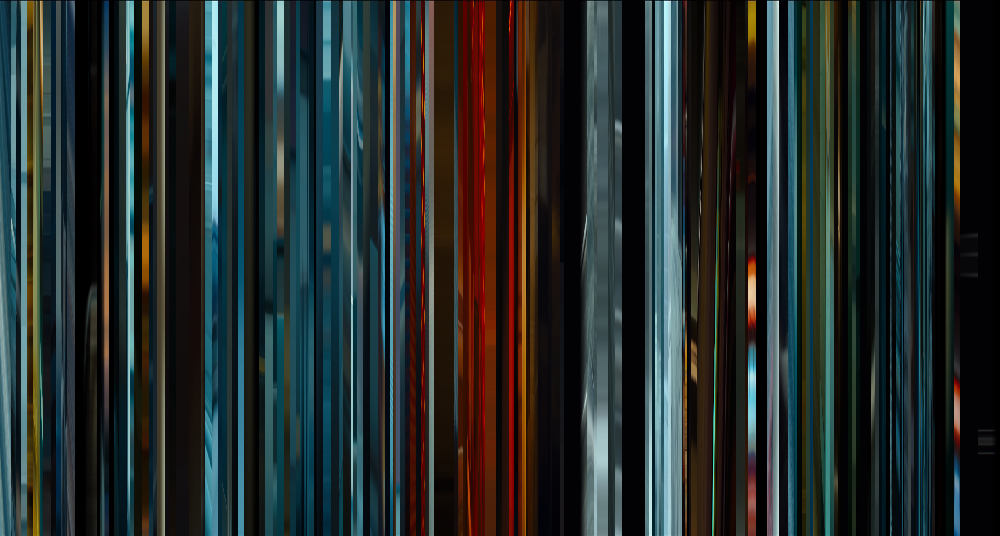
A movie barcode is a common method of sampling frames from a film and reducing the amount of pixel information of a frame to manageable level (usually) by averaging that is then arranged in an aesthetically pleasing way. Because the colours are directly derived from a film and a presented in the order in which they were sampled, a movie barcode contains both colour and temporal information about a film that we can extract and use in our analysis.
MovieBarcodeAnalyzeR is a shiny app for extracting and visualizing colour data from movie barcodes.
The goal of MovieBarcodeAnalyzeR is to open up computational approaches to analyzing colour in the cinema to users with no experience of using the statistical programming language R. With this app you can upload your movie barcode, extract and download data, and produce a range of visualizations and summaries in just a few minutes with no coding required.
You can now use MovieBarcodeAnalyzeR in two ways: either download an executable file to install the app on a Windows machine or run the app remotely from Github.
MovieBarcodeAnalyzeR is now available as an executable file for Windows. Download the exe file and install in your desired directory (NB: requires administrator privileges to install). Please this will also install R 4.2.1 if required along with the packages required for the app to run.
Open the releases page and click the setup_MovieBarcodeAnalyzeR.exe to download the file.
There are four things you will need in order to run MovieBarcodeAnalyzeR from GitHub: R, Rstudio, a collection of R packages, and the code to initialise the app. All of the software and code required to run the app is freely available.
To download R, go to the Comprehensive R Archive Network (CRAN), and download and install the latest version of R appropriate to your system.
RStudio is an integrated development environment (IDE) for R. Select the latest release of RStudio for your system at https://www.rstudio.com/products/rstudio/download/.
Once installed, open RStudio to complete the next steps.
A package is a collection of functions that extends the base install of R. To run MovieBarcodeAnalyzeR you will need to install the following packages using the code below:
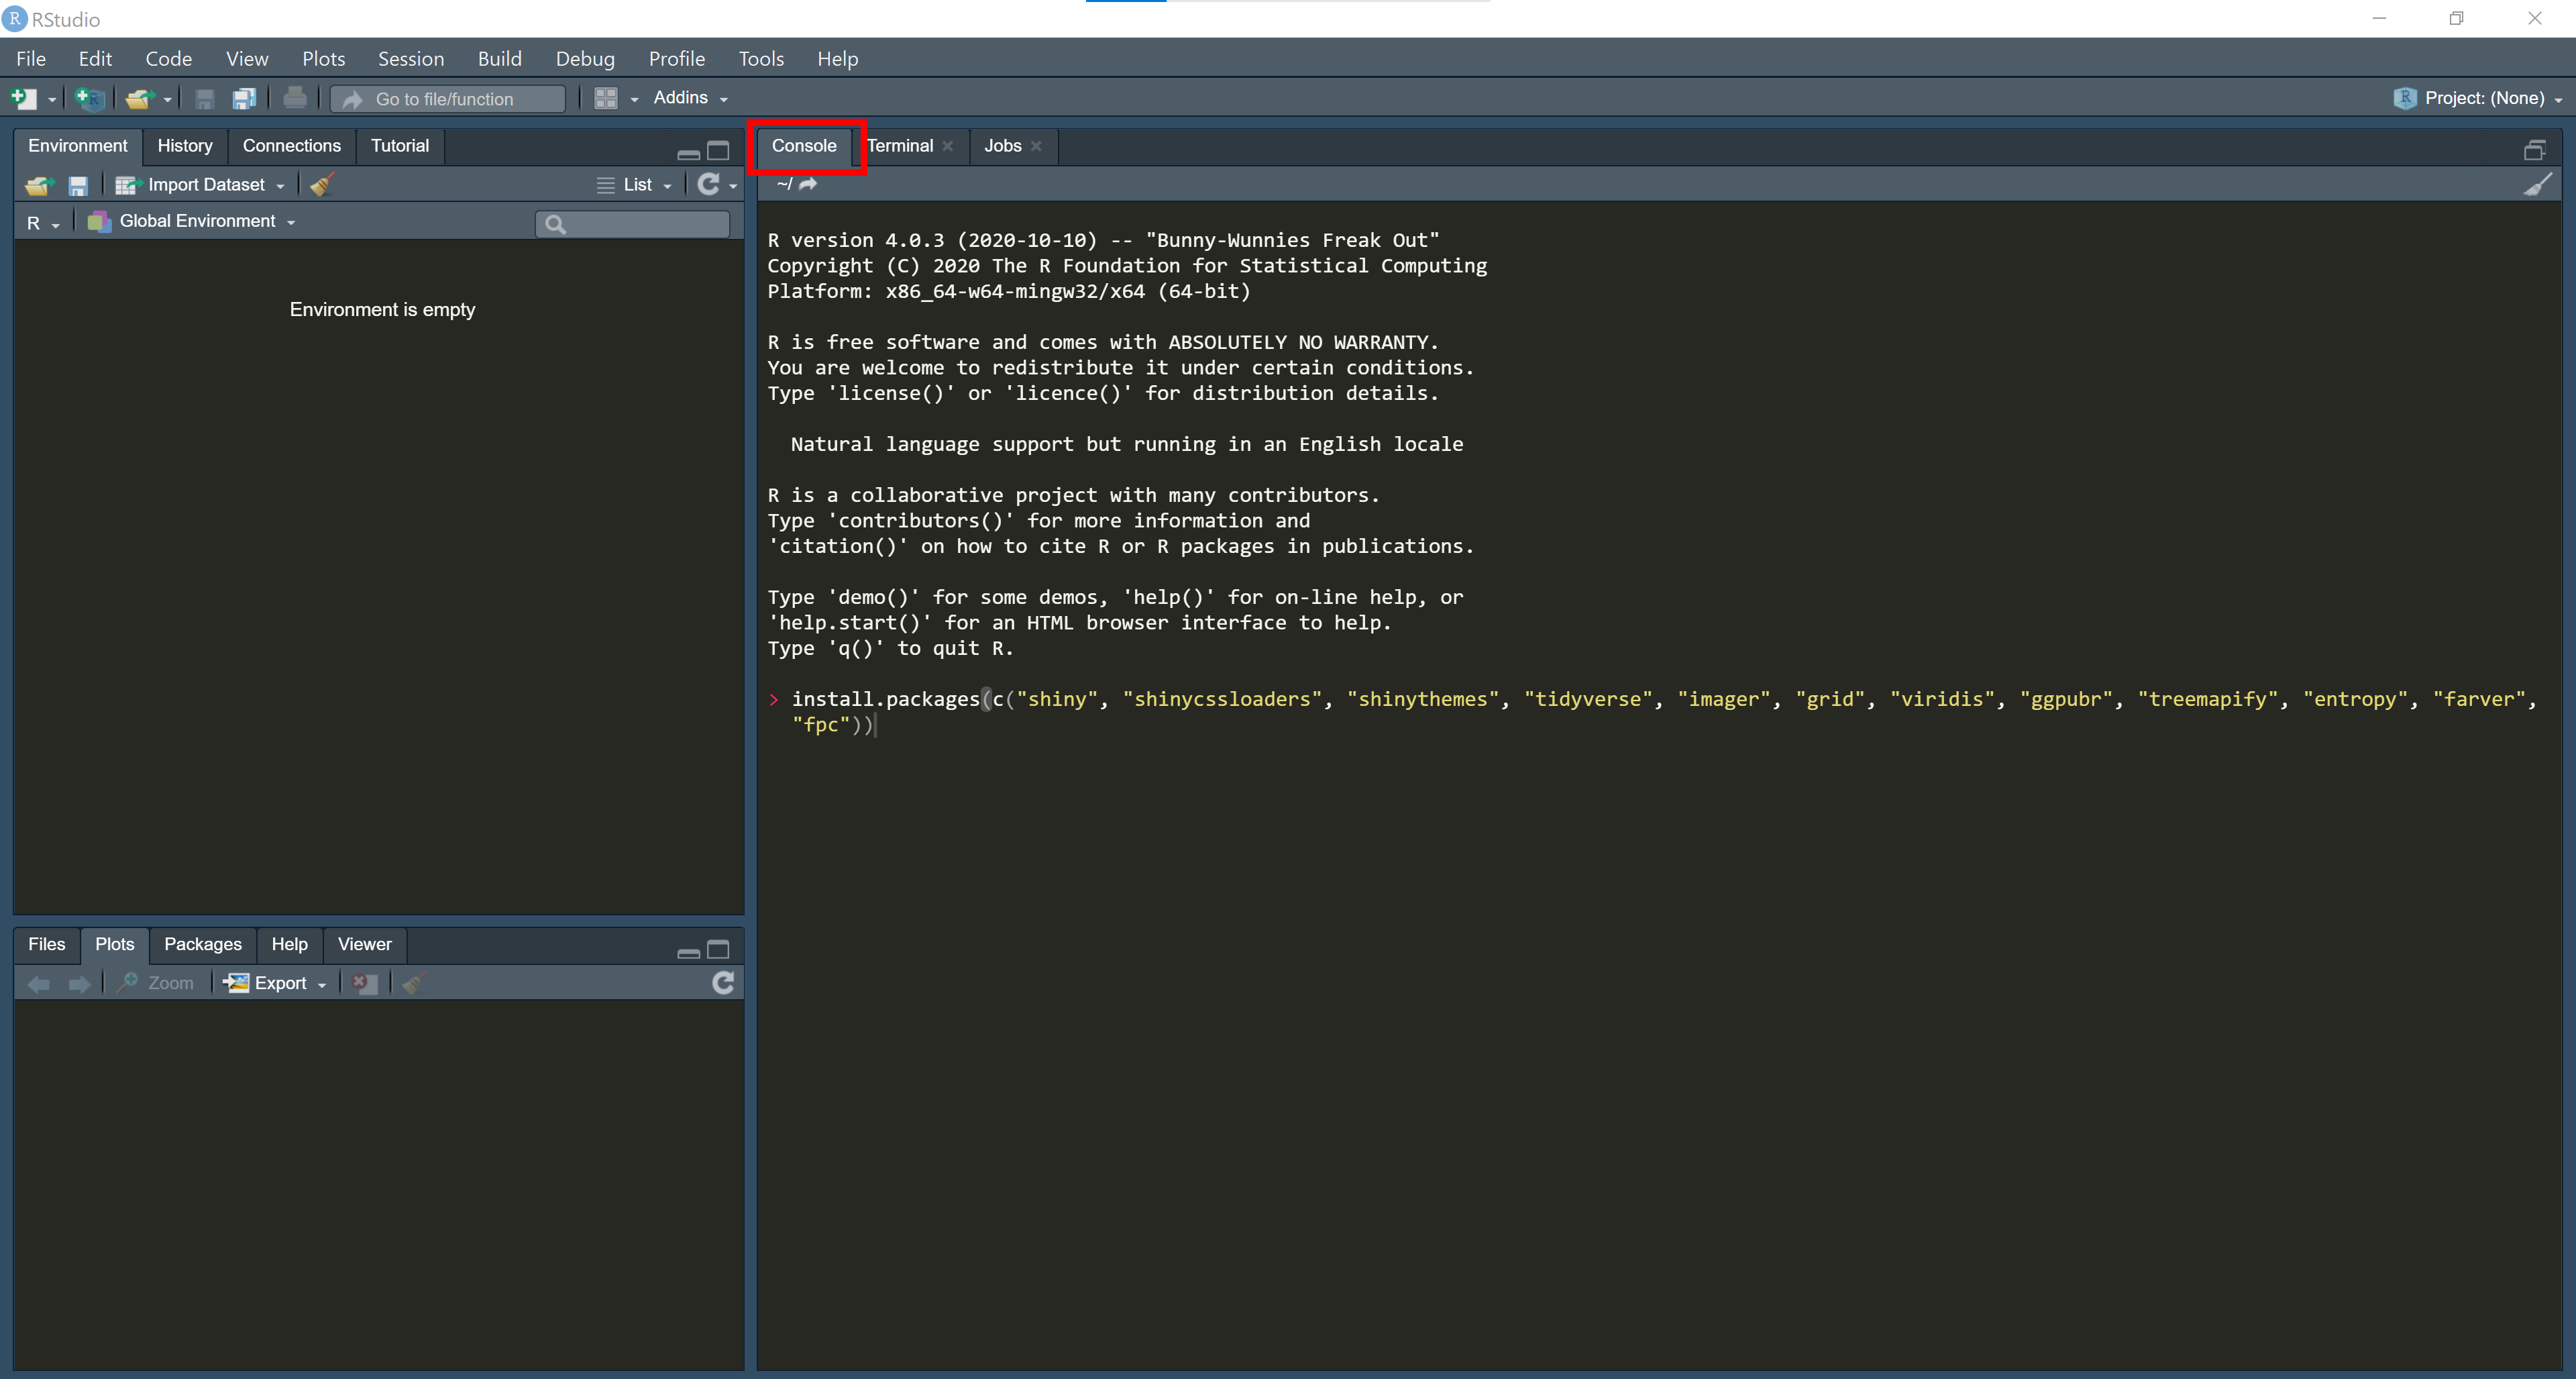
install.packages(c("shiny", "shinycssloaders", "shinythemes", "tidyverse", "imager", "grid", "viridis", "ggpubr", "treemapify", "entropy", "farver", "fpc"))You can copy and paste the above code into the console (highlighted below) in RStudio and press Enter.
You only need to complete steps 1 through 3 the first time you run MovieBarcodeAnalyzeR.
Anytime you want to run MovieBarcodeAnalyzeR use the following code to initialise the app (note that in R, object names are case sensitive and must be entered correctly in order to run):
shiny::runGitHub('MovieBarcodeAnalyzeR', 'DrNickRedfern', ref = "main")Again, you can simply copy-and-paste this code to the console in RStudio and hit Enter to start the app.
Once MovieBarcodeAnalyzeR is running, no coding is required to use the app.
On the Analyze page you can upload your movie barcode and select from a range of visualizations that you can then download for use in an assignment or research article. You can also download the data from your barcode for further analysis.
Movie barcodes uploaded to MovieBarcodeAnalyzeR can be unsmoothed, in which the pixel data for the rows of sampled frame is reduced by averaging to a column the width of a single pixel; or they can be smoothed by averaging the values of each column of the unsmoothed barcode.
Colour data extracted from a movie barcode can be analyzed in either the LCH(ab) or L*a*b* colour spaces. In the LCH(ab) colour space you can select from the following visualisations:
- Hue, Chroma, and Lightness histograms: the distribution of values for the different colour attributes
- Hue vs Chroma - polar: a polar plot with hue represented as the angle on the colour wheel and chroma as the distance from the centre of the wheel
- Hue vs Chroma - cartesian: a scatterplot with hue on the x-axis and chroma on the y-axis
- Chroma vs Lightness: a scatterplot plot with chroma of the x-axis and lightness on the y-axis
- Chroma trend: the trend in chroma over successive frames in a barcode
- Lightness trend: the trend in lightness over successive frames in a barcode
In the L*a*b* colour space you can select from the following visualisations:
- a*, b*, and Lightness histograms: the distribution of values for the different colour attributes
- a vs b - scatterplot: a cartesian plot of with a* on the x-axis and b* on the y-axis
- a vs b - density plot: a 2-d density plot showing the concentration of data points in the plane defined by a* and b. This plot is useful as many pixels in a barcode will have the same values for a* and b* (e.g., all achromatic pixels) and so will not be visible in the scatterplot.
k-means clustering is used to construct a palette of up to twenty colours for a barcode by sorting n objects (i.e., pixels) into k clusters (i.e., colours) so that each object belongs to a cluster, the mean of which functions as a protype representing all the objects in that cluster. A range of descriptive statistics quantifying the richness, diversity, and evenness of a palette are provided.
If you would like to try out MovieBarcodeAnalyzeR I have included the smoothed and unsmoothed barcodes of the trailer for Escape Room in the images folder of this repository that you can download.


