NOTE : make sure you have postgres installed in your system and enter your database details in env file.
- run
git clone https://github.com/Datlizer/Backend.git - open the cloned folder in terminal
virtualenv venvsource venv/bin/activatepip install -r requirementspython manage.py migratepython manage.py runserver localhost:8001
- run
git clone https://github.com/Datlizer/Frontend.git - open the cloned folder in terminal
yarn installyarn start- Open http:https://localhost:3000 in your browser
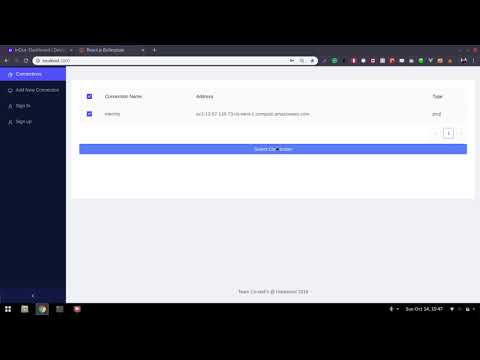
- Connect to different types of databases
- Visualise any columns of different tables
- Predict future values using machine learning algorithms
- Download visualised chart as SVG


- Postgresql
- MySQL
- MongoDB ( Coming soon )
- Add query based fetching of data
- Download data as CSV
- Add more type of charts available
- Show only meaningful charts instead of all
- Plot against more number of columns
- Add support to more database services
Everyone is open to make any type of contributions to this project. If you find any bugs or need any features to be added you are free to create an issue and if you are able to solve the issue we'll be happy else we will be solving it.