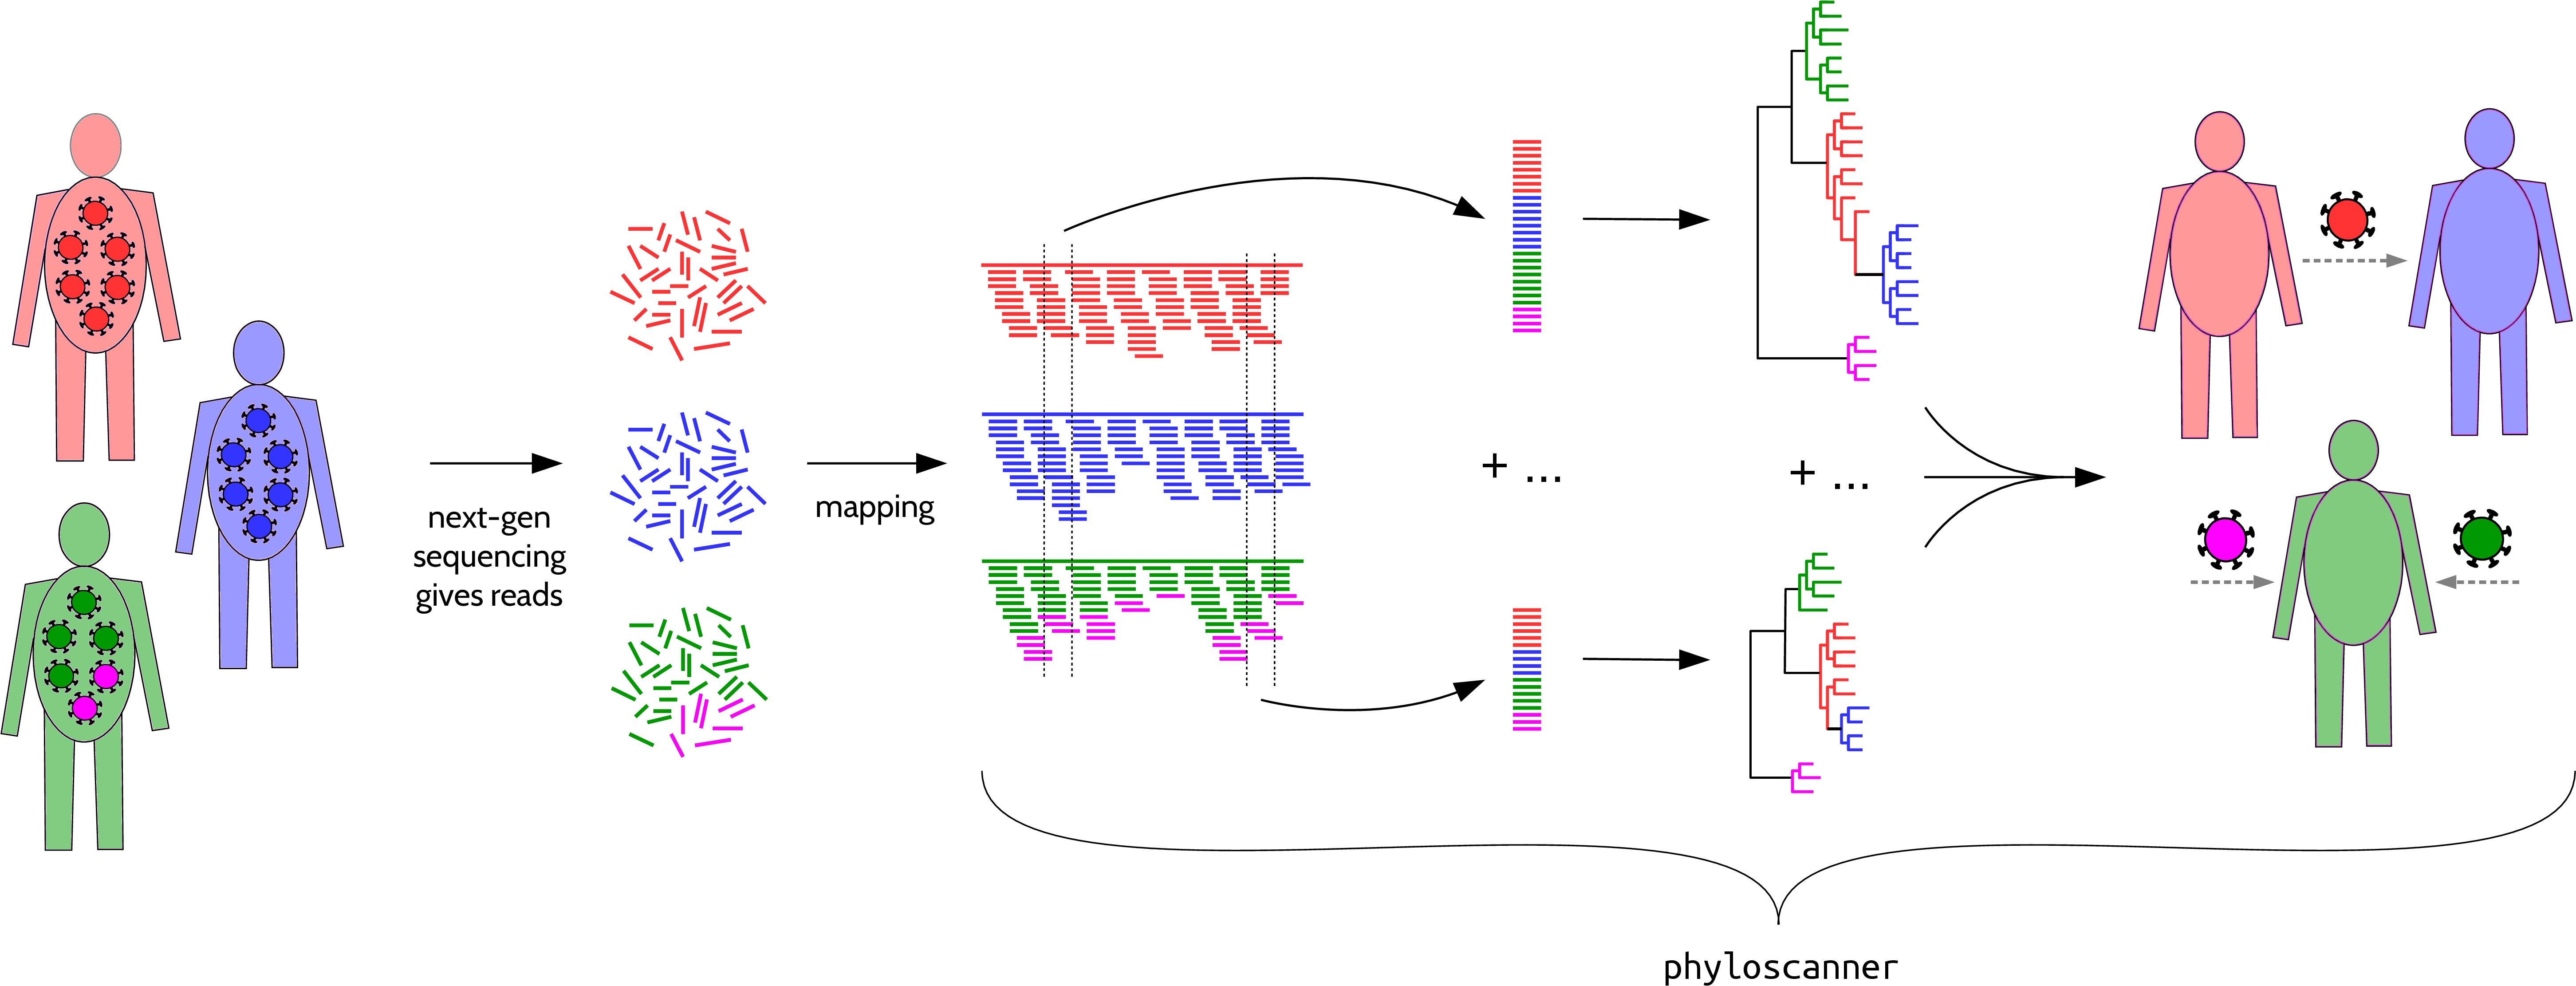
Analysing pathogen genetic diversity and relationships between and within hosts at once, in windows along the genome.
phyloscanner's input is bam files: reads (fragments of nucleotide sequence) that have been mapped (aligned) to the correct part of some reference genome. We wrote phyloscanner to analyse bam files that each represent a pathogen population in one host, exhibiting within-host and between-host diversity; in general use each bam file should be a sample representing some subpopulation, and we analyse within- and between-sample diversity.
phyloscanner is freely available under the GNU General Public License version 3, described here.
phyloscanner runs natively on Linux and Mac OS, but not Windows.
However on any operating system (including Windows), if you have VirtualBox installed, you can run this image of Ubuntu Linux 22.04 which contains phyloscanner and our separate tool shiver (which allows you to process raw sequence data into mapped reads suitable as input for phyloscanner), with all of their dependencies.
Instructions for the image (and full steps for how everything was installed) are here.
To make phylogenies from mapped reads, phyloscanner requires samtools, pysam (0.8.1 or later), biopython, mafft, and one of RAxML Next Generation or RAxML-standard or IQtree; notes on installing these are here.
To set up the part of phyloscanner that analyses these phylogenies (or others), follow these instructions.
This tells you how to update your phyloscanner code, if it has changed since you installed it.
Info and help:
- The phyloscanner publication, discussing the method and its scientific context, is here.
- The code's manual is here.
- Instructions and example data for a practical on using phyloscanner are here.
- Problem with the code? Create a New Issue.
- Query? Ask it publicly at the google group.
If you use phyloscanner for published work, please cite it and the tools it uses, details here.
The simulated bam files in ExampleInputData illustrate interesting within- and between-host diversity.
Let's analyse them with phyloscanner.
For this example I'll assume you've downloaded the phyloscanner code to your home directory, i.e. that it is found in ~/phyloscanner/ (if you have put it in a different path, replace every occurrence of ~/phyloscanner/ below by that path).
First we need to make a file listing the files we want analysed; that file should be comma-separated variable format, containing lines like this: BamFile1,ReferenceFile1,ID1 where the third field is optional (if present it is used as an ID for that bam file).
You can make that csv file manually if you like, but here is an example of making it automatically from the command line for these bam files:
for i in ~/phyloscanner/ExampleInputData/*.bam; do
  RefFile=${i%.bam}_ref.fasta
  ID=$(basename "${i%.bam}")
  echo $i,$RefFile,$ID
done > InputFileList.csv
To make some within- & between-host phylogenies, run the following command:
~/phyloscanner/phyloscanner_make_trees.py InputFileList.csv --auto-window-params 300,-700,1000,8300 --alignment-of-other-refs ~/phyloscanner/InfoAndInputs/2refs_HXB2_C.BW.fasta --pairwise-align-to B.FR.83.HXB2_LAI_IIIB_BRU.K03455 (Those window parameters make best use of this simulated data, the -A option includes an alignment of extra reference sequences along with the reads, see the manual for the --pairwise-align-to option.)
Now let's analyse those phylogenies:
~/phyloscanner/phyloscanner_analyse_trees.R RAxMLfiles/InWindow MyOutput s,12.5 --outgroupName C.BW.00.00BW07621.AF443088 --multifurcationThreshold gIn the output you'll see trees and summary information indicating that these samples constitute:
- a straightforward, singly infected individual,
- a dually infected individual i.e. infected by two distinct strains of virus,
- a contamination pair (one contaminating the other), and
- a pair exhibiting ancestry, i.e. one having evolved from the other. For populations of pathogens, this implies transmission, either indirectly (via unsampled intermediate patients) or directly.
The pdf trees in the output will all look quite similar to this one below. Each patient has many sequences (reads), with one colour per patient. Extra reference sequences are coloured black. Can you see why each of the patients merits their label?
(These bam files were generated by taking HIV sequences from the LANL HIV database, using them as starting points for evolution simulated with SeqGen and calibrated to our own real data on within-host diversity. Reads were then generated in eight windows of the genome, instead of all along the genome, purely to keep file sizes nice and small while remaining an interesting example.)

