Edgar Jullien, Antoine Settelen, Simon Weiss ~ 2 weeks dev
In many stock exchanges, at the end of a trading day, auction takes place for each stock. Each stock is then exchanged at a single price, based on the interest that market participants show in the auction.
It is advantageous to do some trading during this auction instead of during the preceding continuous trading, as trading costs are usually lower.
In addition, some market participants (day traders, market makers…) prefer to not hold stocks overnight, because events might affect the stock price between the close of the market and the price at the open on the next day (elections, company announcements, etc.), which may result in a loss. For these market participants, the auction is the last chance to limit such a risk, as it is an opportunity to get rid of their remaining stocks and not hold any overnight.
For market participants that instead want to hold a specific number of stocks by the end of the day (asset managers…), the auction is their last chance to reach this target. This is in principle important, because they have optimized this number of stocks to hold. For example, if they predict that the price of a stock should rise, then it is in their interest to buy as much of the stock as possible, within the limits set by how much they can invest and by the financial risk that they are ready to take.
Market participants may thus want to estimate the expected number of stocks available during the auction, as this allows them to gauge how many they can hope to buy or sell during this final, financially advantageous trading opportunity.
The goal of this challenge is to predict the volume (total value of stock exchanged) available for auction, for 900 stocks over about 350 days. Data description
Input data
The prediction of the auction volume for a given stock on a given day can be made based on the following 126 input columns:
pid: a Product ID, that represents a stock.
day: day of the data sample, as an integer. The ordering is chronological, with day 0 coming before day 1, etc.
abs_retn (n from 0 to 60): absolute values of stock returns (relative price change) between the last known price (typically the price at the beginning of period n) and the end of period n (as a percentage), where the periods cover a good part of the trading day, don't overlap, and have the same duration. Return n=0 comes before return n=1, etc.
rel_voln: like abs_retn, but represents the traded stock volume as a fraction of the volume traded during the period covered (thus, they sum to 1, over a day). The periods are the same as for the returns.
LS and NLV: two quantities associated with the trades of the day for the stock in question. Their nature is kept undisclosed for this challenge.
Output data
The output data contains, for a given stock and a given day, the natural logarithm of the auction volume (= total value of traded stocks), as a fraction of the total volume in the 61 given periods. Thus, if the auction volume represents 10 % of the volume traded over all the periods of a day, the target is log 0.10 = -2.30…
Training and test data
The 900 stocks found in the training and test data are the same: it is therefore in principle possible to devise predictions that are customized for each stock.
The training data contains information on about 800 different days, while the test data requires auction volume predictions for about 350 days.
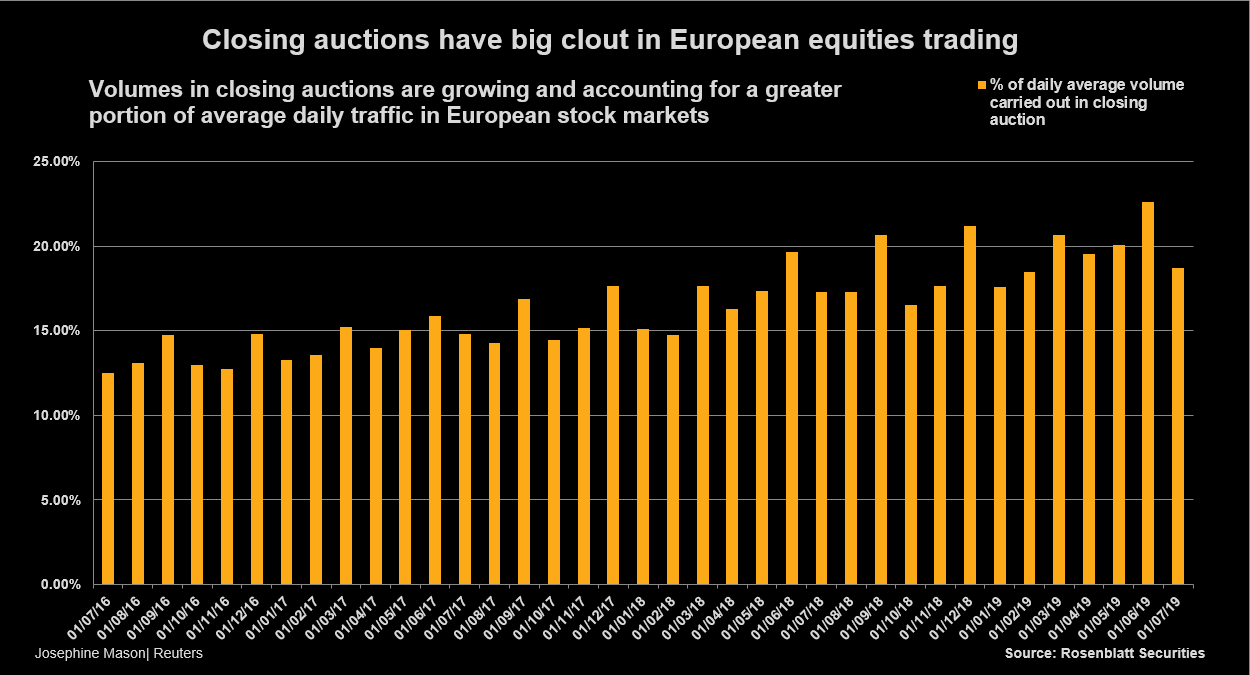
Furthermore, the test inputs correspond to days that come after those of the training data. A challenge is that auction volumes can evolve over time (for instance by becoming relatively larger and larger over time), but we only see what the past (training) auction volumes looks like.
Presentation ideas :
-
the evolution of the volume in the future is not necessarily linear. => Feature: Evolution of the global volume per day
-
For a given day (see idea amf report, election), the market can behave in a particular way that can have csq on the volume.
-
For boosted trees, bad for extrapolations on future data (in a particular domain). => They can be combined with other algoes
Ideas from AMF report (only for France):
-
In a given quarter, the auction share for end-of-quarter months (March, June, September and December) is about 4% to 6% higher than that observed for the other months (bc of derivative product) => Fature Need quarter feature encode / months
-
The days on which quarterly derivatives expire are not only amongst the most active days, they are also the days on which the share of the closing auction reaches its highest level cf graph amf
=> Encode these specific days
- last trading day of the months of February, May, August and November are also among the most active days in terms of volumes traded (to a lesser extent than for quarterly expiries) and those with the largest share of the fixing This comes from The MSCI indices rebalancing days
=> Encode these specific days
- In contrast, on days of high volatility and large volumes (e.g. start of February 2018 and around the first round of the French presidential elections), the share of the closing auction is generally lower than the average on the other days.
Origin :
-
RAPID DEVELOPMENT OF PASSIVE MANAGEMENT in Europe notably the ETF which have to increase their volume at the end of the day (vs US) => If we have the days, we could add the share of passive funds in equity funds
-
Best Exectution obligation : since the closing auction offers a single simple reference price.
-
Avoiding HTF
-
THE AMPLIFYING EFFECT OF EXECUTION ALGORITHMS VWAP type, which adapt their execution volumes to that of the market in general
=> Newcolumn : Abs_var_price* Abs_vol
- Check TOP & TOV formation in doc.
https://fingfx.thomsonreuters.com/gfx/mkt/12/4751/4713/closing%20auctions.png
- Step 0 : load drive in google collab
- Step 1 : Implement benchmark methodology used by challenge provider
- Step 2 : Advanced feature engineering
- Step 3 : Advanced Machine Learning modeling
- Step 4 : Deep learning : LTSM with Pytorch
- Benchmark : 15th in leaderboard (submission 01.02, 5:30pm) - MSE : 0.5723
- Advanced Machine Learning : 10th in leaderboard (submission 12.02, 7:37pm) - MSE : 0.4909
- Deep Learning : 21th in leaderboard (submission 14.02, 2.37pm, MSE : 0.631259918503299
- Google collab pro GPU
- a lot of coffee

