Disclaimer: The sample code; software libraries; command line tools; proofs of concept; templates; or other related technology (including any of the foregoing that are provided by our personnel) is provided to you as AWS Content under the AWS Customer Agreement, or the relevant written agreement between you and AWS (whichever applies). You are responsible for testing, securing, and optimizing the AWS Content, such as sample code, as appropriate for production grade use based on your specific quality control practices and standards. Deploying AWS Content may incur AWS charges for creating or using AWS chargeable resources, such as running Amazon EC2 instances, using Amazon CloudWatch or Amazon Cognito.
DBTop Monitoring is evolution of RDSTop Monitoring Solution initiative.
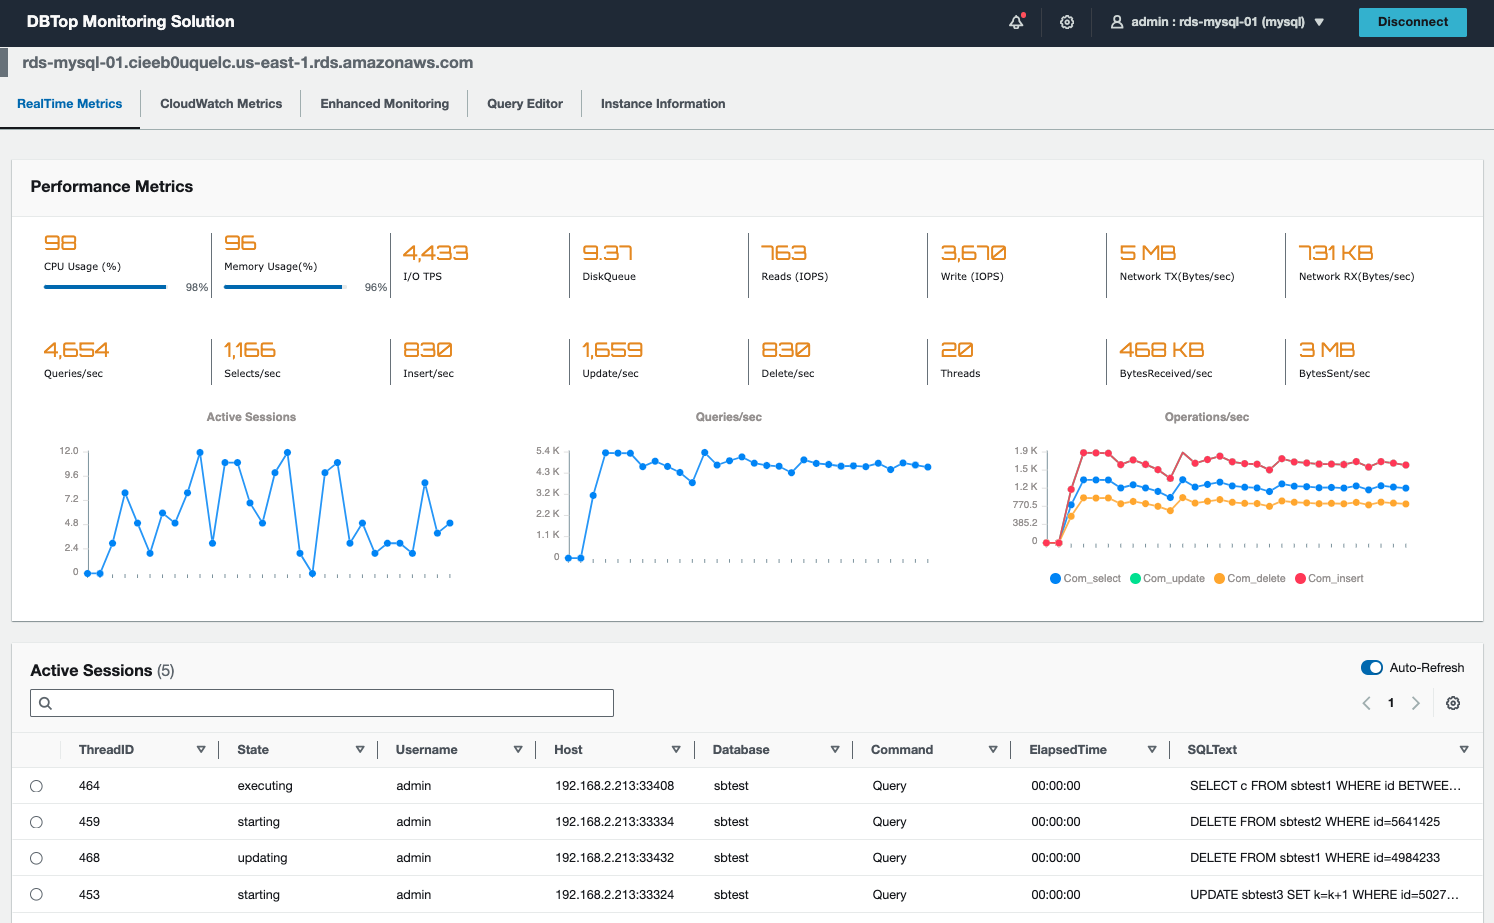
DBTop Monitoring is lightweight application to perform real-time monitoring for AWS Database Resources. Based on same simplicity concept of Unix top utility, provide quick and fast view of database performance, just all in one screen.
DBTop Monitoring Solution currently supports following database engines:
- Amazon Relational Database Service (RDS)
- Amazon Aurora Instance (MySQL-Compatible Edition)
- Amazon In-Memory Databases
- Amazon DocumentDB (with MongoDB compatibility)
Additional expanded support coming later to :
-
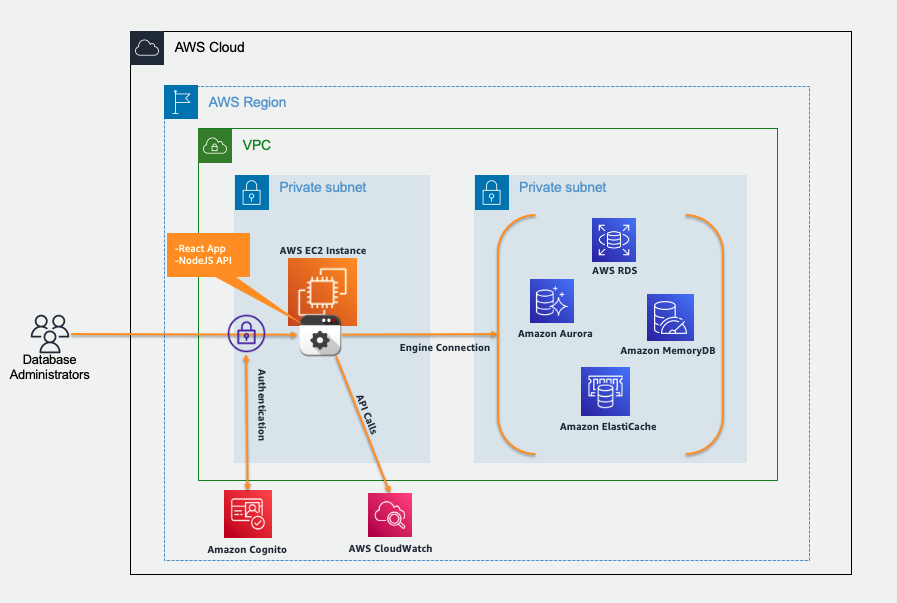
Frontend. React Developed Application to provide user interface to visualize performance database information.
-
Backend. NodeJS API Component to gather performance information from database engines, AWS CloudWatch and Enhanced Monitoring.
-
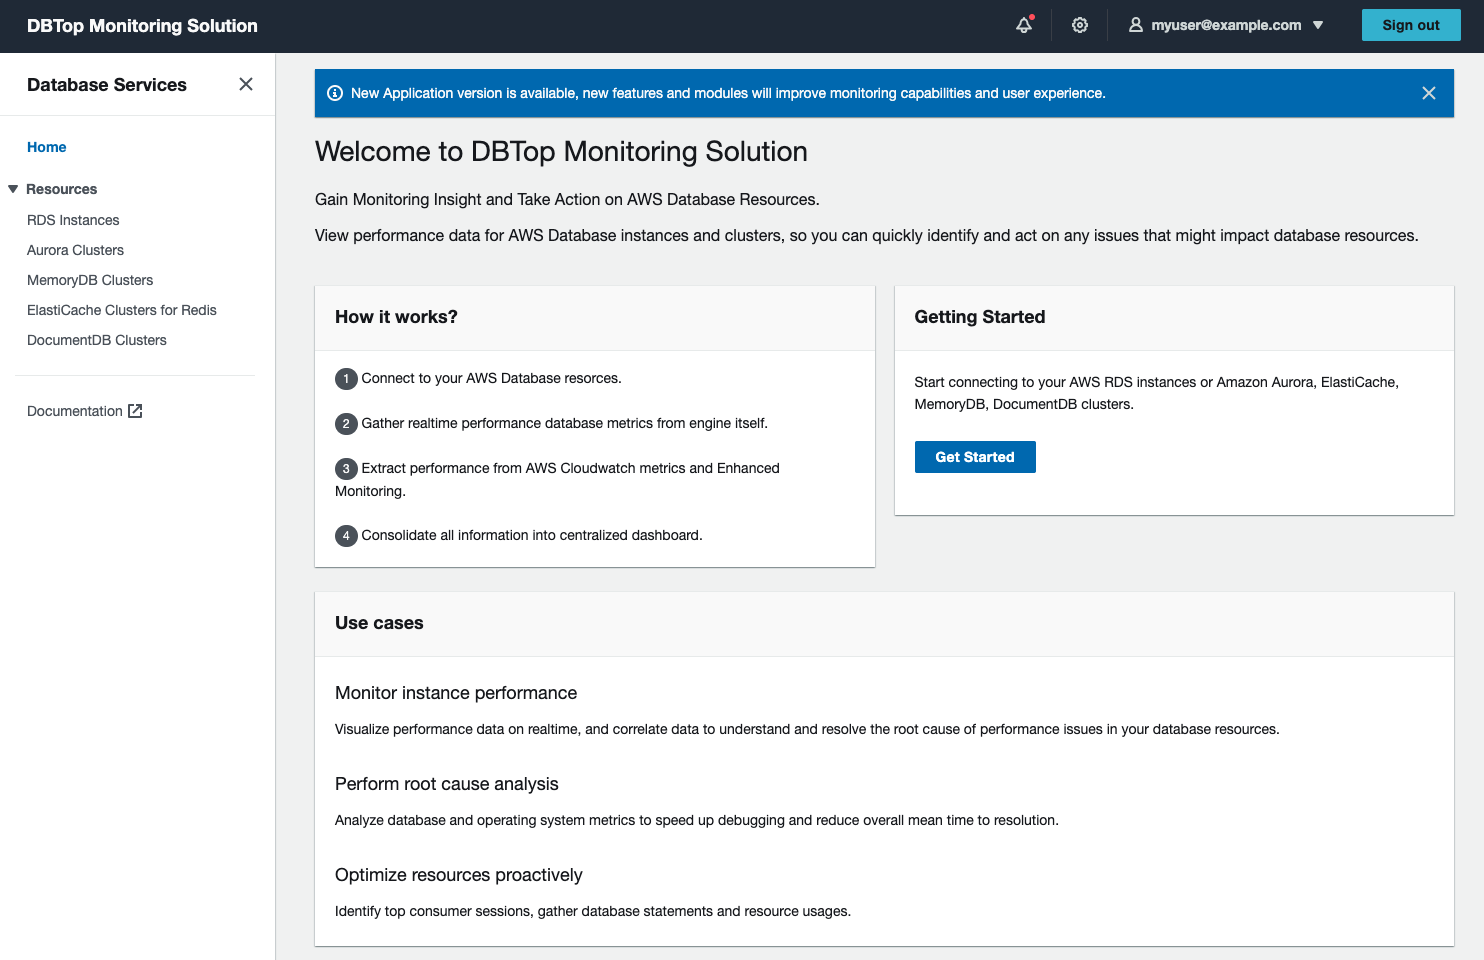
Monitor instance performance. Visualize performance data on realtime, and correlate data to understand and resolve the root cause of performance issues in your database instances.
-
Perform root cause analysis. Analyze database and operating system metrics to speed up debugging and reduce overall mean time to resolution.
-
Optimize resources proactively. Identify top consumer sessions, gather SQL statements and resource usages.
Amazon RDS Enhanced Monitoring
Amazon RDS provides metrics in real time for the operating system (OS) that your DB instance runs on. DBTop Monitoring solution integrate metrics from Enhanced Monitoring and it has to be enabled. Follow procedure below to turn on Enhanced Monitoring.
Setting up and enabling Enhanced Monitoring
DBTop Monitoring Solution needs to access privately AWS Database resources, grant inboud access for security groups used by database resources.
First, you need to take a note of the Cloudformation resources created by the stack
Second, you need to edit the Security Group that allows access to your Database resources, in this case to ElastiCache
DBTop Monitoring Solution will use following resources:
-
AWS EC2 instance. The cost of this resource will depend of size selected during the deployment process. AWS EC2 instance pricing can be review here.
-
AWS CloudWatch API Calls. The cost of this resource will depend how much time the application is being used and modules as well. DBTop Monitoring Solution uses data extracted from DBEngine itself and only extract information on demand from AWS CloudWatch (GetMetricData API) in case the module is selected. AWS CloudWatch API Calls pricing can be review here.
Time to deploy: Approximately 10 minutes.
Database credentials are needed to connect to the database engine and gather real-time metrics, use following statements to create the monitoring users.
CREATE USER 'monitor'@'%' IDENTIFIED BY '<PASSWORD>';
GRANT PROCESS ON *.* TO 'monitor'@'%' ;CREATE USER monitor WITH PASSWORD '<PASSWORD>';
GRANT pg_read_all_stats TO monitor;USE [master]
GO
CREATE LOGIN [monitor] WITH PASSWORD=N'<PASSWORD>', DEFAULT_DATABASE=[master], CHECK_EXPIRATION=ON, CHECK_POLICY=ON
GO
use [master]
GO
GRANT CONNECT SQL TO [monitor]
GO
GRANT VIEW SERVER STATE TO [monitor]
GOCREATE USER monitor IDENTIFIED BY '<PASSWORD>';
GRANT CREATE SESSION,SELECT ANY DICTIONARY TO monitor;db.createUser(
{
user: "monitor",
pwd: "<PASSWORD>",
roles: [ "clusterMonitor" ]
}
)
Follow the step-by-step instructions to configure and deploy the DBTop Monitoring Solution into your account.
- Make sure you have sign in AWS Console already.
- Download AWS Cloudformation Template (DBMonitoringSolution.template) located into conf folder.
- Open AWS CloudFormation Console
- Create an stack using Cloudformation template (DBMonitoringSolution.template) already downloaded on step 2.
- Input Stack name parameter.
- Acknowledge Application Updates - Disclaimer parameter.
- Input Username parameter, this username will be used to access the application. An email will be sent with temporary password from AWS Cognito Service.
- Input AWS Linux AMI parameter, this parameter specify AWS AMI to build App EC2 Server. Keep default value.
- Select Instance Type parameter, indicate what instance size is needed.
- Select VPC Name parameter, indicate VPC to be used to deploy application server.
- Select Subnet Name parameter, indicate subnet to be used to deploy application server, this subnet needs to have outbound internet access to reach AWS APIs. Also application server needs to be able to reach AWS Database Resources, add appropiate inboud rules on Amazon RDS security groups to allow network connections.
- Select Public IP Address parameter, the deployment will assign private IP Address by default to access the application, you can assign Public IP Address to access the application in case you need it, Select (true) to assign Public IP Address.
- Input CIDR parameter, specify CIDR inbound access rule, this will grant network access for the application.
- Click Next, Click Next, select acknowledge that AWS CloudFormation might create IAM resources with custom names. and Click Submit.
- Once Cloudformation has been deployed, gather application URL from output stack section. Username will be same you introduce on step 7 and temporary password will be sent by AWS Cognito Service.
- Application deployment will take around 5 minutes to be completed.
Note: Because you are connecting to a site with a self-signed, untrusted host certificate, your browser may display a series of security warnings. Override the warnings and proceed to the site. To prevent site visitors from encountering warning screens, you must obtain a trusted, CA-signed certificate that not only encrypts, but also publicly authenticates you as the owner of the site.
See CONTRIBUTING for more information.
This library is licensed under the MIT-0 License. See the LICENSE file.


