tpfi is an easy-to-use visualization tool for astronomers to identify and analyze
stars in the Kepler, K2, and TESS missions. The main focus of this project is on
two functions: plot_identification and plot_season. These functions create
plots to help visualize target stars and their surrounding environments.
Plot identification charts for Kepler, K2 and TESS.
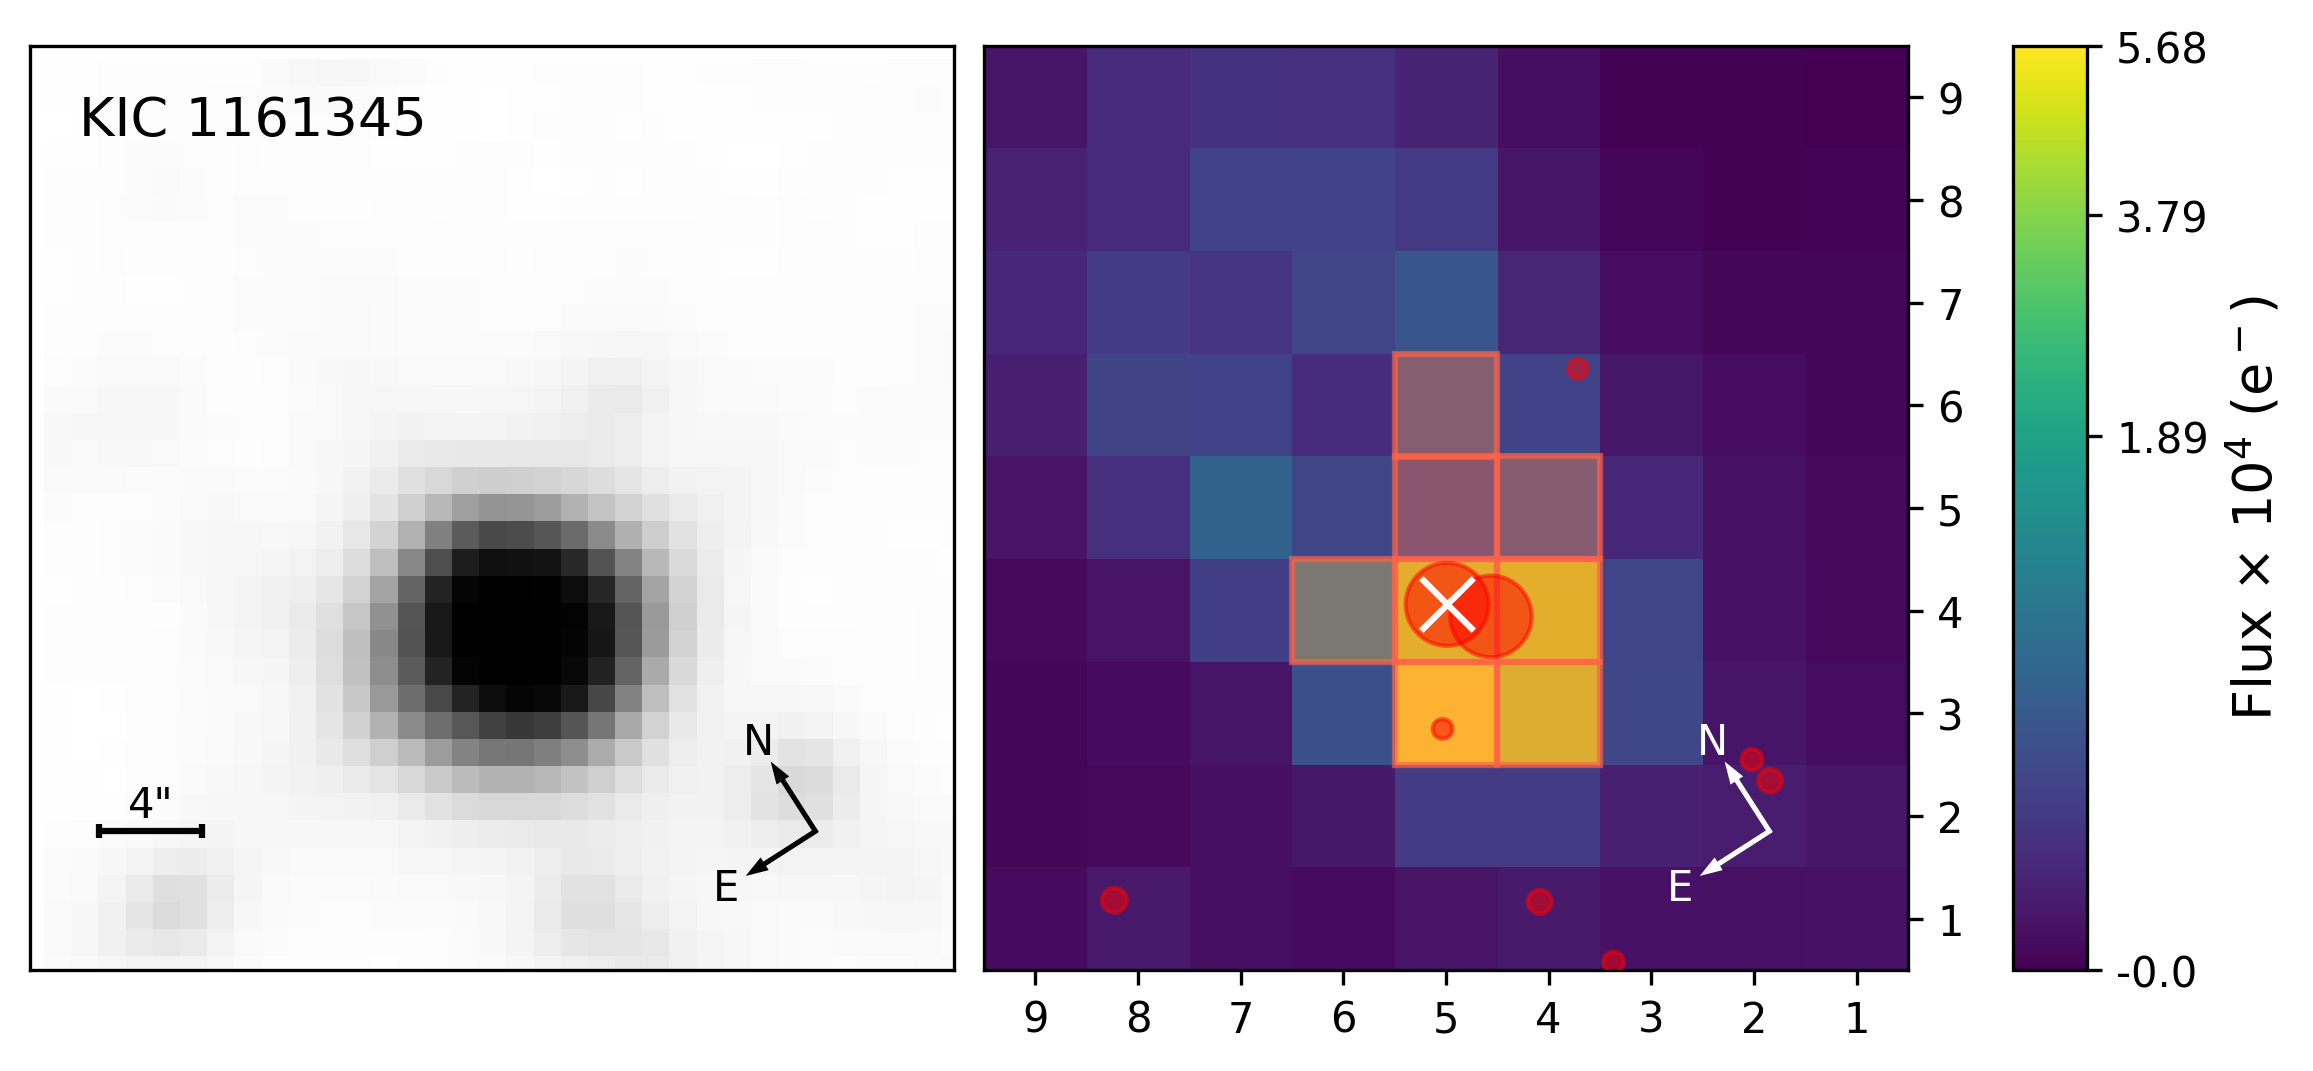
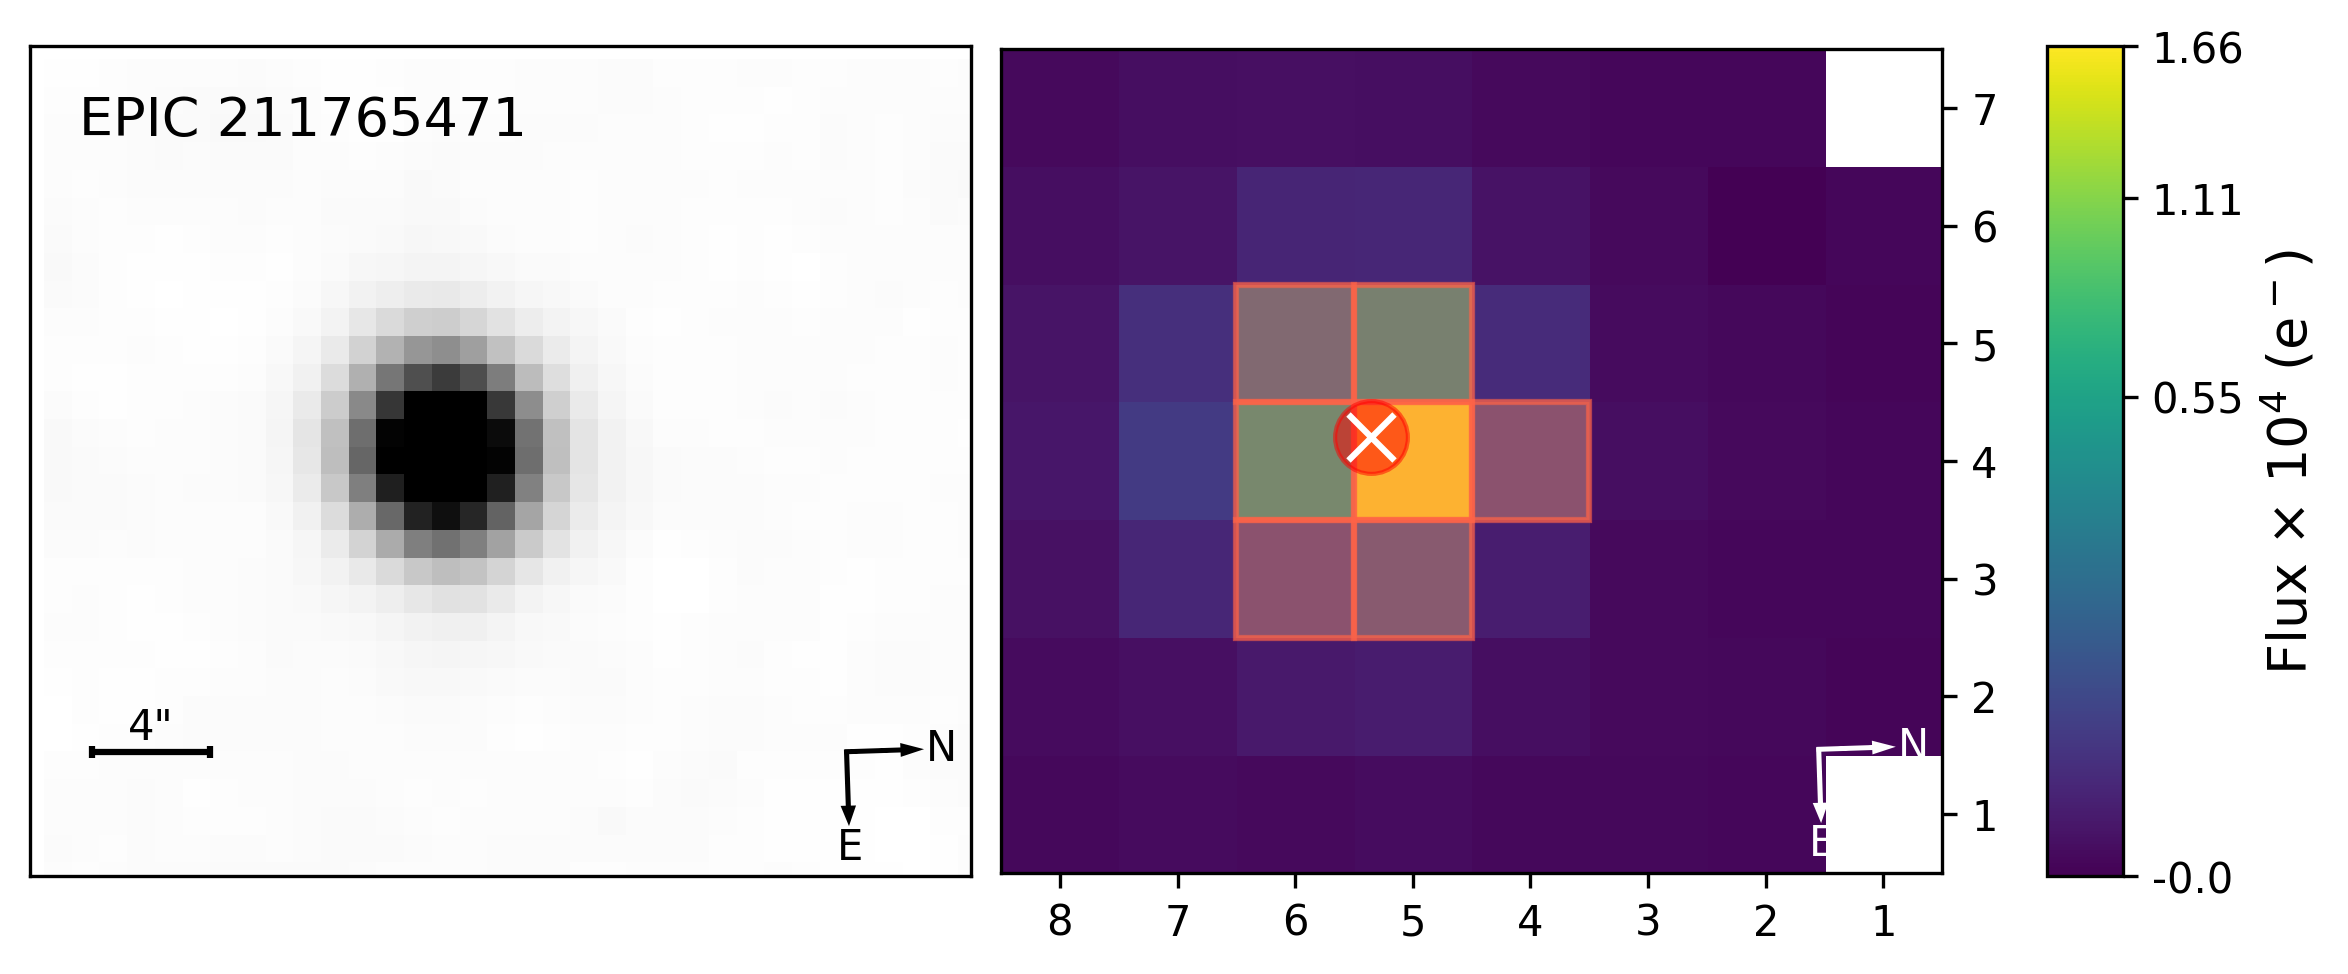
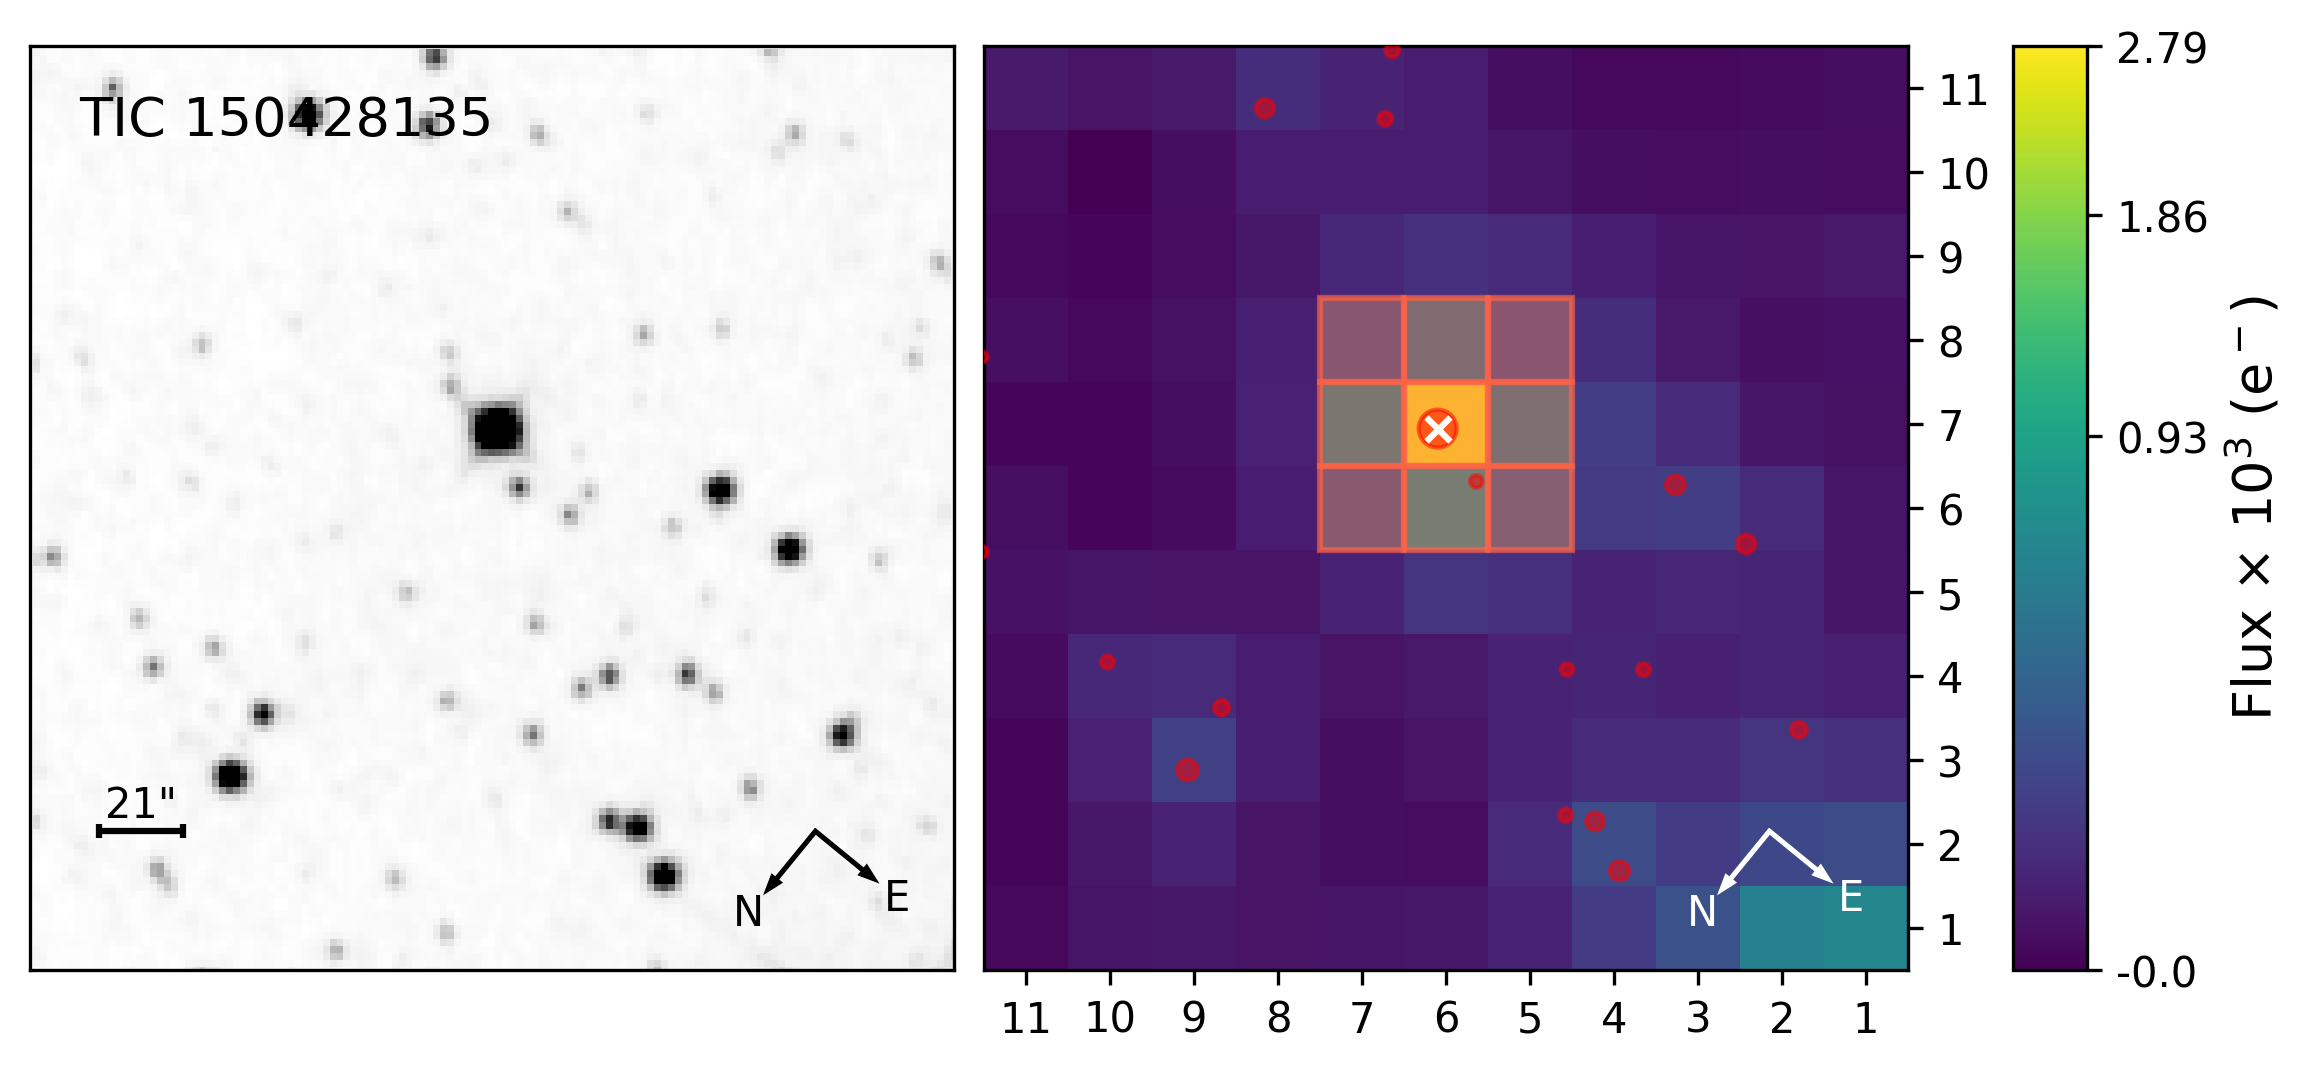
The plot_identification function creates identification charts, which are useful
for determining if a target is contaminated by nearby stars. In each chart, the
right panel overlays the Gaia DR3 catalog onto the TESS Target Pixel Files (TPF)
with the target marked by a cross symbol. The circle size represents the relative
brightness of the stars according to Gaia G magnitude. The left panel displays the
same sky coverage but taken from the
DSS2 Red survey.
This function is revised based on tpfplotter.
Plot season charts for Kepler targets.
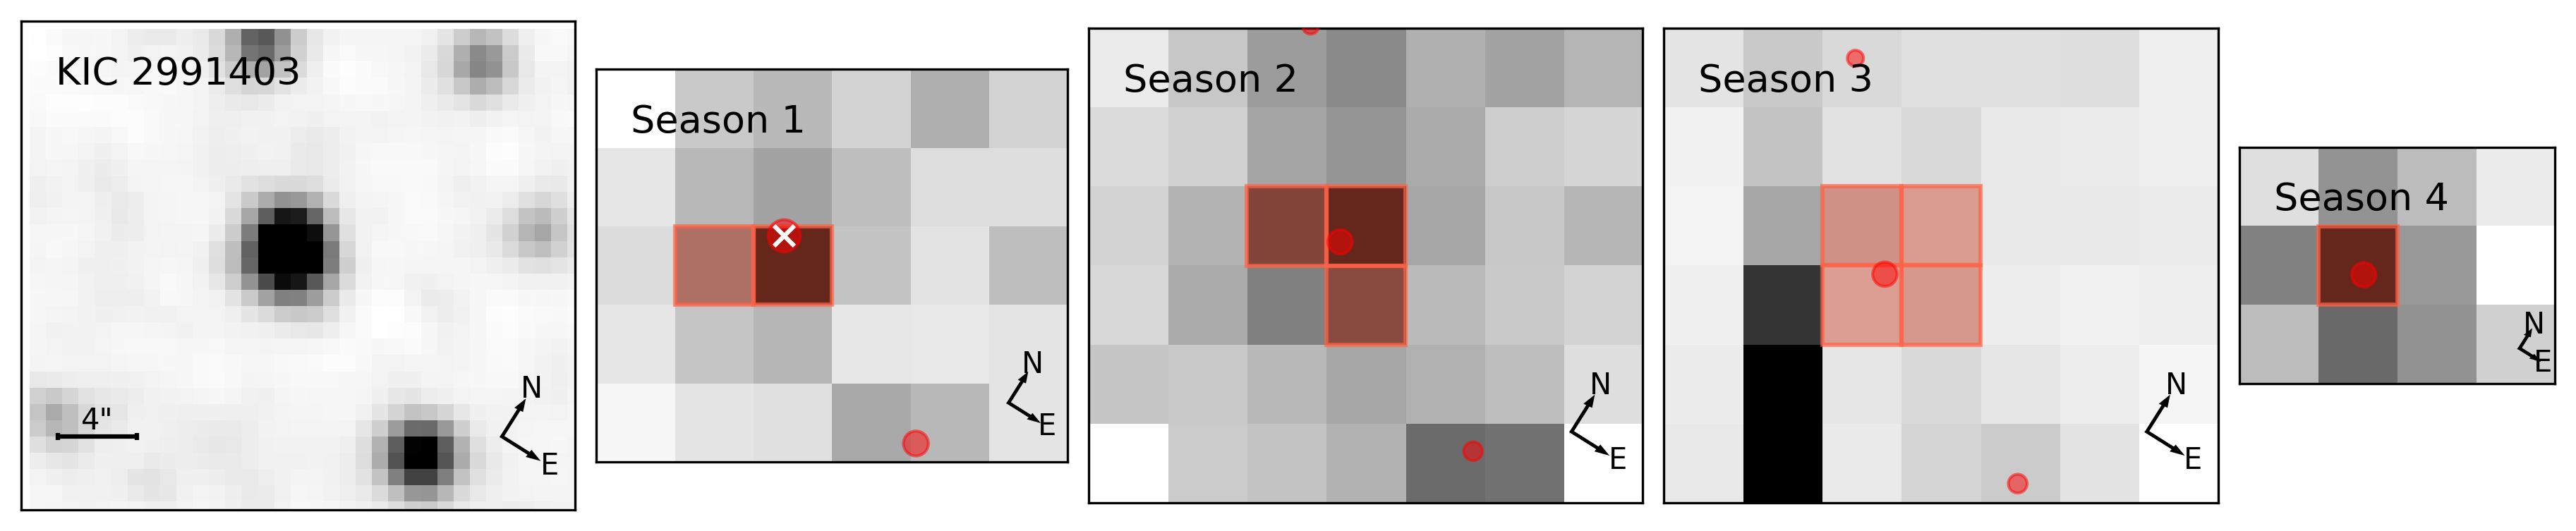
The Kepler Space Telescope was designed to observe a specific field of stars continuously, but it also needed to ensure its solar panels faced the Sun to power its operations. As Kepler orbited the Sun, it performed a 90-degree roll every three months (or every quarter) to keep its solar panels sunward. After four of these quarterly rolls, amounting to a full year and a complete 360-degree rotation, Kepler would return to its original orientation. Consequently, every set of quarters separated by four (e.g., Q1, Q5, Q9) would find Kepler with the same pointing towards its target field, as the telescope effectively revisited its initial orientation after its annual orbit.
The plot_season function creates a plot of the TPF for each season of the Kepler
mission for a given target star. Since the aperture mask may change even in the same
season, the function only plots the aperture mask for the first quarter of each
season. This function is only applicable for Kepler targets.
Season 1: Q1, Q5, Q9, Q13, Q17
Season 2: Q2, Q6, Q10, Q14
Season 3: Q3, Q7, Q11, Q15
Season 4: Q4, Q8, Q12, Q16
You can install this package using pip:
pip install tpfiTo upgrade to the latest version, run:
pip install -U tpfiSee the example notebook for more details.
If you use this package in your research, please add the following sentence to the footnote or acknowledgement section of your paper:
This work has made use of \texttt{tpfi} (publicly available at \url{https://github.com/keyuxing/tpfi}).
and cite our paper:
Xing et al., 2024, link
If you would like to contribute to this project, feel free to submit a pull request or open an issue on GitHub. Any suggestion, improvement, or bug report is welcomed.
This project is licensed under the MIT License - see the LICENSE file for details.