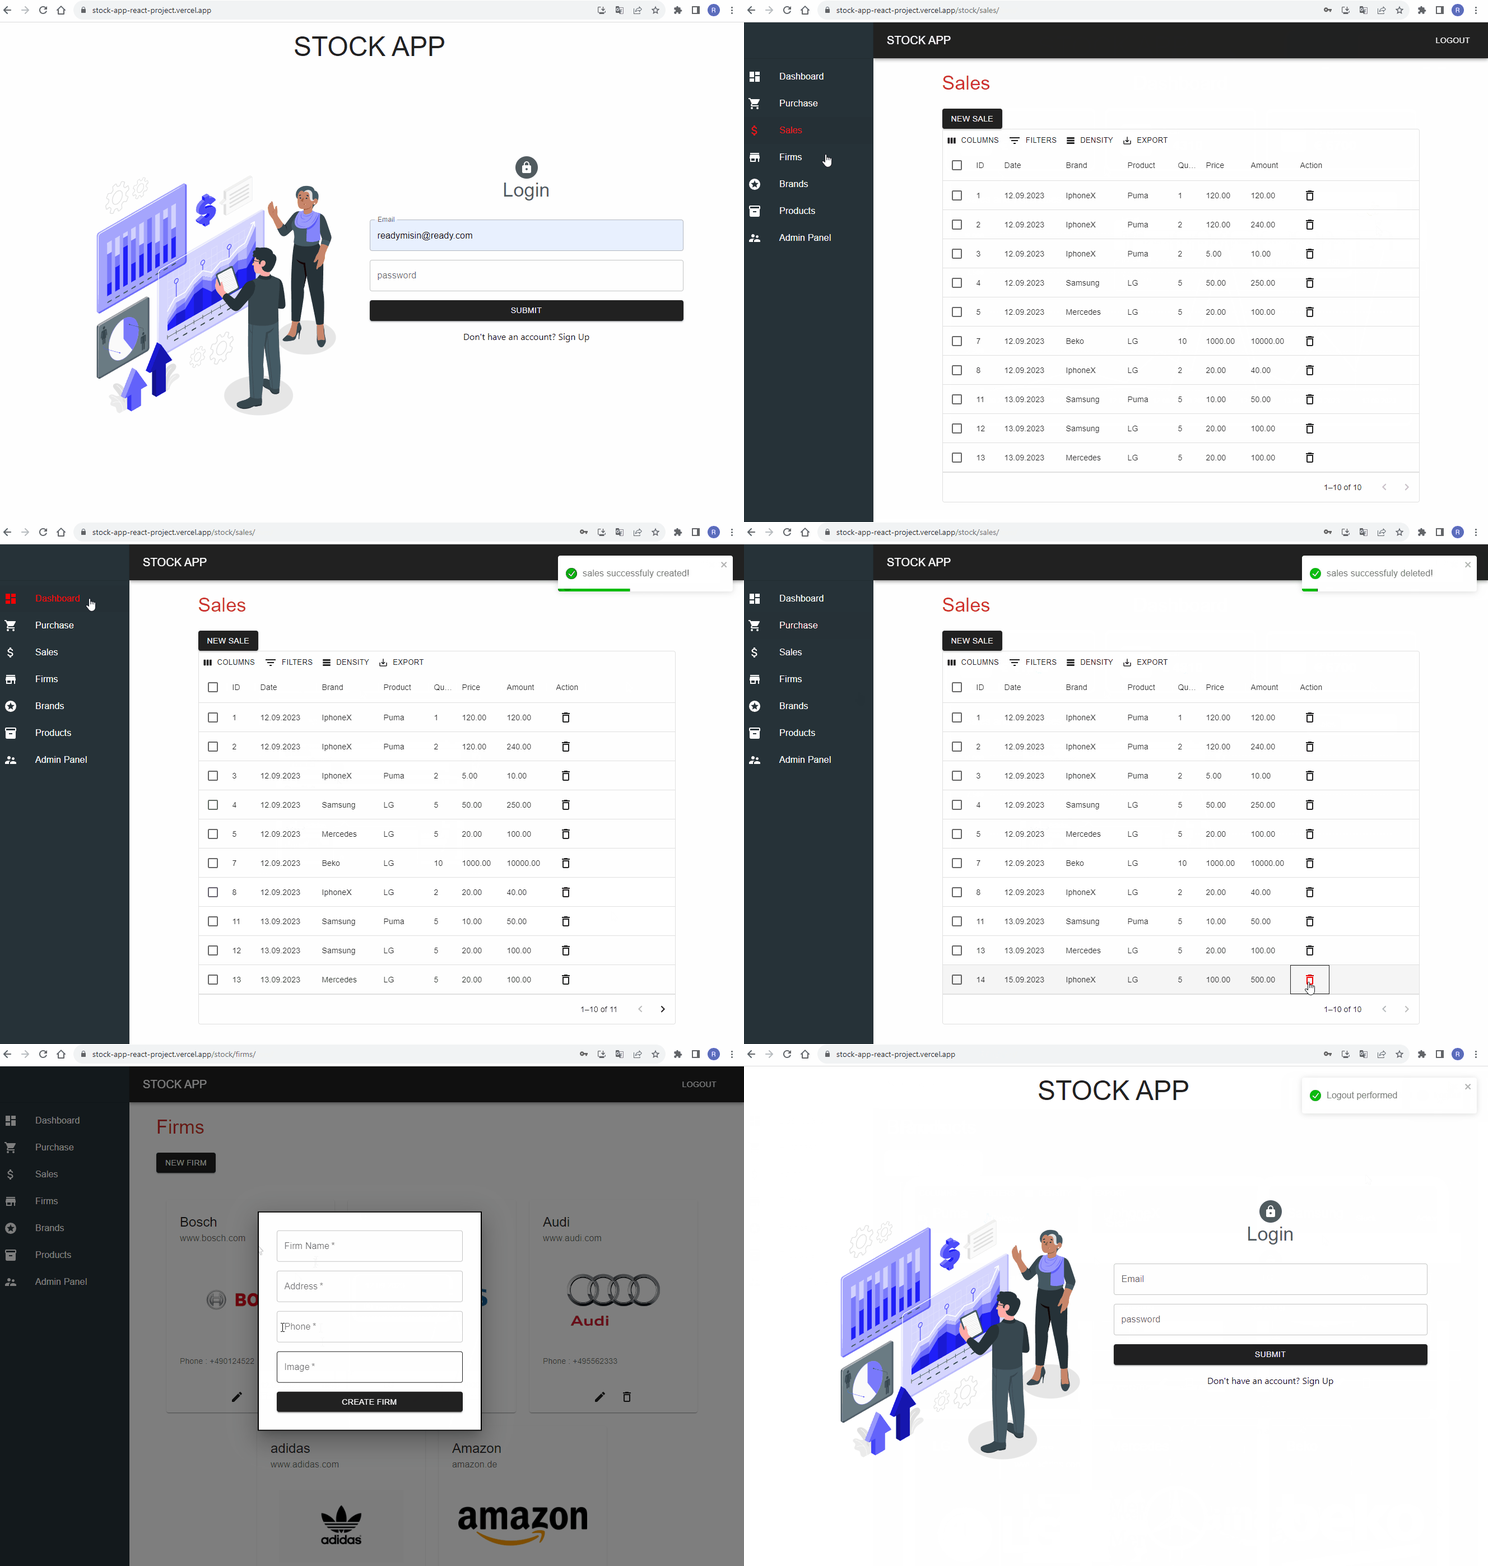
The Stock Management System is a web application designed to manage inventory and sales data. It provides a user-friendly interface for tracking sales, profits, brands, and firms. This README.md file provides an overview of the project's main components and functionalities.
- React: The project is built using the React library for building user interfaces.
- Material-UI: Material-UI is used for styling and UI components.
- Tremor Chart: The Tremor Chart library is used for data visualization.
- Redux Toolkit: Redux Toolkit might be used for state management, but the code snippets related to Redux are currently commented out.
- The
Home.jscomponent serves as the dashboard's landing page. - It displays key performance indicators (KPIs) using cards and charts.
- KPIs include sales, profits, and customer metrics.
- Data is fetched using the
useStockCallhook when the component mounts.
- The
KpiCards.jscomponent displays KPIs as cards on the dashboard. - It dynamically updates KPI values when data changes.
- The
Charts.jscomponent visualizes historical data using interactive charts. - Users can analyze sales and profit trends over time.
- The
Brands.jscomponent manages brand information. - Users can view, add, and edit brand details.
- Brand data is fetched from the server using the
useStockCallhook. - Brand images can be uploaded when creating or editing a brand.
- The
Firms.jscomponent handles firm data. - It allows users to view, create, and edit firm information.
- Firm data is retrieved from the server using the
useStockCallhook. - The component features a modal for adding new firms.
- The
Login.jscomponent provides a login interface. - Users can access their accounts by entering their credentials.
- Form validation is implemented using Formik and Yup schemas.
- User authentication is handled by the
useAuthCallhook.
- The
Register.jscomponent enables user registration. - Users can create new accounts with their personal information.
- Form validation ensures data accuracy.
- Registration is handled by the
useAuthCallhook.
- Material-UI: Material-UI is used for building the user interface and styling components.
- React: The project is built using the React library for creating reusable UI components.
- Redux: Redux is used for state management, but some code snippets related to Redux are commented out.
- Formik and Yup: Formik and Yup are used for form management and validation.
- Axios: Axios is used for making HTTP requests to the server.
The Sales Dashboard project is a web application designed to visualize and manage sales data. It provides insights into sales, profits, and customer metrics. This README.md file provides an overview of the project's components and functionalities.
The Sales.js component is responsible for displaying sales data. It retrieves data using the useStockCall hook and displays it in a table format. The component includes the following features:
- New Sale Button: Users can create new sales by clicking the "New Sale" button, which opens a modal for entering sale information.
- Sale Modal: The modal allows users to input sale details such as brand, product, quantity, and price.
- Initialization: The
useEffecthook is used to fetch sales data when the component mounts.
The TremorChart.js component is responsible for visualizing performance metrics. It uses the Tremor Chart library to display key performance indicators (KPIs) over time. The component includes the following features:
- KPI Selection: Users can switch between different KPIs (Sales, Profit, Customers) using tabs.
- Area Chart: The component displays an area chart that shows the selected KPI over time.
- Responsive Design: The chart is responsive and adjusts for different screen sizes.
The project includes functions for formatting data, such as currency formatting for sales and profit values.
The project uses data from an API, related to sales and purchases. This data is used to populate the charts and tables.
