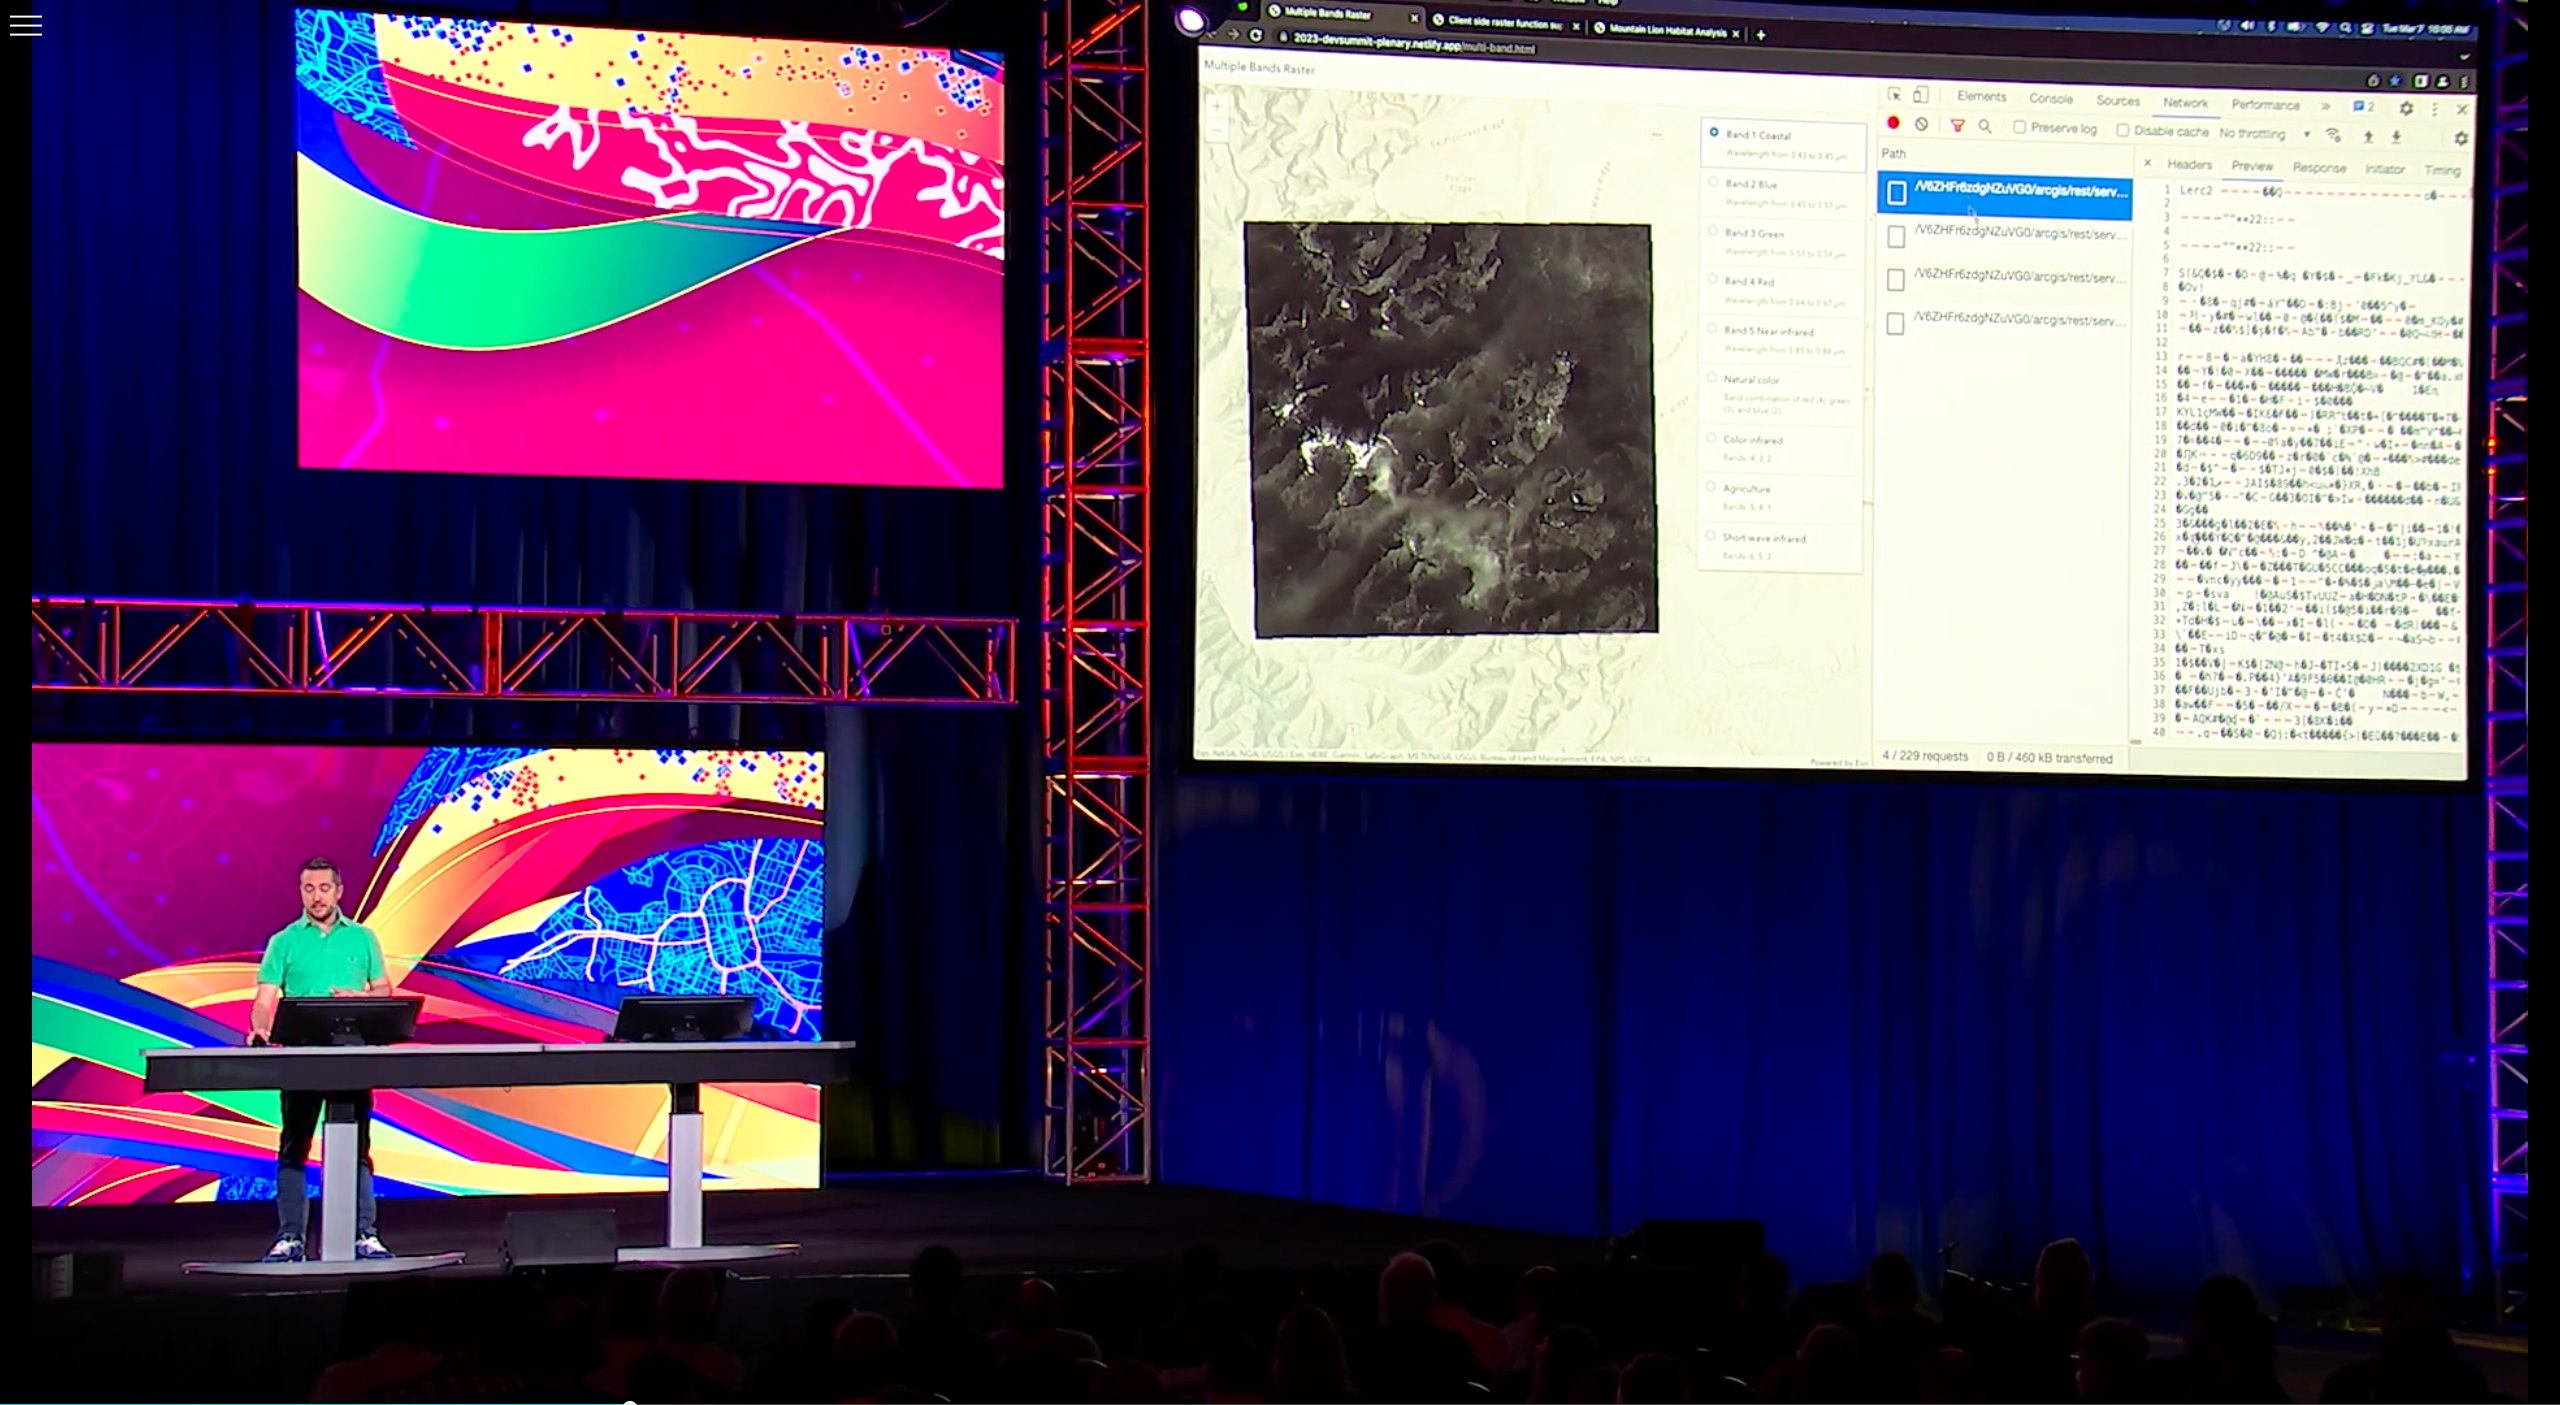
The following demos were presented at the Esri DevSummit 2023 to showcase new client-side raster functions capability of the ArcGIS Maps SDK for JavaScript 4.26 (Mars 2023).
- Multi-band
- NDVI
- Mountain Lion
- Scraped
Elevation
Watch on mediaspace.esri.com
The ImageryTileLayer from the JavaScript Maps SDK fetches, processes, and renders raster data directly in the web browser, enabling new workflows. Let me show you how it works and some of its features.
Open developer tools > Network tab
This map here displays a multi-band raster from Landsat 8, hosted as an tiled image service.
Like its name suggests, the ImageryTileLayer requests tiles. You know about tiles; they are great because they are cacheable by the browser and the CDN and make the tile service scalable.
If we look at a tile, we can see that these are not images. In fact, each tile contains the actual pixel values from the raster at the tile resolution.
Even better, if I can configure the layer to display the individual band of the raster or one of the typical compositions like “Natural Color”, “Color Infrared”, or “Agriculture”, notice that there was no additional network request made. This is because the tile contains the pixel values for all the bands at once.
It’s the layer that extracts and processes the values on the client, by converting them to colored pixels.
Now what if we could define that pixel processing…
Well, we just released in beta: client-side Raster Functions.
A Raster Function takes raster data as input with a few other parameters and outputs a new raster.
In this example, I want to visualize the NDVI, which is the index used to quantify vegetation greenness and health. It is calculated as a ratio using the red and near infrared bands.
Highlight first raster function.
First, I specify the name of the raster function to execute, NDVI, as well as the ids for the red and near infrared bands as arguments.
Then I chain that function with another one to map the calculated NDVI values to a color ramp.
Finally, I assign that raster function chain on the layer to display.
Execute
Immediately we can spot greener pixels. And using the identify method of the layer, I can display in a UI the calculated NDVI value and the spectral profile chart for any of these pixels.
On greener pixels we can clearly see the difference between the red and near infrared bands.
Finally, we can create more advanced processing like this suitability analysis to evaluate the habitat of mountain lions.
I combined several layers into one multi band tiled image, to represent the different habitat preferences of mountain lions like:
- The distance to roads
- The area protection status, like state parks and national forests
- The land cover. Preys hunted by mountain lions tend to prefer forested or shrubby land.
- The terrain ruggedness, where cliffs for example give an advantage to mountain lions over their preys.
Each band is processed by raster functions and they are all combined together into the final image.
Show the raster function chain.
Here’s a representation of the full raster function chain. Let’s see the result.
Show the final result.
What’s cool is that users now can interact with these sliders to change the different parameters and see the analysis output updating in real time, so powerful.
Raster functions are available now in beta in the latest JavaScript Maps SDK. These and all the other features of the ImageryTileLayer let you to bring new, fast, and interactive raster analytics to your applications.


