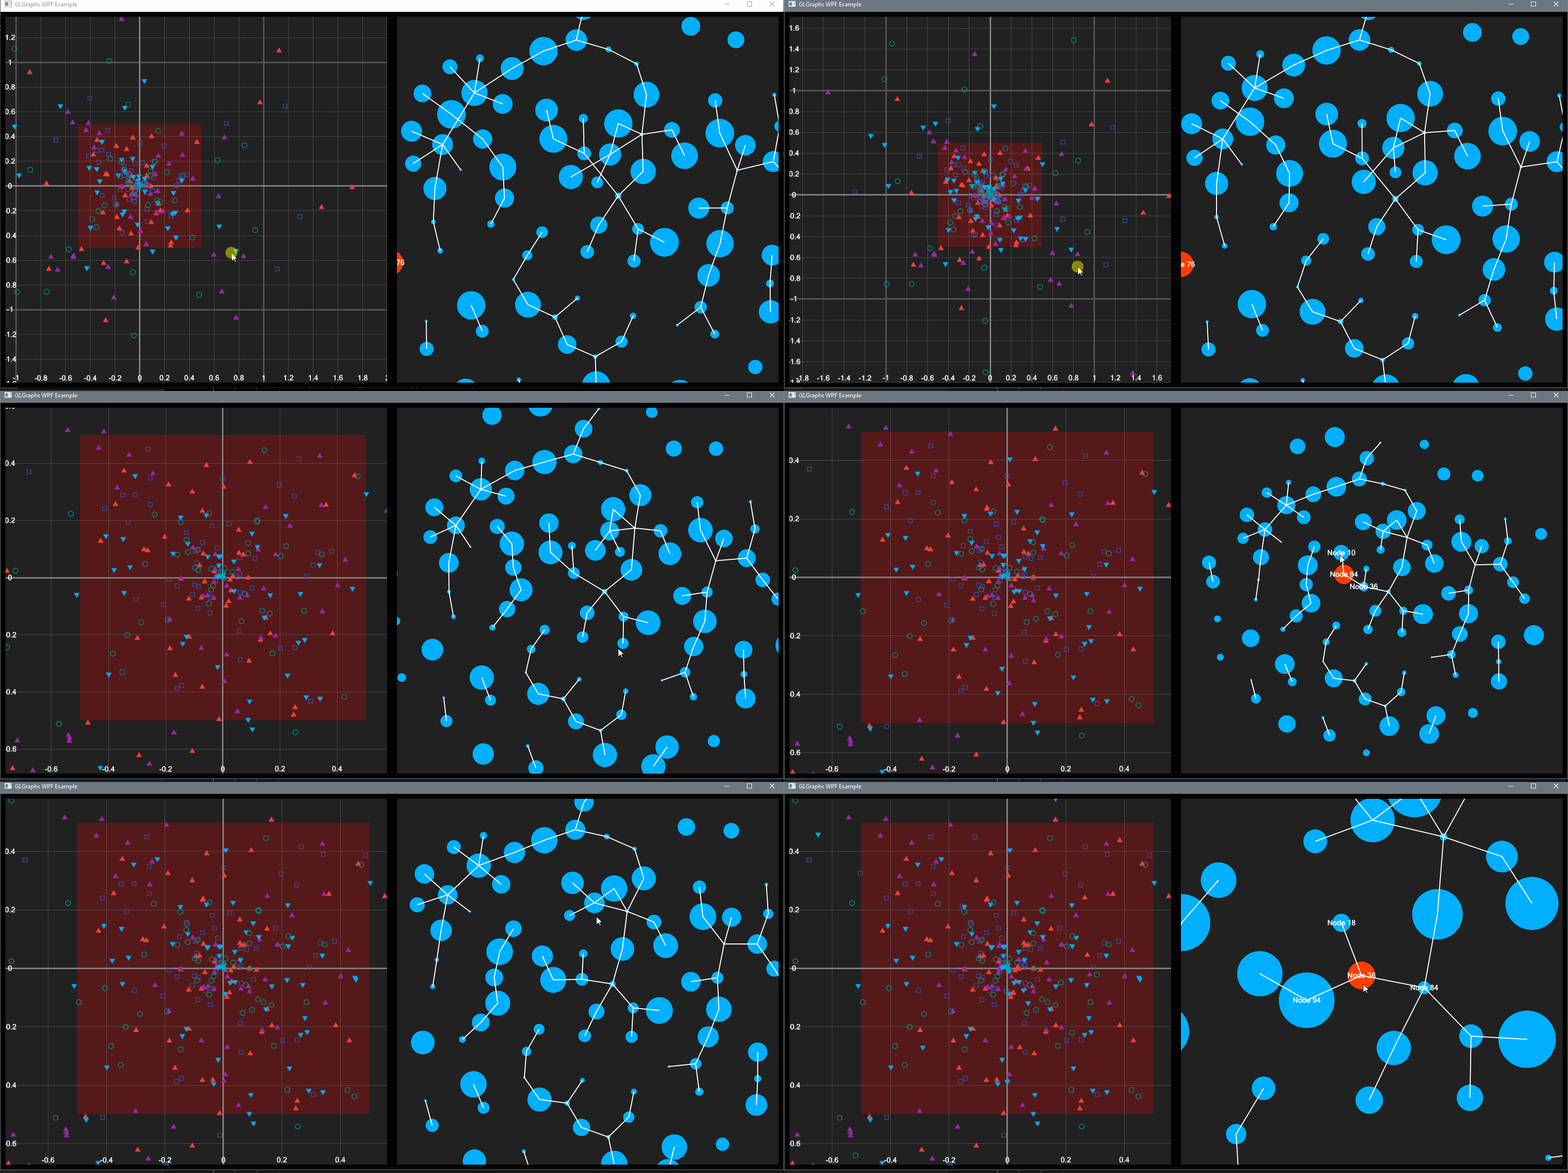
GLGraphs is a real-time graphing/charting/data visualization library for .NET that runs standalone or integrated into WPF.
The API is easily discoverable and simple to work with.
// Create a new graph with strings as the point values.
var graph = new CartesianGraph<string>();
// Add a series:
var series = graph.state.AddSeries(SeriesType.Point, "Example Series");
// Add some points:
series.Add("Origin", 0, 0);
series.Add("Destination", 2.5f, 5.0f);
To Render the graph, you need an OpenGL context. Either use GLWpfControl or simply the native windowing.
// update the state and render the graph
graph.State.Update(deltaTime)
graph.Render()
For more info, see the Examples.
- Line Plots
- Scatter XY Plots
- Network Graph view
- Dynamic Axes
- Animations
- Interactivity (selection/drag selection)
- Tooltips
- Camera control (zoom/pan)
- WPF integration
- Smooth graph scaling on point addition
- Better text handling
- Additional integrations
Oh no, it looks like you should have bought SciChart instead!
GLGraph is a community-run project. If something is broken you'll need to fix it yourself.
Thankfully the code is simple, clean and easy to work with, and there's hopefully soon to be a budding community of people using this library.
Drop by the OpenTK Discord and ping @varon in the #general channel for some info.
- It's slow. Even with the paid-for geared package.
- The codebase is a mess.
- The maintainer is AWOL.
Yes, everything is animated.
Way, way faster than LiveCharts.
Easily 10 million points with full camera animation at 60fps.
Simplicity and performance are the primary goals of the library.
No MVVM is used, and the code is clean, fast and simple.
All rendering is hardware accelerated by OpenGL via OpenTK.
This should be fairly easy to do. More or less create a control on that framework that can display OpenGL, make the right calls and you're good to go.

