Solves a stochastic SEIR model for disease progression. SanSEIR
reproduces the results presented in the paper
Yao Yu Yeo, Yao-Rui Yeo, Wan-Jin Yeo, A Computational Model for Estimating the Progression of the COVID-19 Cases in the US West and East Coasts, MedRxiv, https://doi.org/10.1101/2020.03.24.20043026
Sample results based on the inputs of Yeo et al. are given in the yeo-etal
directory.
To build with gfortran simply:
make
You will need to modify the Makefile if you use a different FORTRAN compiler.
Once you have sanseir build, to run simply pass the input file (in FORTRAN
namelist format) as an argument
cd yeo-etal/usa
../../sanseir.exe usa.inp
This generates an ensemble of 50 runs with output files called
output.*, scaled.*, rates.*.
These can be plotted using gnuplot. For example, to plot the cummulative
deaths
gnuplot
plot for [i=1:50] file=sprintf("output.%d",i) file using 1:12 w l lt 'grey' title ""
There are a number of gnuplot scripts for making typical plots in the plot
directory.
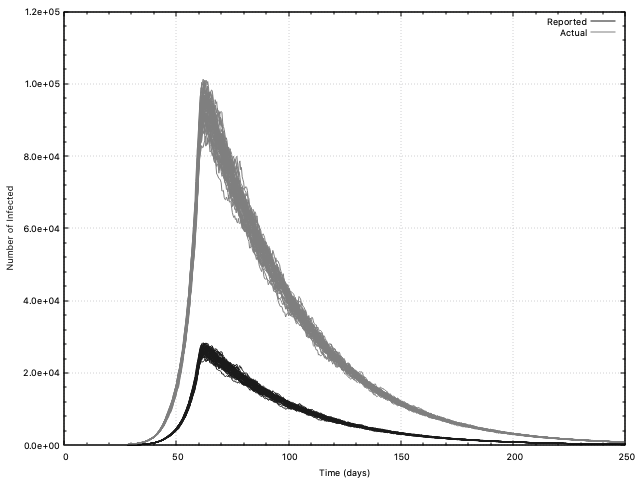
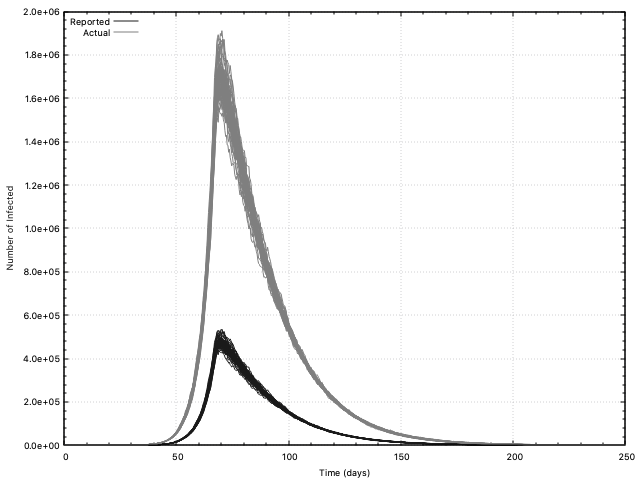
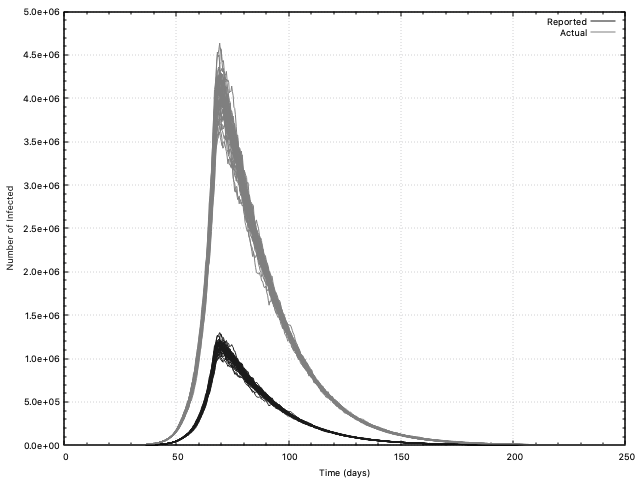
For example, to make the West Coast plot shown at the bottom of this page, do the following
cd yeo-etal/west
../../sanseir.exe west.inp
gnuplot
load "../../plot/all-infected.com"
| Item | Description |
|---|---|
yeo-etal |
Inputs and results for https://doi.org/10.1101/2020.03.24.20043026 |
test |
Additional experimental input files |
plot |
Scripts to make plots using gnuplot |
sanseir.f90 |
SanSEIR source code in FORTRAN90 |
cleanup |
Script to cleanup all output files from SanSEIR` |
S. Scott Collis\


