You need at least one saved visualization to use a dashboard.
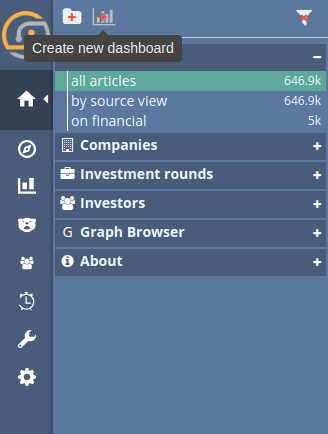
Dashboards can be accessed via the home icon or the Siren logo. When you click Dashboard, {kibi-name} displays the first available dashboard or, if no dashboards have been defined, the dashboard creation screen.
You can create a new dashboard by clicking on the icon in the dashboard panel:
Build your dashboard by adding visualizations. By default, {kibi-name} dashboards use a light color theme. To use a dark color theme instead, click the Options button (which you can find on the top horizonal menu or by right clicking on the dashboard name) and check the Use dark theme box.
|
Note
|
You can change the default theme in the Advanced section of the Settings tab. |
To save the dashboard, click the Save button:
The name of the dashboard can be set in the Save As field.
If Store time with dashboard is checked, the time filter  currently set will
be restored when the dashboard is opened.
To display the number of Elasticsearch documents displayed by the dashboard in the corresponding tab, select a Saved Search:
You can share dashboards with other users by sending a link or by embedding them into HTML pages; make sure that your {kibi-name} installation is properly secured when sharing a dashboard on a public facing server.
|
Note
|
To view shared dashboards users must be able to access {kibi-name}; keep this in mind if your {kibi-name} instance is protected by an authentication proxy. |
To share a dashboard, click the Share button to display the Sharing panel.
To embed a dashboard, copy the embed code from the Share display into your external web application.
To add a visualization to the dashboard, click the Add button in the toolbar panel, then select a previously created visualization from the list:
You can filter the list of visualizations by typing a filter string into the Visualization Filter field.
The visualization you select appears in a container on your dashboard.
|
Note
|
If you see a message about the container’s height or width being too small, resize the container. |
The visualizations in your dashboard are stored in resizable containers that you can arrange on the dashboard. This section discusses customizing these containers.
Click and hold a container’s header to move the container around the dashboard. Other containers will shift as needed to make room for the moving container. Release the mouse button to confirm the container’s new location.
Move the cursor to the bottom right corner of the container until the cursor changes to point at the corner. After the cursor changes, click and drag the corner of the container to change the container’s size. Release the mouse button to confirm the new container size.
Click the x icon at the top right corner of a container to remove that container from the dashboard. Removing a container from a dashboard does not delete the saved visualization in that container.
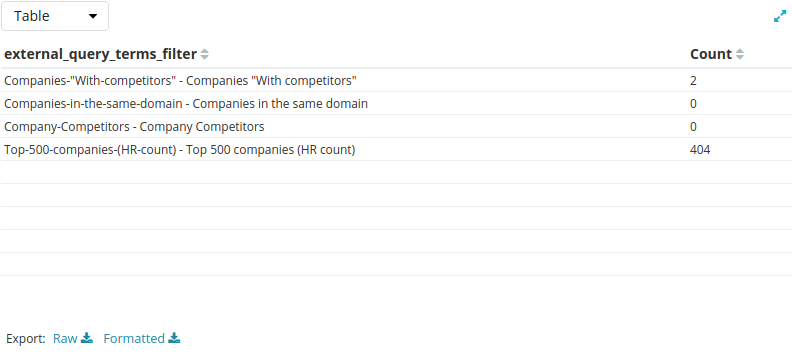
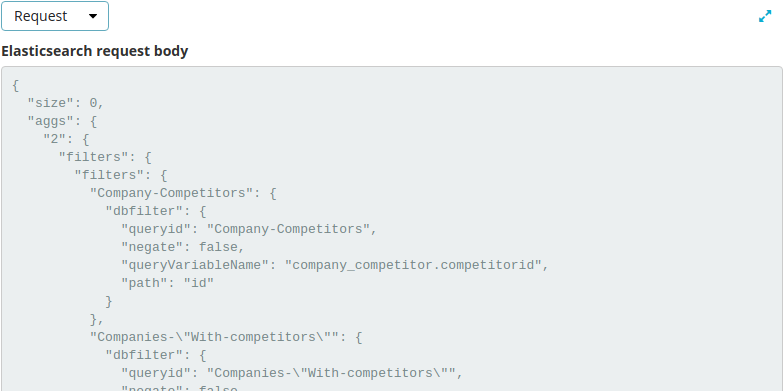
To display the raw data behind the visualization, click the bar at the bottom of the container. Tabs with detailed information about the raw data replace the visualization, as in this example:
A representation of the underlying data, presented as a paginated data grid. You can sort the items in the table by clicking on the table headers at the top of each column.
The raw request used to query the server, presented in JSON format.
The raw response from the server, presented in JSON format.
A summary of the statistics related to the request and the response, presented as a data grid. The data grid includes the query duration, the request duration, the total number of records found on the server, and the index pattern used to make the query.
A summary of the visualization state (for example, visualization parameters and aggregations) and other details.
To export the raw data behind the visualization as a comma-separated-values (CSV) file, click on either the Raw or Formatted links at the bottom of any of the detailed information tabs. A raw export contains the data as it is stored in Elasticsearch. A formatted export contains the results of any applicable {kibi-name} [field formatters].
Click the Edit button  at the top right of a container to open the
visualization in the Visualize page.


