# Installation and Usage
- [Features](#features)
- [Architecture](#architecture)
- [Tutorials and Demos](#tutorials-and-demos)
- [Install operator](#install-operator)
- [Installation using OLM from operatorhub.io](#installation-using-olm-from-operatorhubio)
- [OpenShift](#openshift)
- [Other Kubernetes distributions](#other-kubernetes-distributions)
- [Installation using OLM using upstream catalog and bundle](#installation-using-olm-using-upstream-catalog-and-bundle)
- [Installation using helm](#installation-using-helm)
- [Troubleshooting and maintenance](#troubleshooting-and-maintenance)
- [Installation on AKS](#installation-on-aks)
- [Configure a custom kubelet root directory](#configure-a-custom-kubelet-root-directory)
- [Set a custom priority class name for spod daemon pod](#set-a-custom-priority-class-name-for-spod-daemon-pod)
- [Set logging verbosity](#set-logging-verbosity)
- [Pull images from private registry](#pull-images-from-private-registry)
- [Configure the SELinux type](#configure-the-selinux-type)
- [Customise the daemon resource requirements](#customise-the-daemon-resource-requirements)
- [Restrict the allowed syscalls in seccomp profiles](#restrict-the-allowed-syscalls-in-seccomp-profiles)
- [Constrain spod scheduling](#constrain-spod-scheduling)
- [Enable memory optimization in spod](#enable-memory-optimization-in-spod)
- [Create a seccomp profile](#create-a-seccomp-profile)
- [Apply a seccomp profile to a pod](#apply-a-seccomp-profile-to-a-pod)
- [Base syscalls for a container runtime](#base-syscalls-for-a-container-runtime)
- [OCI Artifact support for base profiles](#oci-artifact-support-for-base-profiles)
- [Label namespaces for binding and recording](#label-namespaces-for-binding-and-recording)
- [Bind workloads to profiles with ProfileBindings](#bind-workloads-to-profiles-with-profilebindings)
- [Record profiles from workloads with ProfileRecordings](#record-profiles-from-workloads-with-profilerecordings)
- [Log enricher based recording](#log-enricher-based-recording)
- [eBPF based recording](#ebpf-based-recording)
- [Merging per-container profile instances](#merging-per-container-profile-instances)
- [Disable profile recording](#disable-profile-recording)
- [Create a SELinux Profile](#create-a-selinux-profile)
- [Apply a SELinux profile to a pod](#apply-a-selinux-profile-to-a-pod)
- [Make a SELinux profile permissive](#make-a-selinux-profile-permissive)
- [Record a SELinux profile](#record-a-selinux-profile)
- [Restricting to a Single Namespace](#restricting-to-a-single-namespace)
- [Restricting to a Single Namespace with upstream deployment manifests](#restricting-to-a-single-namespace-with-upstream-deployment-manifests)
- [Restricting to a Single Namespace when installing using OLM](#restricting-to-a-single-namespace-when-installing-using-olm)
- [Using metrics](#using-metrics)
- [Available metrics](#available-metrics)
- [Automatic ServiceMonitor deployment](#automatic-servicemonitor-deployment)
- [Using the log enricher](#using-the-log-enricher)
- [Configuring webhooks](#configuring-webhooks)
- [Troubleshooting](#troubleshooting)
- [Enable CPU and memory profiling](#enable-cpu-and-memory-profiling)
- [Use a custom /proc location for nested environments like kind](#use-a-custom-proc-location-for-nested-environments-like-kind)
- [Notes on OpenShift and SCCs](#notes-on-openshift-and-sccs)
- [SELinux recording should allow seLinuxContext: RunAsAny](#selinux-recording-should-allow-selinuxcontext-runasany)
- [Replicating controllers and SCCs](#replicating-controllers-and-sccs)
- [Create an AppArmor profile](#create-an-apparmor-profile)
- [Apply an AppArmor profile to a pod](#apply-an-apparmor-profile-to-a-pod)
- [Known limitations](#known-limitations)
- [Command Line Interface (CLI)](#command-line-interface-cli)
- [Record seccomp profiles for a command](#record-seccomp-profiles-for-a-command)
- [Run commands with seccomp profiles](#run-commands-with-seccomp-profiles)
- [Pull security profiles from OCI registries](#pull-security-profiles-from-oci-registries)
- [Push security profiles to OCI registries](#push-security-profiles-to-oci-registries)
- [Uninstalling](#uninstalling)
## Features
The feature scope of the security-profiles-operator is right now limited to:
- Adds a `SeccompProfile` CRD (alpha) to store seccomp profiles.
- Adds a `ProfileBinding` CRD (alpha) to bind security profiles to pods.
- Adds a `ProfileRecording` CRD (alpha) to record security profiles from workloads.
- Synchronize seccomp profiles across all worker nodes.
- Validates if a node supports seccomp and do not synchronize if not.
- Providing metrics endpoints
- Providing a Command Line Interface `spoc` for use cases not including Kubernetes.
## Architecture

## Tutorials and Demos
- [Using the EBPF Superpowers To Generate Kubernetes Security Policies](https://youtu.be/3dysej_Ydcw)
from [@mauriciovasquezbernal](https://github.com/mauriciovasquezbernal) and [@alban](https://github.com/alban) - Oct 2022
- [Securing Kubernetes Applications by Crafting Custom Seccomp Profiles](https://youtu.be/alx38YdvvzA)
from [@saschagrunert](https://github.com/saschagrunert) - May 2022
- [Enhancing Kubernetes with the Security Profiles Operator](https://youtu.be/xisAIB3kOJo)
from [@cmurphy](https://github.com/cmurphy) and [@saschagrunert](https://github.com/saschagrunert) - Oct 2021
- [Introduction to Seccomp and the Kubernetes Seccomp Operator](https://youtu.be/exg_zrg16SI)
from [@saschagrunert](https://github.com/saschagrunert) and [@hasheddan](https://github.com/hasheddan) - Aug 2020
## Install operator
The operator container image consists of an image manifest which supports the
architectures `amd64` and `arm64` for now. To deploy the operator, first install
cert-manager via `kubectl`, if you're **not** running on
[OpenShift](https://www.redhat.com/en/technologies/cloud-computing/openshift):
```sh
$ kubectl apply -f https://github.com/cert-manager/cert-manager/releases/download/v1.11.1/cert-manager.yaml
$ kubectl --namespace cert-manager wait --for condition=ready pod -l app.kubernetes.io/instance=cert-manager
```
OpenShift ships it's own CA injector which means we can skip installing
cert-manager. After this step, apply the operator manifest:
```sh
$ kubectl apply -f https://raw.githubusercontent.com/kubernetes-sigs/security-profiles-operator/main/deploy/operator.yaml
```
### Installation using OLM from operatorhub.io
It is also possible to install packages from [operatorhub.io](https://operatorhub.io/operator/security-profiles-operator)
using [OLM](https://operator-framework.github.io/olm-book/).
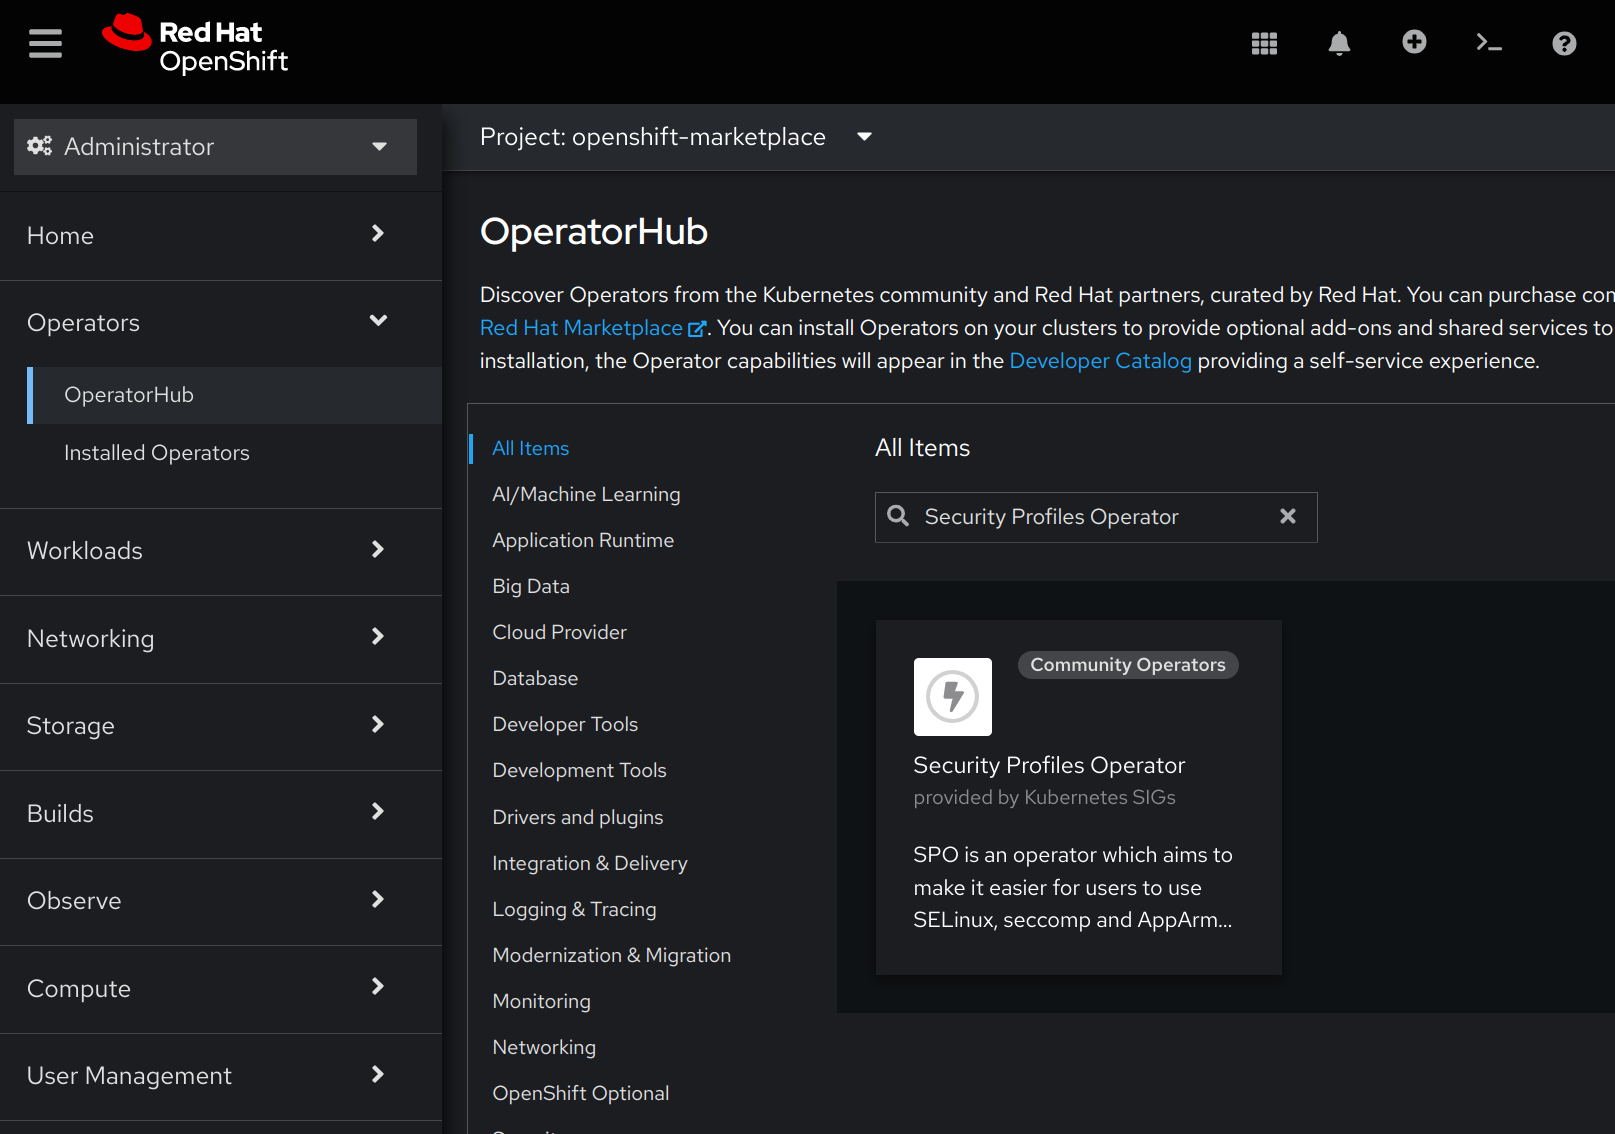
#### OpenShift
To be able to use the OperatorHub.io resources in OpenShift, create a new
`CatalogResource` like this:
```yaml
apiVersion: operators.coreos.com/v1alpha1
kind: CatalogSource
metadata:
name: operatorhubio
namespace: openshift-marketplace
spec:
displayName: Community Operators
image: quay.io/operator-framework/upstream-community-operators:latest
publisher: OperatorHub.io
sourceType: grpc
```
After that, the Security Profiles Operator should then be installable via OperatorHub.
#### Other Kubernetes distributions
To install SPO, first make sure that OLM
itself is [installed](https://operator-framework.github.io/olm-book/docs/install-olm.html). Then install
SPO using the provided manifest:
```sh
$ kubectl apply -f https://raw.githubusercontent.com/kubernetes-sigs/security-profiles-operator/main/examples/olm/operatorhub-io.yaml
```
SPO would be then installed in the `security-profiles-operator` namespace. To troubleshoot the installation,
check the state of the `Subscription`, `CSV` and `InstallPlan` objects in the `security-profiles-operator` namespace:
```sh
$ kubectl get ip,csv,sub -nsecurity-profiles-operator
```
### Installation using OLM using upstream catalog and bundle
The SPO upstream also creates bundles and catalogs for both released versions
and after every commit to the `main` branch. Provided that your cluster uses OLM
(see above) you can install SPO using:
```sh
$ kubectl apply -f https://raw.githubusercontent.com/kubernetes-sigs/security-profiles-operator/main/examples/olm/install-resources.yaml
```
Note that on OpenShift, the OLM catalogs are deployed into the `openshift-marketplace` namespace, so you'd
need to replace the namespaces before deploying:
```shell
manifest=https://raw.githubusercontent.com/kubernetes-sigs/security-profiles-operator/main/examples/olm/install-resources.yaml
$ curl $manifest | sed "s#olm#openshift-marketplace#g" | oc apply -f -
```
### Installation using helm
A helm chart is also available for installation. The chart is attached to each
[GitHub release](https://github.com/kubernetes-sigs/security-profiles-operator/releases)
as an artifact, and can be installed by executing the following shell commands:
You may also specify a different target namespace with `--namespace mynamespace` or `--namespace mynamespace --create-namespace` if it still doesn't exist.
```shell
# Install cert-manager if it is not already installed (TODO: The helm
# chart might do this one day - see issue 1062 for details):
kubectl apply -f https://github.com/cert-manager/cert-manager/releases/download/v1.8.0/cert-manager.yaml
kubectl --namespace cert-manager wait --for condition=ready pod -l app.kubernetes.io/instance=cert-manager
# Create the namespace beforehand
export spo_ns=security-profiles-operator
kubectl create ns $spo_ns
# Label and annotate the ns to make it manageable by helm. Ensure it is
# running on the privileged Pod Security Standard.
kubectl label ns $spo_ns \
app=security-profiles-operator \
pod-security.kubernetes.io/audit=privileged \
pod-security.kubernetes.io/enforce=privileged \
pod-security.kubernetes.io/warn=privileged \
app.kubernetes.io/managed-by=Helm \
--overwrite=true
kubectl annotate ns $spo_ns \
"meta.helm.sh/release-name"="security-profiles-operator" \
"meta.helm.sh/release-namespace"="$spo_ns" \
--overwrite
# Install the chart from the release URL (or a file path if desired)
helm install security-profiles-operator --namespace security-profiles-operator https://github.com/kubernetes-sigs/security-profiles-operator/releases/download/v0.7.1/security-profiles-operator-0.7.1.tgz
# Or update it with
# helm upgrade --install security-profiles-operator --namespace security-profiles-operator https://github.com/kubernetes-sigs/security-profiles-operator/releases/download/v0.7.1/security-profiles-operator-0.7.1.tgz
```
#### Troubleshooting and maintenance
These CRDs are not templated, but will be installed by default when running a helm install for the chart.
There is no support at this time for upgrading or deleting CRDs using Helm. [[docs](https://helm.sh/docs/chart_best_practices/custom_resource_definitions/)]
To remove everything or to do a new installation from scratch be sure to remove them first.
```shell
# Check in which ns is your release
helm list --all --all-namespaces
# Set here the target namespace to clean
export spo_ns=spo
# WARNING: following command will DELETE every CRD related to this project
kubectl get crds --no-headers |grep security-profiles-operator |cut -d' ' -f1 |xargs kubectl delete crd
kubectl get -n $spo_ns crds --no-headers |grep security-profiles-operator |cut -d' ' -f1 |xargs kubectl delete -n $spo_ns crd
# Uninstall the chart release from the namespace
helm uninstall --namespace $spo_ns security-profiles-operator
# WARNING: Delete the namespace
kubectl delete ns $spo_ns
# Install it again
helm upgrade --install --create-namespace --namespace $spo_ns security-profiles-operator deploy/helm/
```
### Installation on AKS
In case you installed SPO on an [AKS cluster](https://azure.microsoft.com/en-us/products/kubernetes-service/#overview), it is recommended to [configure webhook](#configuring-webhooks) to respect the [control-plane](https://learn.microsoft.com/en-us/azure/aks/faq#can-i-use-admission-controller-webhooks-on-aks) label as follows:
```sh
$ kubectl -nsecurity-profiles-operator patch spod spod --type=merge \
-p='{"spec":{"webhookOptions":[{"name":"binding.spo.io","namespaceSelector":{"matchExpressions":[{"key":"control-plane","operator":"DoesNotExist"}]}},{"name":"recording.spo.io","namespaceSelector":{"matchExpressions":[{"key":"control-plane","operator":"DoesNotExist"}]}}]}}'
```
Afterwards, validate spod has been patched successfully by ensuring the `RUNNING` state:
```sh
$ kubectl -nsecurity-profiles-operator get spod spod
NAME STATE
spod RUNNING
```
## Configure a custom kubelet root directory
You can configure a custom kubelet root directory in case your cluster is not using the default `/var/lib/kubelet` path.
You can achieve this by setting the environment variable `KUBELET_DIR` in the operator deployment. This environment variable will
be then set in the manager container as well as it will be propagated into the containers part of spod daemonset.
Furthermore, you can configure a custom kubelet root directory for each node or a pool of worker nodes inside the cluster. This
can be achieved by applying the following label on each node object which has a custom path:
```
kubelet.kubernetes.io/directory-location: mnt-resource-kubelet
```
Where the value of the label is the kubelet root directory path, by replacing `/` with `-`. For example the value above is translated
by the operator from `mnt-resource-kubelet` into path `/mnt/resource/kubelet`.
## Set a custom priority class name for spod daemon pod
The default priority class name of the spod daemon pod is set to `system-node-critical`. A custom priority class name can be configured
in the SPOD configuration by setting a value in the `priorityClassName` filed.
```
> kubectl -n security-profiles-operator patch spod spod --type=merge -p '{"spec":{"priorityClassName":"my-priority-class"}}'
securityprofilesoperatordaemon.security-profiles-operator.x-k8s.io/spod patched
```
This is useful in situations when the spod deamon pod remains in `Pending` state, because there isn't enough capacity on the related
node to be scheduled.
## Set logging verbosity
The operator supports the default logging verbosity of `0` and an enhanced `1`.
To switch to the enhanced logging verbosity, patch the spod config by adjusting
the value:
```
> kubectl -n security-profiles-operator patch spod spod --type=merge -p '{"spec":{"verbosity":1}}'
securityprofilesoperatordaemon.security-profiles-operator.x-k8s.io/spod patched
```
The daemon should now indicate that it's using the new logging verbosity:
```
> k logs --selector name=spod security-profiles-operator | head -n1
I1111 15:13:16.942837 1 main.go:182] "msg"="Set logging verbosity to 1"
```
## Pull images from private registry
The container images from spod pod can be pulled from a private registry. This can be achived by defining the `imagePullSecrets`
inside of the SPOD configuration.
## Configure the SELinux type
The operator uses by default the `spc_t` SELinux type in the security context of the daemon pod. This can be easily
changed to a different SELinux type by patching the spod config as follows:
```
> kubectl -n security-profiles-operator patch spod spod --type=merge -p '{"spec":{"selinuxTypeTag":"unconfined_t"}}'
securityprofilesoperatordaemon.security-profiles-operator.x-k8s.io/spod patched
```
The `ds/spod` should now be updated by the manager with the new SELinux type, and all daemon pods recreated:
```
kubectl get ds spod -o yaml | grep unconfined_t -B2
runAsUser: 65535
seLinuxOptions:
type: unconfined_t
--
runAsUser: 0
seLinuxOptions:
type: unconfined_t
--
runAsUser: 0
seLinuxOptions:
type: unconfined_t
```
## Customise the daemon resource requirements
The default resource requirements of the daemon container can be adjusted by using the field `daemonResourceRequirements`
from the SPOD configuration as follows:
```
kubectl -n security-profiles-operator patch spod spod --type merge -p
'{"spec":{"daemonResourceRequirements": {"requests": {"memory": "256Mi", "cpu": "250m"}, "limits": {"memory": "512Mi", "cpu": "500m"}}}}'
```
## Restrict the allowed syscalls in seccomp profiles
The operator doesn't restrict by default the allowed syscalls in the seccomp profiles. This means that any
syscall can be allowed in a seccomp profile installed via the operator. This can be changed by defining the
list of allowed syscalls in the spod configuration as follows:
```
kubectl -n security-profiles-operator patch spod spod --type merge -p
'{"spec":{"allowedSyscalls": ["exit", "exit_group", "futex", "nanosleep"]}}'
```
From now on, the operator will only install the seccomp profiles which have only a subset of syscalls defined
into the allowed list. All profiles not complying with this rule, it will be rejected.
Also every time when the list of allowed syscalls is modified in the spod configuration, the operator will
automatically identify the already installed profiles which are not compliant and remove them.
## Constrain spod scheduling
You can constrain the spod scheduling via the spod configuration by setting either the `tolerations` or `affinity`.
```
kubectl -n security-profiles-operator patch spod spod --type merge -p
'{"spec":{"tolerations": [{...}]}}'
```
```
kubectl -n security-profiles-operator patch spod spod --type merge -p
'{"spec":{"affinity": {...}}}'
```
## Enable memory optimization in spod
The controller running inside of spod daemon process is watching all pods available in the cluster when profile recording
is enabled. It will perform some pre-filtering before the reconciliation to select only the pods running on local
node as well as pods annotated for recording, but this operation takes place after all pods objects are loaded
into the cache memory of the informer. This can lead to very high memory usage in large clusters with 1000s of pods, resulting
in spod daemon running out of memory or crashing.
In order to prevent this situation, the spod daemon can be configured to only load into the cache memory the pods explicitly
labeled for profile recording. This can be achieved by enabling memory optimization as follows:
```
kubectl -n security-profiles-operator patch spod spod --type=merge -p '{"spec":{"enableMemoryOptimization":true}}'
```
If you want now to record a security profile for a pod, this pod needs to be explicitly labeled with `spo.x-k8s.io/enable-recording`,
as follows:
```
apiVersion: v1
kind: Pod
metadata:
name: my-recording-pod
labels:
spo.x-k8s.io/enable-recording: "true"
```
## Create a seccomp profile
Use the `SeccompProfile` kind to create profiles. Example:
```yaml
apiVersion: security-profiles-operator.x-k8s.io/v1beta1
kind: SeccompProfile
metadata:
namespace: my-namespace
name: profile1
spec:
defaultAction: SCMP_ACT_LOG
```
This seccomp profile will be saved at the path:
`/var/lib/kubelet/seccomp/operator/my-namespace/profile1.json`.
An init container will set up the root directory of the operator to be able to
run it without root G/UID. This will be done by creating a symlink from the
rootless profile storage `/var/lib/security-profiles-operator` to the default seccomp root
path inside of the kubelet root `/var/lib/kubelet/seccomp/operator`.
### Apply a seccomp profile to a pod
Create a pod using one of the created profiles. On Kubernetes >= 1.19, the
profile can be specified as part of the pod's security context:
```yaml
apiVersion: v1
kind: Pod
metadata:
name: test-pod
spec:
securityContext:
seccompProfile:
type: Localhost
localhostProfile: operator/my-namespace/profile1.json
containers:
- name: test-container
image: nginx
```
Prior to Kubernetes 1.19, the seccomp profile is controlled by an annotation:
```yaml
apiVersion: v1
kind: Pod
metadata:
name: test-pod
annotations:
seccomp.security.alpha.kubernetes.io/pod: "localhost/operator/my-namespace/profile1.json"
spec:
containers:
- name: test-container
image: nginx
```
You can find the profile path of the seccomp profile by checking the
`seccompProfile.localhostProfile` attribute (remember to use the `wide`
output mode):
```sh
$ kubectl --namespace my-namespace get seccompprofile profile1 --output wide
NAME STATUS AGE SECCOMPPROFILE.LOCALHOSTPROFILE
profile1 Active 14s operator/my-namespace/profile1.json
```
You can apply the profile to an existing application, such as a Deployment or
DaemonSet:
```sh
kubectl --namespace my-namespace patch deployment myapp --patch '{"spec": {"template": {"spec": {"securityContext": {"seccompProfile": {"type": "Localhost", "localhostProfile": "'$(kubectl --namespace my-namespace get seccompprofile profile1 --output=jsonpath='{.status.seccompProfile\.localhostProfile}')'}}}}}}'
deployment.apps/myapp patched
```
The pods in the Deployment will be automatically restarted. Check that the
profile was applied correctly:
```sh
$ kubectl --namespace my-namespace get deployment myapp --output=jsonpath='{.spec.template.spec.securityContext}' | jq .
{
"seccompProfile": {
"localhostProfile": "operator/my-namespace/profile1.json",
"type": "Localhost"
}
}
```
Note that a security profile that is in use by existing pods cannot be
deleted unless the pods exit or are removed - the profile deletion is
protected by finalizers.
### Base syscalls for a container runtime
An example of the minimum required syscalls for a runtime such as
[runc](https://github.com/opencontainers/runc) (tested on version 1.0.0) to
launch a container can be found in [the
examples](./examples/baseprofile-runc.yaml). You can use this example as a
starting point for creating custom profiles for your application. You can also
programmatically combine it with your custom profiles in order to build
application-specific profiles that only specify syscalls that are required on
top of the base calls needed for the container runtime. For example:
```yaml
apiVersion: security-profiles-operator.x-k8s.io/v1beta1
kind: SeccompProfile
metadata:
namespace: my-namespace
name: profile1
spec:
defaultAction: SCMP_ACT_ERRNO
baseProfileName: runc-v1.1.5
syscalls:
- action: SCMP_ACT_ALLOW
names:
- exit_group
```
If you're not using runc but the alternative
[crun](https://github.com/containers/crun), then you can do the same by using
the [corresponding example profile](./examples/baseprofile-crun.yaml) (tested
with version 0.20.1).
#### OCI Artifact support for base profiles
The operator supports pulling base profiles from container registries supporting
OCI artifacts, which are right now:
- [CNCF Distribution](https://github.com/distribution/distribution)
- [Azure Container Registry](https://aka.ms/acr)
- [Amazon Elastic Container Registry](https://aws.amazon.com/ecr)
- [Google Artifact Registry](https://cloud.google.com/artifact-registry)
- [GitHub Packages container registry](https://docs.github.com/en/packages/guides/about-github-container-registry)
- [Bundle Bar](https://bundle.bar/docs/supported-clients/oras)
- [Docker Hub](https://hub.docker.com)
- [Zot Registry](https://zotregistry.io)
To use that feature, just prefix the `baseProfileName` with `oci://`, like:
```yaml
apiVersion: security-profiles-operator.x-k8s.io/v1beta1
kind: SeccompProfile
metadata:
namespace: my-namespace
name: profile1
spec:
defaultAction: SCMP_ACT_ERRNO
baseProfileName: oci://ghcr.io/security-profiles/runc:v1.1.5
```
The resulting profile `profile1` will then contain all base syscalls from the
remote `runc` profile. It is also possible to reference the base profile by its
SHA256, like `oci://ghcr.io/security-profiles/runc@sha256:380…`. Please note
that all profiles must be signed using [sigstore (cosign)](https://github.com/sigstore/cosign)
signatures, otherwise the Security Profiles Operator will reject them.
The operator internally caches pulled artifacts up to 24 hours for 1000
profiles, means that they will be refreshed after that time period, if the stack
is full or the operator daemon gets restarted. It is also possible to define
additional `baseProfileName` for existing base profiles, so the operator will
recursively resolve them up to a level of 15 stacked profiles.
Because the resulting syscalls may hidden to the user, we additionally annotate
the seccomp profile with the final results:
```console
> kubectl describe seccompprofile profile1
Name: profile1
Namespace: security-profiles-operator
Labels: spo.x-k8s.io/profile-id=SeccompProfile-profile1
Annotations: syscalls:
[{"names":["arch_prctl","brk","capget","capset","chdir","clone","close","dup3","epoll_create1","epoll_ctl","epoll_pwait","execve","exit_gr...
API Version: security-profiles-operator.x-k8s.io/v1beta1
```
We provide all available base profiles as part of the ["Security Profiles"
GitHub organization](https://github.com/orgs/security-profiles/packages).
### Label namespaces for binding and recording
The next two sections describe how to bind a security profile to a container
image and how to record a security profile from a running container. Both
operations require the one of two SPO's webhooks to take action on the workload
and in order for the webhooks to be able to reconcile the workload, the namespaces
must be labeled appropriately.
The expected labels are `spo.x-k8s.io/enable-binding` for the binding
webhook and `spo.x-k8s.io/enable-recording` for the recording webhook by
default. The labels can be set with a simple `kubectl label` command:
```sh
$ kubectl label ns spo-test spo.x-k8s.io/enable-recording=
```
Note that the labels' values are not important, only their presence matters.
In addition, the namespace selector is configurable and the webhook configuration
is described in the [configuring webhooks](#configuring-webhooks) section.
### Bind workloads to profiles with ProfileBindings
If you do not want to directly modify the SecurityContext of a Pod, for instance
if you are deploying a public application, you can use the ProfileBinding
resource to bind a security profile to a container's securityContext.
To bind a Pod that uses an 'nginx:1.19.1' image to the 'profile-complain'
example seccomp profile, create a ProfileBinding in the same namespace as both
the Pod and the SeccompProfile:
```yaml
apiVersion: security-profiles-operator.x-k8s.io/v1alpha1
kind: ProfileBinding
metadata:
name: nginx-binding
spec:
profileRef:
kind: SeccompProfile
name: profile-complain
image: nginx:1.19.1
```
If the Pod is already running, it will need to be restarted in order to pick up
the profile binding. Once the binding is created and the Pod is created or
recreated, the SeccompProfile should be applied to the container whose image
name matches the binding:
```sh
$ kubectl get pod test-pod -o jsonpath='{.spec.containers[*].securityContext.seccompProfile}'
{"localhostProfile":"operator/default/generic/profile-complain-unsafe.json","type":"Localhost"}
```
Binding a SELinux profile works in the same way, except you'd use the `SelinuxProfile` kind.
`RawSelinuxProfiles` are currently not supported.
### Record profiles from workloads with `ProfileRecordings`
The operator is capable of recording seccomp or SELinux profiles by the usage of the
built-in [eBPF](https://ebpf.io) recorder or
by evaluating the [audit][auditd] or [syslog][syslog] files. Each method has
its pros and cons as well as separate technical requirements.
Note that SELinux profiles can only be recorded using the log enricher.
#### Log enricher based recording
When using the log enricher for recording seccomp or SELinux profiles, please ensure that
the feature [is enabled within the spod](#using-the-log-enricher) configuration
resource. The log based recording works in the same way with
[containerd][containerd] and [CRI-O][cri-o], while using the node local logs as
input source of truth.
To record by using the enricher, create a `ProfileRecording` which is using
`recorder: logs`:
```yaml
apiVersion: security-profiles-operator.x-k8s.io/v1alpha1
kind: ProfileRecording
metadata:
name: test-recording
spec:
kind: SeccompProfile
recorder: logs
podSelector:
matchLabels:
app: my-app
```
Then we can create a workload to be recorded, for example two containers within
a single pod:
```yaml
apiVersion: v1
kind: Pod
metadata:
name: my-pod
labels:
app: my-app
spec:
containers:
- name: nginx
image: quay.io/security-profiles-operator/test-nginx:1.19.1
- name: redis
image: quay.io/security-profiles-operator/redis:6.2.1
```
If the pod is up and running:
```
> kubectl get pods
NAME READY STATUS RESTARTS AGE
my-pod 2/2 Running 0 18s
```
Then the enricher should indicate that it receives audit logs for those containers:
```
> kubectl -n security-profiles-operator logs --since=1m --selector name=spod log-enricher
…
I0705 12:08:18.729660 1843190 enricher.go:136] log-enricher "msg"="audit" "container"="redis" "executable"="/usr/local/bin/redis-server" "namespace"="default" "node"="127.0.0.1" "pid"=1847839 "pod"="my-pod" "syscallID"=232 "syscallName"="epoll_wait" "timestamp"="1625486870.273:187492" "type"="seccomp"
```
Now, if we remove the pod:
```
> kubectl delete pod my-pod
```
Then the operator will reconcile two seccomp profiles:
```
> kubectl get sp
NAME STATUS AGE
test-recording-nginx Installed 15s
test-recording-redis Installed 15s
```
Recording a SELinux profile would work the same, except you'd use `kind: SelinuxProfile`
in the `ProfileRecording` object.
Please note that log based recording does not have any effect if the recorded container
is privileged, that is, the container's security context sets `privileged: true`. This
is because privileged containers are not subject to SELinux or seccomp policies at all
and the log based recording makes use of a special seccomp or SELinux profile respectively
to record the syscalls or SELinux events.
#### eBPF based recording
The operator also supports an [eBPF](https://ebpf.io) based recorder. This
recorder only supports seccomp profiles for now. Recording via ebpf works for
kernels which expose the `/sys/kernel/btf/vmlinux` file per default as well as a
[custom list of selected Linux kernels](bpf-support.md). In addition, this
feature requires new library versions and thus might not be enabled. You
can find out if your SPO build has the eBPF feature disabled by looking at
the build tags:
```
> kubectl logs --selector name=security-profiles-operator | grep buildTags
```
If the output contains `no_bpf` then the feature has been disabled.
To use the recorder, enable it by patching the `spod` configuration:
```
> kubectl -n security-profiles-operator patch spod spod --type=merge -p '{"spec":{"enableBpfRecorder":true}}'
securityprofilesoperatordaemon.security-profiles-operator.x-k8s.io/spod patched
```
Alternatively, make sure the operator deployment sets the `ENABLE_BPF_RECORDER`
environment variable to `true`. This method can be easier to set up during
installation than patching the `spod`.
We can verify that the recorder is up and running after the spod rollout has
been finished:
```
> kubectl -n security-profiles-operator logs --selector name=spod -c bpf-recorder
Found 6 pods, using pod/spod-h7dpm
I1115 12:02:45.991786 110307 main.go:182] "msg"="Set logging verbosity to 0"
I1115 12:02:45.991901 110307 deleg.go:130] setup "msg"="starting component: bpf-recorder" "buildDate"="1980-01-01T00:00:00Z" "compiler"="gc" "gitCommit"="unknown" "gitTreeState"="clean" "goVersion"="go1.16.9" "libseccomp"="2.5.1" "platform"="linux/amd64" "version"="0.4.0-dev"
I1115 12:02:45.991955 110307 bpfrecorder.go:105] bpf-recorder "msg"="Setting up caches with expiry of 1h0m0s"
I1115 12:02:45.991973 110307 bpfrecorder.go:121] bpf-recorder "msg"="Starting log-enricher on node: ip-10-0-228-234.us-east-2.compute.internal"
I1115 12:02:45.994232 110307 bpfrecorder.go:152] bpf-recorder "msg"="Connecting to metrics server"
I1115 12:02:48.373469 110307 bpfrecorder.go:168] bpf-recorder "msg"="Got system mount namespace: 4026531840"
I1115 12:02:48.373518 110307 bpfrecorder.go:170] bpf-recorder "msg"="Doing BPF load/unload self-test"
I1115 12:02:48.373529 110307 bpfrecorder.go:336] bpf-recorder "msg"="Loading bpf module"
I1115 12:02:48.373570 110307 bpfrecorder.go:403] bpf-recorder "msg"="Using system btf file"
I1115 12:02:48.373770 110307 bpfrecorder.go:356] bpf-recorder "msg"="Loading bpf object from module"
I1115 12:02:48.403766 110307 bpfrecorder.go:362] bpf-recorder "msg"="Getting bpf program sys_enter"
I1115 12:02:48.403792 110307 bpfrecorder.go:368] bpf-recorder "msg"="Attaching bpf tracepoint"
I1115 12:02:48.406205 110307 bpfrecorder.go:373] bpf-recorder "msg"="Getting syscalls map"
I1115 12:02:48.406287 110307 bpfrecorder.go:379] bpf-recorder "msg"="Getting comms map"
I1115 12:02:48.406862 110307 bpfrecorder.go:396] bpf-recorder "msg"="Module successfully loaded, watching for events"
I1115 12:02:48.406908 110307 bpfrecorder.go:677] bpf-recorder "msg"="Unloading bpf module"
I1115 12:02:48.411636 110307 bpfrecorder.go:176] bpf-recorder "msg"="Starting GRPC API server"
```
The recorder does a system sanity check on startup to ensure everything works as
expected. This includes a `load` and `unload` of the BPF module. If this fails,
please open an issue so that we can find out what went wrong.
To record seccomp profiles by using the BPF recorder, create a
`ProfileRecording` which is using `recorder: bpf`:
```yaml
apiVersion: security-profiles-operator.x-k8s.io/v1alpha1
kind: ProfileRecording
metadata:
name: my-recording
spec:
kind: SeccompProfile
recorder: bpf
podSelector:
matchLabels:
app: my-app
```
Then we can create a workload to be recorded, for example this one:
```yaml
apiVersion: v1
kind: Pod
metadata:
name: my-pod
labels:
app: my-app
spec:
containers:
- name: nginx
image: quay.io/security-profiles-operator/test-nginx:1.19.1
```
If the pod is up and running:
```
> kubectl get pods
NAME READY STATUS RESTARTS AGE
my-pod 1/1 Running 0 10s
```
Then the BPF recorder should indicate that it found the container:
```
> kubectl -n security-profiles-operator logs --since=1m --selector name=spod -c log-enricher
…
I1115 12:12:30.029216 66106 bpfrecorder.go:654] bpf-recorder "msg"="Found container ID in cluster" "containerID"="c2e10af47011f6a61cd7e92073db2711796f174af35b34486967588ef7f95fbc" "containerName"="nginx"
I1115 12:12:30.029264 66106 bpfrecorder.go:539] bpf-recorder "msg"="Saving PID for profile" "mntns"=4026533352 "pid"=74384 "profile"="my-recording-nginx-1636978341"
I1115 12:12:30.029428 66106 bpfrecorder.go:512] bpf-recorder "msg"="Using short path via tracked mount namespace" "mntns"=4026533352 "pid"=74403 "profile"="my-recording-nginx-1636978341"
I1115 12:12:30.029575 66106 bpfrecorder.go:512] bpf-recorder "msg"="Using short path via tracked mount namespace" "mntns"=4026533352 "pid"=74402 "profile"="my-recording-nginx-1636978341"
…
```
Now, if we remove the pod:
```
> kubectl delete pod my-pod
```
Then the operator will reconcile the seccomp profile:
```
> kubectl get sp
NAME STATUS AGE
my-recording-nginx Installed 15s
```
#### Merging per-container profile instances
By default, each container instance will be recorded into a separate
profile. This is mostly visible when recording pods managed by a replicating
controller (Deployment, DaemonSet, etc.). A realistic example might
be a workload being recorded in a test environment where the recorded
Deployment consists of several replicas, only one of which is receiving
the test traffic. After the recording is complete, only the container that
was receiving the traffic would have container all the syscalls that were
actually used.
In this case, it might be useful to merge the per-container profiles
into a single profile. This can be done by setting the `mergeStrategy`
attribute to `containers` in the `ProfileRecording`. Note that the following
example uses a `SeccompProfile` as the `kind` but the same applies to
`SelinuxProfile` as well.
```yaml
apiVersion: security-profiles-operator.x-k8s.io/v1alpha1
kind: ProfileRecording
metadata:
# The name of the Recording is the same as the resulting `SeccompProfile` CRD
# after reconciliation.
name: test-recording
spec:
kind: SeccompProfile
recorder: logs
mergeStrategy: containers
podSelector:
matchLabels:
app: sp-record
```
Create your workload:
```yaml
apiVersion: apps/v1
kind: Deployment
metadata:
name: nginx-deploy
spec:
replicas: 3
selector:
matchLabels:
app: sp-record
template:
metadata:
labels:
app: sp-record
spec:
serviceAccountName: spo-record-sa
containers:
- name: nginx-record
image: quay.io/security-profiles-operator/test-nginx-unprivileged:1.21
ports:
- containerPort: 8080
```
You'll see that the deployment spawns three replicas. To test the merging feature, you
can perform an action in one of the pods, for example:
```bash
> kubectl exec nginx-deploy-65bcbb956f-gmbrj -- bash -c "mknod /tmp/foo p"
```
Note that this is a silly example, but shows the feature in action.
To record the individual profiles, delete the deployment:
```bash
> kubectl delete deployment nginx-deploy
```
The profiles will be reconciled, one per container. Note that the profiles are marked as
"partial" and the spod deamon instances do not reconcile the profiles.
```bash
> kubectl get sp -lspo.x-k8s.io/recording-id=test-recording --show-labels
NAME STATUS AGE LABELS
test-recording-nginx-record-gmbrj Partial 2m50s spo.x-k8s.io/container-id=sp-record,spo.x-k8s.io/partial=true,spo.x-k8s.io/profile-id=SeccompProfile-test-recording-sp-record-gmbrj,spo.x-k8s.io/recording-id=test-recording
test-recording-nginx-record-lclnb Partial 2m50s spo.x-k8s.io/container-id=sp-record,spo.x-k8s.io/partial=true,spo.x-k8s.io/profile-id=SeccompProfile-test-recording-sp-record-lclnb,spo.x-k8s.io/recording-id=test-recording
test-recording-nginx-record-wdv2r Partial 2m50s spo.x-k8s.io/container-id=sp-record,spo.x-k8s.io/partial=true,spo.x-k8s.io/profile-id=SeccompProfile-test-recording-sp-record-wdv2r,spo.x-k8s.io/recording-id=test-recording
```
Inspecting the first partial profile, which corresponds to the pod where we ran the extra command
shows that mknod is allowed:
```bash
> kubectl get sp test-recording-nginx-record-gmbrj -o yaml | grep mknod
- mknod
```
On the other hand the others do not:
```bash
> kubectl get sp test-recording-nginx-record-lclnb -o yaml | grep mknod
> kubectl get sp test-recording-nginx-record-wdv2r -o yaml | grep mknod
```
To merge the profiles, delete the profile recording to indicate that
you are finished with recording the workload. This would trigger the
merge operation done by the controller and the resulting profile will be
reconciled by the controller as seen from the `Installed` state:
```bash
> kubectl delete profilerecording test-recording
profilerecording.security-profiles-operator.x-k8s.io "test-recording" deleted
> kubectl get sp -lspo.x-k8s.io/recording-id=test-recording
NAME STATUS AGE
test-recording-nginx-record Installed 17m
```
The resulting profile will contain all the syscalls that were used by any of the containers,
including the `mknod` syscall:
```bash
> kubectl get sp test-recording-nginx-record -o yaml | grep mknod
- mknod
```
#### Disable profile recording
Profile recorder controller along with the corresponding sidecar container is disabled
when neither `enableBpfRecorder` nor `enableLogEnricher` is set in the SPOD configuration, and
automatically enabled when either one of them is on. The same applies when either
the BPF recorder of the log enricher are enabled using the environment variables
`ENABLE_BPF_RECORDER` or `ENABLE_LOG_ENRICHER` respectively.
Also, when running the daemon in standalone mode is possible to switch on the profile recorder
controller by providing the `with-recording` command line argument or setting the `ENABLE_RECORDING`
environment variable.
## Create a SELinux Profile
There are two kinds that can be used to define a SELinux profile - `SelinuxProfile` and `RawSelinuxProfile`.
The default one and the one created during workload recording is `SelinuxProfile`. It is more readable
and has several features that allow for better security hardening and better readability. The `RawSelinuxProfile`
kind should be used mostly when there's an already existing SELinux policy (perhaps created with udica)
that you wish to use in your cluster.
In particular, the `SelinuxProfile` kind:
- restricts the profiles to inherit from to the current namespace or a system-wide profile. Because there
are typically many profiles installed on the system, but only a subset should be used by cluster workloads,
the inheritable system profiles are listed in the `spod` instance in `spec.selinuxOptions.allowedSystemProfiles`.
Depending on what distribution your nodes run, the base profile might vary, on RHEL-based systems, you might
want to look at what profiles are shipped in the `container-selinux` RPM package.
- performs basic validation of the permissions, classes and labels
- adds a new keyword `@self` that describes the process using the policy. This allows to reuse a policy between
workloads and namespaces easily, as the "usage" of the policy (see below) is based on the name and namespace.
Below is an example of a policy that can be used with a non-privileged nginx workload:
```yaml
apiVersion: security-profiles-operator.x-k8s.io/v1alpha2
kind: SelinuxProfile
metadata:
name: nginx-secure
namespace: nginx-deploy
spec:
allow:
"@self":
tcp_socket:
- listen
http_cache_port_t:
tcp_socket:
- name_bind
node_t:
tcp_socket:
- node_bind
inherit:
- kind: System
name: container
```
After the policy is created, we can wait for selinuxd to install it:
```bash
$ kubectl wait --for=condition=ready selinuxprofile nginx-secure
selinuxprofile.security-profiles-operator.x-k8s.io/nginx-secure condition met
```
The CIL-formatted policies are placed into an `emptyDir` owned by the SPO where you can view
the resulting CIL policy:
```shell
$ kubectl exec -it -c selinuxd spod-fm55x -- sh
sh-4.4# cat /etc/selinux.d/nginx-secure_nginx-deploy.cil
(block nginx-secure_nginx-deploy
(blockinherit container)
(allow process nginx-secure_nginx-deploy.process ( tcp_socket ( listen )))
(allow process http_cache_port_t ( tcp_socket ( name_bind )))
(allow process node_t ( tcp_socket ( node_bind )))
)
```
However, the binary policies are installed into the system policy store on the nodes, so you can verify
that a policy has been installed:
```shell
# semodule -l | grep nginx-secure
```
### Apply a SELinux profile to a pod
SELinux profiles are referenced to based on their "usage" string:
```shell
kubectl get selinuxprofile.security-profiles-operator.x-k8s.io/nginx-secure -nnginx-deploy -ojsonpath='{.status.usage}'
nginx-secure_nginx-deploy.process%
```
Use this string in the workload manifest in the `.spec.containers[].securityContext.seLinuxOptions` attribute:
```yaml
apiVersion: v1
kind: Pod
metadata:
name: nginx-secure
namespace: nginx-deploy
spec:
containers:
- image: nginxinc/nginx-unprivileged:1.21
name: nginx
securityContext:
seLinuxOptions:
# NOTE: This uses an appropriate SELinux type
type: nginx-secure_nginx-deploy.process
```
Note that the SELinux type must exist before creating the workload.
### Make a SELinux profile permissive
Similarly to how a `SeccompProfile` might have a default action `SCMP_ACT_LOG`
which would merely log violations of the policy, but not actually block the
container from executing, a `SelinuxProfile` can be marked as "permissive"
by setting `.spec.permissive` to `true`. This mode might be useful e.g. when
the policy is known or suspected to be incomplete and you'd prefer to just
watch for subsequent AVC denials after deploying the policy.
### Record a SELinux profile
Please refer to the seccomp recording documentation, recording a SELinux
profile would work the same, except you'd use `kind: SelinuxProfile`. Note
that only the log enricher is capable of recording SELinux profiles.
## Restricting to a Single Namespace
The security-profiles-operator can optionally be run to watch SeccompProfiles in
a single namespace. This is advantageous because it allows for tightening the
RBAC permissions required by the operator's ServiceAccount. To modify the
operator deployment to run in a single namespace, use the
`namespace-operator.yaml` manifest with your namespace of choice:
### Restricting to a Single Namespace with upstream deployment manifests
```sh
NAMESPACE=
curl https://raw.githubusercontent.com/kubernetes-sigs/security-profiles-operator/main/deploy/namespace-operator.yaml | sed "s/NS_REPLACE/$NAMESPACE/g" | kubectl apply -f -
```
### Restricting to a Single Namespace when installing using OLM
Since restricting the operator to a single namespace amounts to setting the `RESTRICT_TO_NAMESPACE`
environment variable, the easiest way to set that (or any other variable for SPO) is by editing the
`Subscription` object and setting the `spec.config.env` field:
```yaml
spec:
config:
env:
- name: RESTRICT_TO_NAMESPACE
value:
```
OLM would then take care of updating the operator `Deployment` object with the new environment variable.
Please refer to the [OLM documentation](https://github.com/operator-framework/operator-lifecycle-manager/blob/master/doc/design/subscription-config.md#res)
for more details on tuning the operator's configuration with the `Subscription` objects.
## Using metrics
The security-profiles-operator provides two metrics endpoints, which are secured
by a [kube-rbac-proxy](https://github.com/brancz/kube-rbac-proxy) sidecar
container. All metrics are exposd via the `metrics` service within the
`security-profiles-operator` namespace:
```
> kubectl get svc/metrics -n security-profiles-operator
NAME TYPE CLUSTER-IP EXTERNAL-IP PORT(S) AGE
metrics ClusterIP 10.0.0.228 443/TCP 43s
```
The operator ships a cluster role and corresponding binding `spo-metrics-client`
to retrieve the metrics from within the cluster. There are two metrics paths
available:
- `metrics.security-profiles-operator/metrics`: for controller runtime metrics
- `metrics.security-profiles-operator/metrics-spod`: for the operator daemon metrics
To retrieve the metrics, just query the service endpoint by using the default
serviceaccount token in the `security-profiles-operator` namespace:
```
> kubectl run --rm -i --restart=Never --image=registry.fedoraproject.org/fedora-minimal:latest \
-n security-profiles-operator metrics-test -- bash -c \
'curl -ks -H "Authorization: Bearer $(cat /var/run/secrets/kubernetes.io/serviceaccount/token)" https://metrics.security-profiles-operator/metrics-spod'
…
# HELP security_profiles_operator_seccomp_profile_total Counter about seccomp profile operations.
# TYPE security_profiles_operator_seccomp_profile_total counter
security_profiles_operator_seccomp_profile_total{operation="delete"} 1
security_profiles_operator_seccomp_profile_total{operation="update"} 2
…
```
If the metrics have to be retrieved from a different namespace, just link the
service account to the `spo-metrics-client` `ClusterRoleBinding` or create a new
one:
```
> kubectl get clusterrolebinding spo-metrics-client -o wide
NAME ROLE AGE USERS GROUPS SERVICEACCOUNTS
spo-metrics-client ClusterRole/spo-metrics-client 35m security-profiles-operator/default
```
Every metrics server pod from the DaemonSet runs with the same set of certificates
(secret `metrics-server-cert`: `tls.crt` and `tls.key`) in the
`security-profiles-operator` namespace. This means a pod like this can be used
to omit the `--insecure/-k` flag:
```yaml
---
apiVersion: v1
kind: Pod
metadata:
name: test-pod
spec:
containers:
- name: test-container
image: registry.fedoraproject.org/fedora-minimal:latest
command:
- bash
- -c
- |
curl -s --cacert /var/run/secrets/metrics/ca.crt \
-H "Authorization: Bearer $(cat /var/run/secrets/kubernetes.io/serviceaccount/token)" \
https://metrics.security-profiles-operator/metrics-spod
volumeMounts:
- mountPath: /var/run/secrets/metrics
name: metrics-cert-volume
readOnly: true
restartPolicy: Never
volumes:
- name: metrics-cert-volume
secret:
defaultMode: 420
secretName: metrics-server-cert
```
### Available metrics
The controller-runtime (`/metrics`) as well as the DaemonSet endpoint
(`/metrics-spod`) already provide a set of default metrics. Beside that, those
additional metrics are provided by the daemon, which are always prefixed with
`security_profiles_operator_`:
| Metric Key | Possible Labels | Type | Purpose |
| ----------------------------- | ---------------------------------------------------------------------------------------------------------------------------------------------------------------------------------------------------------- | ------- | ------------------------------------------------------------------------------------ |
| `seccomp_profile_total` | `operation={delete,update}` | Counter | Amount of seccomp profile operations. |
| `seccomp_profile_audit_total` | `node`, `namespace`, `pod`, `container`, `executable`, `syscall` | Counter | Amount of seccomp profile audit operations. Requires the log-enricher to be enabled. |
| `seccomp_profile_bpf_total` | `node`, `mount_namespace`, `profile` | Counter | Amount of seccomp profile bpf operations. Requires the bpf-recorder to be enabled. |
| `seccomp_profile_error_total` | `reason={`
`SeccompNotSupportedOnNode,`
`InvalidSeccompProfile,`
`CannotSaveSeccompProfile,`
`CannotRemoveSeccompProfile,`
`CannotUpdateSeccompProfile,`
`CannotUpdateNodeStatus`
`}` | Counter | Amount of seccomp profile errors. |
| `selinux_profile_total` | `operation={delete,update}` | Counter | Amount of selinux profile operations. |
| `selinux_profile_audit_total` | `node`, `namespace`, `pod`, `container`, `executable`, `scontext`,`tcontext` | Counter | Amount of selinux profile audit operations. Requires the log-enricher to be enabled. |
| `selinux_profile_error_total` | `reason={`
`CannotSaveSelinuxPolicy,`
`CannotUpdatePolicyStatus,`
`CannotRemoveSelinuxPolicy,`
`CannotContactSelinuxd,`
`CannotWritePolicyFile,`
`CannotGetPolicyStatus`
`}` | Counter | Amount of selinux profile errors. |
### Automatic ServiceMonitor deployment
If the Kubernetes cluster has the [Prometheus
Operator](https://github.com/prometheus-operator/prometheus-operator) deployed,
then the Security Profiles Operator will automatically create a `ServiceMonitor`
resource within its namespace. This monitor allows automatic metrics discovery
within the cluster, which is pointing to the right service, TLS certificates as
well as bearer token secret.
When running on OpenShift and deploying upstream manifests or upstream OLM
bundles, then the only configuration to be done is enabling user workloads
by applying the following config map:
```yaml
apiVersion: v1
kind: ConfigMap
metadata:
name: cluster-monitoring-config
namespace: openshift-monitoring
data:
config.yaml: |
enableUserWorkload: true
```
Note that the above is not needed when deploying the Security Profiles Operator
on OpenShift from the Red Hat catalog, in that case, the Security Profiles
Operator should be auto-configured and Prometheus should be able to scrape
metrics automatically.
After that, the Security Profiles Operator can be deployed or updated, which
will reconcile the `ServiceMonitor` into the cluster:
```
> kubectl -n security-profiles-operator logs security-profiles-operator-d7c8cfc86-47qh2 | grep monitor
I0520 09:29:35.578165 1 spod_controller.go:282] spod-config "msg"="Deploying operator service monitor"
```
```
> kubectl -n security-profiles-operator get servicemonitor
NAME AGE
security-profiles-operator-monitor 35m
```
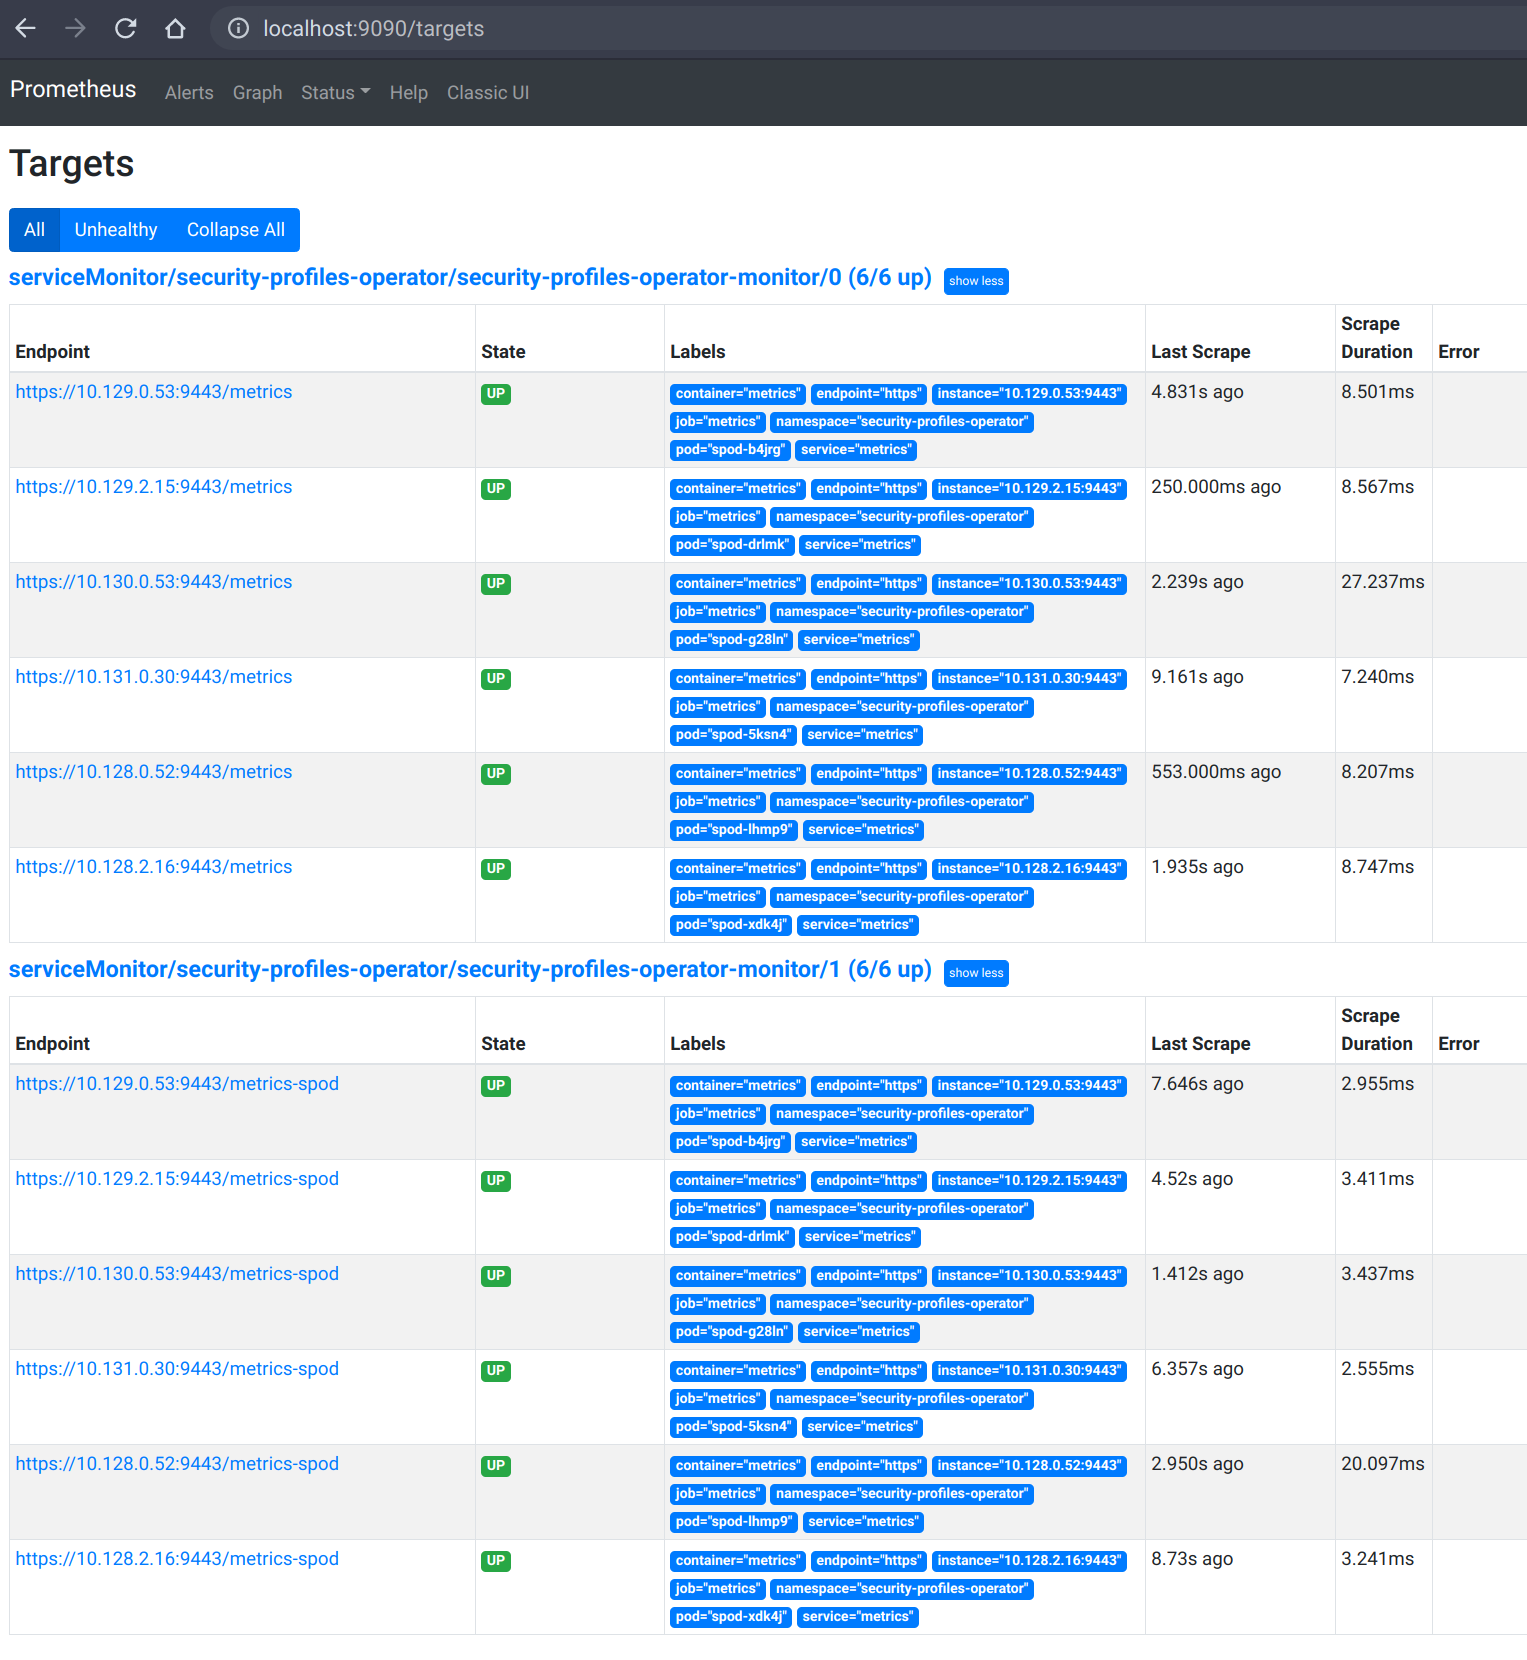
We can now verify in the Prometheus targets that all endpoints are serving the
metrics:
```
> kubectl port-forward -n openshift-user-workload-monitoring pod/prometheus-user-workload-0 9090
Forwarding from 127.0.0.1:9090 -> 9090
Forwarding from [::1]:9090 -> 9090
```
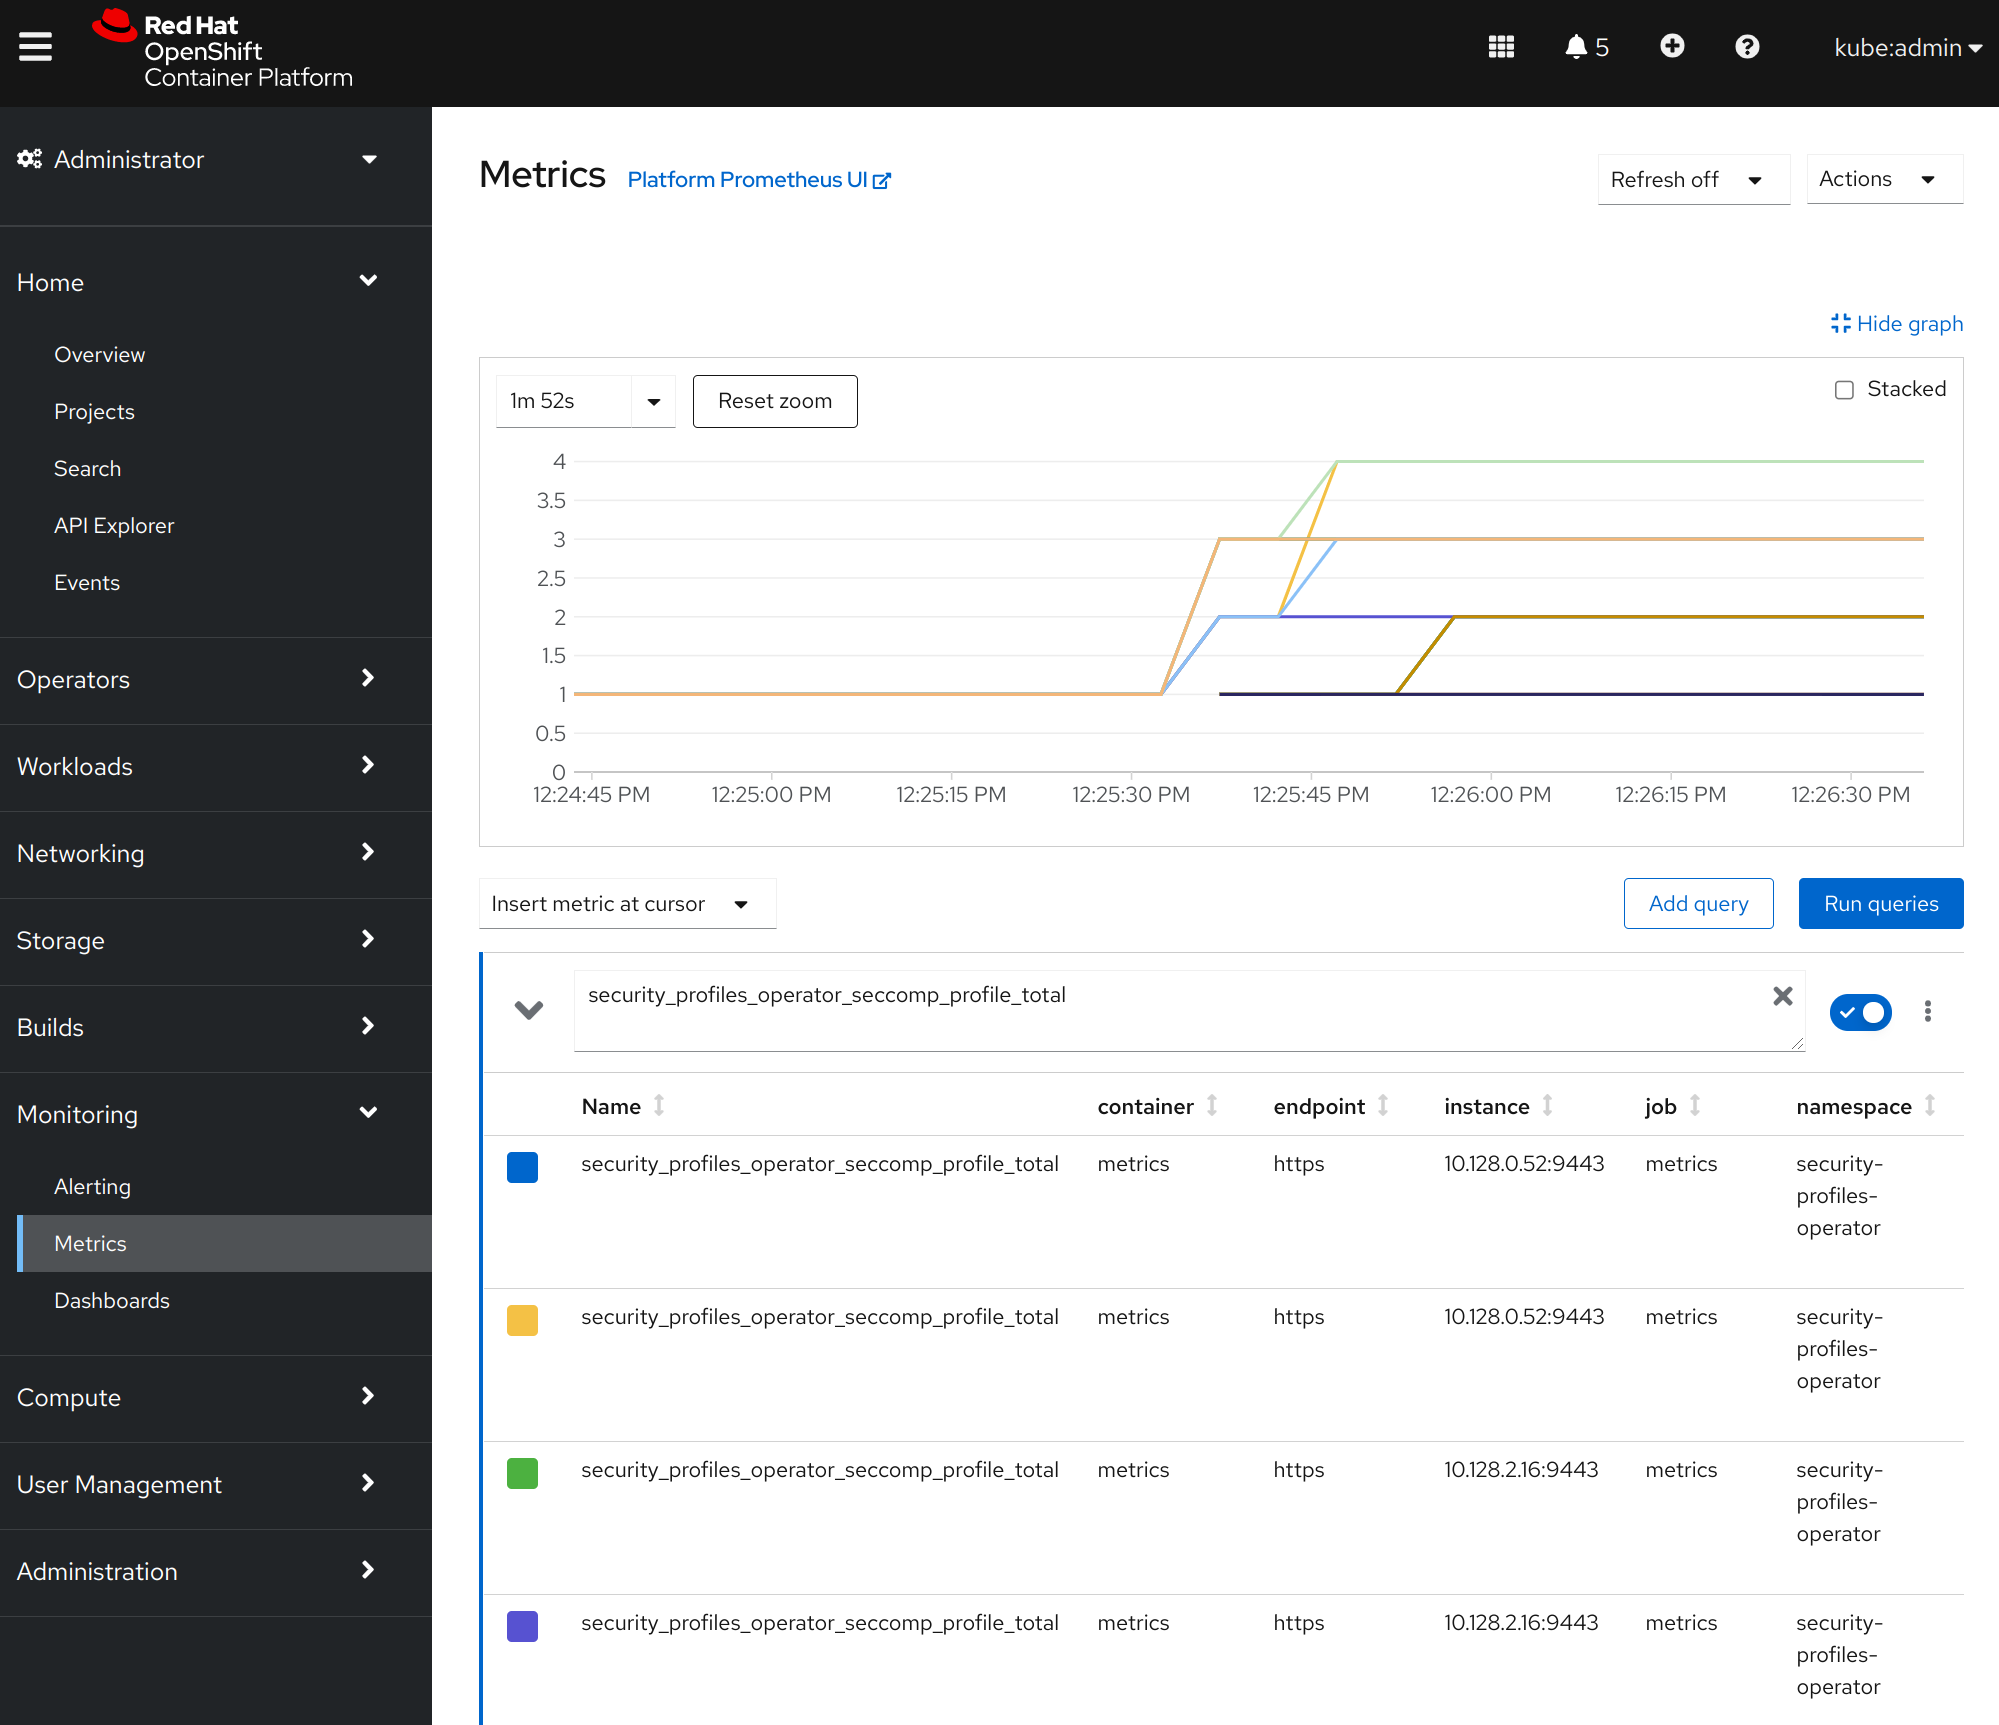
The OpenShift UI is now able to display the operator metrics, too:
## Using the log enricher
The operator ships with a log enrichment feature, which is disabled per
default. The reason for that is that the log enricher container runs in
privileged mode to be able to read the audit logs from the local node. It is also
required that the enricher is able to read the host processes and therefore runs
within host PID namespace (`hostPID`).
One of the following requirements to the Kubernetes node have to be fulfilled to
use the log enrichment feature:
- [auditd][auditd] needs to run and has to be configured to log into
`/var/log/audit/audit.log`
- [syslog][syslog] can be used as fallback to auditd and needs to log into
`/var/log/syslog`. Depending on the system configuration, a printk rate limiting may be
in place which has direct influence on the log enrichment. To diable the rate
limiting, set the following sysctls:
```
> sysctl -w kernel.printk_ratelimit=0
> sysctl -w kernel.printk_ratelimit_burst=0
```
[auditd]: https://man7.org/linux/man-pages/man8/auditd.8.html
[syslog]: https://man7.org/linux/man-pages/man3/syslog.3.html
If all requirements are met, then the feature can be enabled by patching the
`spod` configuration:
```
> kubectl -n security-profiles-operator patch spod spod --type=merge -p '{"spec":{"enableLogEnricher":true}}'
securityprofilesoperatordaemon.security-profiles-operator.x-k8s.io/spod patched
```
Alternatively, make sure the operator deployment sets the `ENABLE_LOG_ENRICHER` variable,
to `true`, either by setting the environment variable in the deployment or by enabling
the variable trough a `Subscription` resource, when installing the operator using OLM
(see [Restricting the operator to specific nodes](#restricting-the-operator-to-specific-nodes)
for an example of setting another variable).
Now the operator will take care of re-deploying the `spod` DaemonSet and the
enricher should listening on new changes to the audit logs:
```
> kubectl -n security-profiles-operator logs -f ds/spod log-enricher
I0623 12:51:04.257814 1854764 deleg.go:130] setup "msg"="starting component: log-enricher" "buildDate"="1980-01-01T00:00:00Z" "compiler"="gc" "gitCommit"="unknown" "gitTreeState"="clean" "goVersion"="go1.16.2" "platform"="linux/amd64" "version"="0.4.0-dev"
I0623 12:51:04.257890 1854764 enricher.go:44] log-enricher "msg"="Starting log-enricher on node: 127.0.0.1"
I0623 12:51:04.257898 1854764 enricher.go:46] log-enricher "msg"="Connecting to local GRPC server"
I0623 12:51:04.258061 1854764 enricher.go:69] log-enricher "msg"="Reading from file /var/log/audit/audit.log"
2021/06/23 12:51:04 Seeked /var/log/audit/audit.log - &{Offset:0 Whence:2}
```
To be able to trace an application, we have to create a logging profile like this:
```yaml
apiVersion: security-profiles-operator.x-k8s.io/v1beta1
kind: SeccompProfile
metadata:
name: log
namespace: default
spec:
defaultAction: SCMP_ACT_LOG
```
After the profile has been created, a corresponding workload can be started to
use the profile:
```yaml
apiVersion: v1
kind: Pod
metadata:
name: log-pod
spec:
securityContext:
seccompProfile:
type: Localhost
localhostProfile: operator/default/log.json
containers:
- name: log-container
image: nginx
```
If the pod is running, then we can examine the log enricher output:
```
> kubectl -n security-profiles-operator logs -f ds/spod log-enricher
…
I0623 12:59:10.220291 1854764 container.go:77] log-enricher "msg"="container ID is still empty, retrying" "containerName"="log-container"
I0623 12:59:10.724938 1854764 container.go:77] log-enricher "msg"="container ID is still empty, retrying" "containerName"="log-container"
I0623 12:59:11.479869 1854764 enricher.go:111] log-enricher "msg"="audit" "container"="log-container" "executable"="/" "namespace"="default" "node"="127.0.0.1" "pid"=1905792 "pod"="log-pod" "syscallID"=3 "syscallName"="close" "timestamp"="1624453150.205:1061" "type"="seccomp"
I0623 12:59:11.487323 1854764 enricher.go:111] log-enricher "msg"="audit" "container"="log-container" "executable"="/" "namespace"="default" "node"="127.0.0.1" "pid"=1905792 "pod"="log-pod" "syscallID"=157 "syscallName"="prctl" "timestamp"="1624453150.205:1062" "type"="seccomp"
I0623 12:59:11.492157 1854764 enricher.go:111] log-enricher "msg"="audit" "container"="log-container" "executable"="/" "namespace"="default" "node"="127.0.0.1" "pid"=1905792 "pod"="log-pod" "syscallID"=157 "syscallName"="prctl" "timestamp"="1624453150.205:1063" "type"="seccomp"
…
I0623 12:59:20.258523 1854764 enricher.go:111] log-enricher "msg"="audit" "container"="log-container" "executable"="/usr/sbin/nginx" "namespace"="default" "node"="127.0.0.1" "pid"=1905792 "pod"="log-pod" "syscallID"=12 "syscallName"="brk" "timestamp"="1624453150.235:2873" "type"="seccomp"
I0623 12:59:20.263349 1854764 enricher.go:111] log-enricher "msg"="audit" "container"="log-container" "executable"="/usr/sbin/nginx" "namespace"="default" "node"="127.0.0.1" "pid"=1905792 "pod"="log-pod" "syscallID"=21 "syscallName"="access" "timestamp"="1624453150.235:2874" "type"="seccomp"
I0623 12:59:20.354091 1854764 enricher.go:111] log-enricher "msg"="audit" "container"="log-container" "executable"="/usr/sbin/nginx" "namespace"="default" "node"="127.0.0.1" "pid"=1905792 "pod"="log-pod" "syscallID"=257 "syscallName"="openat" "timestamp"="1624453150.235:2875" "type"="seccomp"
I0623 12:59:20.358844 1854764 enricher.go:111] log-enricher "msg"="audit" "container"="log-container" "executable"="/usr/sbin/nginx" "namespace"="default" "node"="127.0.0.1" "pid"=1905792 "pod"="log-pod" "syscallID"=5 "syscallName"="fstat" "timestamp"="1624453150.235:2876" "type"="seccomp"
I0623 12:59:20.363510 1854764 enricher.go:111] log-enricher "msg"="audit" "container"="log-container" "executable"="/usr/sbin/nginx" "namespace"="default" "node"="127.0.0.1" "pid"=1905792 "pod"="log-pod" "syscallID"=9 "syscallName"="mmap" "timestamp"="1624453150.235:2877" "type"="seccomp"
I0623 12:59:20.454127 1854764 enricher.go:111] log-enricher "msg"="audit" "container"="log-container" "executable"="/usr/sbin/nginx" "namespace"="default" "node"="127.0.0.1" "pid"=1905792 "pod"="log-pod" "syscallID"=3 "syscallName"="close" "timestamp"="1624453150.235:2878" "type"="seccomp"
I0623 12:59:20.458654 1854764 enricher.go:111] log-enricher "msg"="audit" "container"="log-container" "executable"="/usr/sbin/nginx" "namespace"="default" "node"="127.0.0.1" "pid"=1905792 "pod"="log-pod" "syscallID"=257 "syscallName"="openat" "timestamp"="1624453150.235:2879" "type"="seccomp"
…
```
The startup of the nginx container already invokes a huge amount of syscalls, which
are now all available within a human readable way within the log enricher.
The metrics endpoint of the Security Profiles Operator can be used to examine
the log enricher data in a more structured way. This means that each syscall
invocation will create a new metric entry
`security_profiles_operator_seccomp_profile_audit_total` containing the
corresponding metadata as labels:
```
# HELP security_profiles_operator_seccomp_profile_audit_total Counter about seccomp profile audits, requires the log enricher to be enabled.
# TYPE security_profiles_operator_seccomp_profile_audit_total counter
security_profiles_operator_seccomp_profile_audit_total{container="log-container",executable="/usr/sbin/nginx",namespace="default",node="127.0.0.1",pod="log-pod",syscall="access"} 1
security_profiles_operator_seccomp_profile_audit_total{container="log-container",executable="/usr/sbin/nginx",namespace="default",node="127.0.0.1",pod="log-pod",syscall="arch_prctl"} 1
security_profiles_operator_seccomp_profile_audit_total{container="log-container",executable="/usr/sbin/nginx",namespace="default",node="127.0.0.1",pod="log-pod",syscall="bind"} 2
security_profiles_operator_seccomp_profile_audit_total{container="log-container",executable="/usr/sbin/nginx",namespace="default",node="127.0.0.1",pod="log-pod",syscall="brk"} 18
security_profiles_operator_seccomp_profile_audit_total{container="log-container",executable="/usr/sbin/nginx",namespace="default",node="127.0.0.1",pod="log-pod",syscall="close"} 154
security_profiles_operator_seccomp_profile_audit_total{container="log-container",executable="/usr/sbin/nginx",namespace="default",node="127.0.0.1",pod="log-pod",syscall="pread64"} 4
security_profiles_operator_seccomp_profile_audit_total{container="log-container",executable="/usr/sbin/nginx",namespace="default",node="127.0.0.1",pod="log-pod",syscall="prlimit64"} 3
security_profiles_operator_seccomp_profile_audit_total{container="log-container",executable="/usr/sbin/nginx",namespace="default",node="127.0.0.1",pod="log-pod",syscall="pwrite64"} 1
security_profiles_operator_seccomp_profile_audit_total{container="log-container",executable="/usr/sbin/nginx",namespace="default",node="127.0.0.1",pod="log-pod",syscall="recvmsg"} 120
security_profiles_operator_seccomp_profile_audit_total{container="log-container",executable="/usr/sbin/nginx",namespace="default",node="127.0.0.1",pod="log-pod",syscall="rt_sigaction"} 14
security_profiles_operator_seccomp_profile_audit_total{container="log-container",executable="/usr/sbin/nginx",namespace="default",node="127.0.0.1",pod="log-pod",syscall="rt_sigprocmask"} 14
security_profiles_operator_seccomp_profile_audit_total{container="log-container",executable="/usr/sbin/nginx",namespace="default",node="127.0.0.1",pod="log-pod",syscall="rt_sigsuspend"} 1
security_profiles_operator_seccomp_profile_audit_total{container="log-container",executable="/usr/sbin/nginx",namespace="default",node="127.0.0.1",pod="log-pod",syscall="sendmsg"} 68
security_profiles_operator_seccomp_profile_audit_total{container="log-container",executable="/usr/sbin/nginx",namespace="default",node="127.0.0.1",pod="log-pod",syscall="set_robust_list"} 13
security_profiles_operator_seccomp_profile_audit_total{container="log-container",executable="/usr/sbin/nginx",namespace="default",node="127.0.0.1",pod="log-pod",syscall="set_tid_address"} 1
security_profiles_operator_seccomp_profile_audit_total{container="log-container",executable="/usr/sbin/nginx",namespace="default",node="127.0.0.1",pod="log-pod",syscall="setgid"} 12
security_profiles_operator_seccomp_profile_audit_total{container="log-container",executable="/usr/sbin/nginx",namespace="default",node="127.0.0.1",pod="log-pod",syscall="setgroups"} 12
security_profiles_operator_seccomp_profile_audit_total{container="log-container",executable="/usr/sbin/nginx",namespace="default",node="127.0.0.1",pod="log-pod",syscall="setsockopt"} 3
security_profiles_operator_seccomp_profile_audit_total{container="log-container",executable="/usr/sbin/nginx",namespace="default",node="127.0.0.1",pod="log-pod",syscall="setuid"} 12
security_profiles_operator_seccomp_profile_audit_total{container="log-container",executable="/usr/sbin/nginx",namespace="default",node="127.0.0.1",pod="log-pod",syscall="socket"} 6
security_profiles_operator_seccomp_profile_audit_total{container="log-container",executable="/usr/sbin/nginx",namespace="default",node="127.0.0.1",pod="log-pod",syscall="socketpair"} 24
security_profiles_operator_seccomp_profile_audit_total{container="log-container",executable="/usr/sbin/nginx",namespace="default",node="127.0.0.1",pod="log-pod",syscall="stat"} 6
security_profiles_operator_seccomp_profile_audit_total{container="log-container",executable="/usr/sbin/nginx",namespace="default",node="127.0.0.1",pod="log-pod",syscall="sysinfo"} 1
security_profiles_operator_seccomp_profile_audit_total{container="log-container",executable="/usr/sbin/nginx",namespace="default",node="127.0.0.1",pod="log-pod",syscall="uname"} 2
security_profiles_operator_seccomp_profile_audit_total{container="log-container",executable="/usr/sbin/nginx",namespace="default",node="127.0.0.1",pod="log-pod",syscall="write"} 20
```
## Configuring webhooks
Both profile binding and profile recording make use of webhooks. Their configuration (an instance of
`MutatingWebhookConfiguration` CR) is managed by SPO itself and not part of the deployed YAML manifests.
While the defaults should be acceptable for the majority of users and the webhooks do nothing unless an
instance of either `ProfileBinding` or `ProfileRecording` exists in a namespace and in addition the
namespace must be labeled with either `spo.x-k8s.io/enable-binding` or `spo.x-k8s.io/enable-recording`
respectively by default, it might still be useful to configure the webhooks.
In order to change webhook's configuration, the `spod` CR exposes an object
`webhookOptions` that allows the `failurePolicy`, `namespaceSelector`
and `objectSelector` to be set. This way you can set the webhooks to
"soft-fail" or restrict them to a subset of a namespaces and inside those namespaces
select only a subset of object matching the `objectSelector` so that even
if the webhooks had a bug that would prevent them from running at all,
other namespaces or resources wouldn't be affected.
For example, to set the `binding.spo.io` webhook's configuration to ignore errors as well as restrict it
to a subset of namespaces labeled with `spo.x-k8s.io/bind-here=true`, create a following patch file:
```yaml
spec:
webhookOptions:
- name: binding.spo.io
failurePolicy: Ignore
namespaceSelector:
matchExpressions:
- key: spo.x-k8s.io/bind-here
operator: In
values:
- "true"
```
And patch the `spod/spod` instance:
```shell
$ kubectl -nsecurity-profiles-operator patch spod spod -p $(cat /tmp/spod-wh.patch) --type=merge
```
To view the resulting `MutatingWebhookConfiguration`, call:
```shell
$ kubectl get MutatingWebhookConfiguration spo-mutating-webhook-configuration -oyaml
```
## Troubleshooting
Confirm that the profile is being reconciled:
```sh
$ kubectl -n security-profiles-operator logs security-profiles-operator-mzw9t
I1019 19:34:14.942464 1 main.go:90] setup "msg"="starting security-profiles-operator" "buildDate"="2020-10-19T19:31:24Z" "compiler"="gc" "gitCommit"="a3ef0e1ea6405092268c18f240b62015c247dd9d" "gitTreeState"="dirty" "goVersion"="go1.15.1" "platform"="linux/amd64" "version"="0.2.0-dev"
I1019 19:34:15.348389 1 listener.go:44] controller-runtime/metrics "msg"="metrics server is starting to listen" "addr"=":8080"
I1019 19:34:15.349076 1 main.go:126] setup "msg"="starting manager"
I1019 19:34:15.349449 1 internal.go:391] controller-runtime/manager "msg"="starting metrics server" "path"="/metrics"
I1019 19:34:15.350201 1 controller.go:142] controller "msg"="Starting EventSource" "controller"="profile" "reconcilerGroup"="security-profiles-operator.x-k8s.io" "reconcilerKind"="SeccompProfile" "source"={"Type":{"metadata":{"creationTimestamp":null},"spec":{"defaultAction":""}}}
I1019 19:34:15.450674 1 controller.go:149] controller "msg"="Starting Controller" "controller"="profile" "reconcilerGroup"="security-profiles-operator.x-k8s.io" "reconcilerKind"="SeccompProfile"
I1019 19:34:15.450757 1 controller.go:176] controller "msg"="Starting workers" "controller"="profile" "reconcilerGroup"="security-profiles-operator.x-k8s.io" "reconcilerKind"="SeccompProfile" "worker count"=1
I1019 19:34:15.453102 1 profile.go:148] profile "msg"="Reconciled profile from SeccompProfile" "namespace"="security-profiles-operator" "profile"="nginx-1.19.1" "name"="nginx-1.19.1" "resource version"="728"
I1019 19:34:15.453618 1 profile.go:148] profile "msg"="Reconciled profile from SeccompProfile" "namespace"="security-profiles-operator" "profile"="security-profiles-operator" "name"="security-profiles-operator" "resource version"="729"
```
Confirm that the seccomp profiles are saved into the correct path:
```sh
$ kubectl exec -t -n security-profiles-operator security-profiles-operator-v6p2h -- ls /var/lib/kubelet/seccomp/operator/my-namespace/my-workload
profile-block.json
profile-complain.json
```
Please note corrupted seccomp profiles can disrupt your workloads. Therefore, ensure that the user used cannot be abused by:
- Not creating that user on the actual node.
- Restricting the user ID to only security-profiles-operator (i.e. using PSP).
- Not allowing other workloads to map any part of the path `/var/lib/kubelet/seccomp/operator`.
### Enable CPU and memory profiling
It is possible to enable the CPU and memory profiling endpoints for debugging
purposes. To be able to utilize the profiling support, patch the spod config by
adjusting the `enableProfiling` value:
```
> kubectl -n security-profiles-operator patch spod spod --type=merge -p '{"spec":{"enableProfiling":true}}'
securityprofilesoperatordaemon.security-profiles-operator.x-k8s.io/spod patched
```
The containers of the daemon should now indicate that it's serving the profiling
endpoint, where every container is using a different port:
```
> k logs --selector name=spod -c security-profiles-operator | grep "Starting profiling"
I1202 15:14:40.276363 2185724 main.go:226] "msg"="Starting profiling server" "endpoint"="localhost:6060"
> k logs --selector name=spod -c log-enricher | grep "Starting profiling"
I1202 15:14:40.364046 2185814 main.go:226] "msg"="Starting profiling server" "endpoint"="localhost:6061"
> k logs --selector name=spod -c bpf-recorder | grep "Starting profiling"
I1202 15:14:40.457506 2185914 main.go:226] "msg"="Starting profiling server" "endpoint"="localhost:6062"
```
Then use the pprof tool to look at the heap profile:
```
> go tool pprof http://$PODIP:6060/debug/pprof/heap
```
Or to look at a 30-second CPU profile:
```
go tool pprof http://$PODIP:6060/debug/pprof/profile?seconds=30
```
Note that selinuxd, if enabled, doesn't set up a HTTP listener, but only
listens on a UNIX socket shared between selinuxd and the `spod` DS pod.
Nonetheless, this socket can be used to reach the profiling enpoint as
well:
```
kubectl exec spod-4pt84 -c selinuxd -- curl --unix-socket /var/run/selinuxd/selinuxd.sock http://localhost/debug/pprof/heap --output - > /tmp/heap.selinuxd
go tool pprof /tmp/heap.selinuxd
```
For a study of the facility in action, please visit:
https://blog.golang.org/2011/06/profiling-go-programs.html
### Use a custom `/proc` location for nested environments like `kind`
The operator configuration supports specifying a custom `/proc` location, which
is required for the container ID retrieval of the log-enricher as well as the
bpf-recorder. To use a custom path for `/proc`, just patch the spod accordingly:
```
kubectl patch spod spod --type=merge -p '{"spec":{"hostProcVolumePath":"/my-proc"}}'
```
## Notes on OpenShift and SCCs
There are several things particular to OpenShift that are useful to be aware of when
deploying and recording security profiles, mostly coming from OpenShift's default use
of SCCs.
### SELinux recording should allow `seLinuxContext: RunAsAny`
Recording of SELinux policies is implemented with a webhook that injects a special SELinux
type to the pods being recorded. This type makes the pod run in "permissive" mode, logging
all the AVC denials into `audit.log`. By default, especially with the more restrictive SCCs,
a workload is not allowed to run with a custom SELinux policy, but uses an autogenerated type.
Therefore in order to record a workload, the workload must use a service account that is allowed
to use an SCC that allows the webhook to inject this permissive type into it. This can be achieved
by using any SCC that uses `seLinuxContext: RunAsAny`, including the `privileged` SCC shipped
by default with OpenShift.
In addition, the namespace must be labeled with
`pod-security.kubernetes.io/enforce: privileged` if your cluster enables the
[Pod Security Admission](https://kubernetes.io/docs/concepts/security/pod-security-admission/)
because only the `privileged`
[Pod Security Standard](https://kubernetes.io/docs/concepts/security/pod-security-standards/#privileged)
allows running with a custom SELinux policy. In contrast, even the `restricted` Pod Security Standard
allows the use of `Localhost` seccomp profiles.
### Replicating controllers and SCCs
When deploying SELinux policies for replicating controllers (deployments,
daemonsets, ...), note that the pods that these controllers spawn are not running with the identity
of the user who creates the workload. Unless a `ServiceAccount` is selected, this means that the pods
might fall back to using one of the secure but restricted SCCs which don't allow to use a custom SELinux
policy.
One option is to use an SCC with `seLinuxContext: RunAsAny`, but it's
more secure to only restrict your workloads to the security profiles they should be using.
Taking the SELinux policy we recorded earlier for an nginx deployment as an
example, we might create the following SCC which is based on the `restricted`
SCC shipped in OpenShift, just allows our SELinux policy to be used.
Note that we'll be deploying in the `nginx-secure` namespace, as you can
see from the ServiceAccount name we are putting into the `users` array.
```yaml
apiVersion: security.openshift.io/v1
kind: SecurityContextConstraints
metadata:
annotations:
kubernetes.io/description: A special SCC for running nginx with a custom SELinux policy
name: nginx-secure
allowHostIPC: false
allowHostNetwork: false
allowHostPID: false
allowHostPorts: false
allowPrivilegeEscalation: true
allowPrivilegedContainer: false
allowedCapabilities: null
defaultAddCapabilities: null
fsGroup:
type: MustRunAs
priority: null
readOnlyRootFilesystem: false
requiredDropCapabilities:
- KILL
- MKNOD
- SETUID
- SETGID
runAsUser:
type: MustRunAsRange
seLinuxContext:
type: MustRunAs
seLinuxOptions:
type: test-selinux-recording-nginx-0_nginx-secure.process
supplementalGroups:
type: RunAsAny
users:
- system:serviceaccount:nginx-secure:nginx-sa
volumes:
- configMap
- downwardAPI
- emptyDir
- persistentVolumeClaim
- projected
- secret
```
Please note that a common mistake when creating custom SCCs is to bind them to a wide range of users or SAs
through the `group` attribute, e.g. the `system:authenticated` group. Make sure your SCC is only usable by
the serviceAccount it is supposed to be used by. Please refer to the [OCP documentation](https://docs.openshift.com/container-platform/4.9/authentication/managing-security-context-constraints.html)
or [this Red Hat blog post](https://cloud.redhat.com/blog/managing-sccs-in-openshift) for more information
on managing SCCs.
Then we create the appropriate role:
```yaml
apiVersion: rbac.authorization.k8s.io/v1
kind: Role
metadata:
name: nginx
namespace: nginx-secure
rules:
- apiGroups:
- security.openshift.io
resources:
- securitycontextconstraints
resourceNames:
- nginx-secure
verbs:
- use
```
and finally a role binding and the SA.
With all that set up, we can finally create our deployment:
```yaml
apiVersion: apps/v1
kind: Deployment
metadata:
name: my-deployment
spec:
selector:
matchLabels:
app: nginx
replicas: 2
template:
metadata:
labels:
app: nginx
spec:
serviceAccountName: nginx-sa
containers:
- name: nginx
image: nginxinc/nginx-unprivileged:1.21
```
Note that we don't specify the SELinux type at all in the workload, that's handled by the SCC instead.
When the pods are created through the deployment and its `ReplicaSet`, they should be
running with the appropriate profile.
## Create an AppArmor profile
Ensure that the Daemon has AppArmor enabled:
```
> kubectl -n security-profiles-operator patch spod spod --type=merge -p '{"spec":{"apparmorenabled":"true"}}'
securityprofilesoperatordaemon.security-profiles-operator.x-k8s.io/spod patched
```
Use the `AppArmorProfile` kind to create AppArmor profiles. Example:
```yaml
---
apiVersion: security-profiles-operator.x-k8s.io/v1alpha1
kind: AppArmorProfile
metadata:
name: test-profile
annotations:
description: Block writing to any files in the disk.
spec:
policy: |
#include
profile test-profile flags=(attach_disconnected) {
#include
file,
# Deny all file writes.
deny /** w,
}
```
Note that the name of the profile inside `spec.policy` matches the `metadata.name`,
this is currently a requirement as mentioned within the known limitations below.
Based on the policy above, an AppArmor profile `test-profile` will be created and
loaded in all nodes within the cluster.
### Apply an AppArmor profile to a pod
Once the AppArmor profile is created and loaded in all cluster nodes,
you can restrict Pod's access with the annotation:
`container.apparmor.security.beta.kubernetes.io/: test-profile`
When [AppArmor becomes GA](https://github.com/kubernetes/enhancements/pull/3298) a new field within SecurityContext will be created to replace the annotations above.
For up-to-date information on how to use AppArmor in Kubernetes, refer to the [official documentation](https://kubernetes.io/docs/tutorials/security/apparmor/).
### Known limitations
- The name set for the AppArmorProfile CRD must match the policy name
defined within `spec.policy`. Otherwise the reconciler will fail as it
won't be able to confirm the policy was correctly loaded.
- The reconciler will simply load the profiles across the cluster. If an
existing profile with the same name exists, it will be replaced.
- The SPO does not validate the profile contents. Invalid profiles
will error when loading into the kernel. The error can be found on the spod
pod and the message will roughly look like:
```
E1112 08:35:24.072544 8668 controller.go:326] "msg"="Reconciler error" "error"="cannot load profile into node: running action: exit status 1" "appArmorProfile"={"name":"","namespace":"security-profiles-operator"} "controller"="apparmorprofile" "controllerGroup"="security-profiles-operator.x-k8s.io" "controllerKind"="AppArmorProfile" "name"="" "namespace"="security-profiles-operator" "reconcileID"="035a4edd-cdd9-4c35-a1be-924939538ce4"
```
- Restrictive profiles may block sub processes to be created, or a container from
successfully loading. In such cases, the denied rules may not show up in the
log-enricher logs, as SPO may fail to find the running process to correlate to the
pod information. To work around the issue, set the AppArmor profile to complain mode.
## Command Line Interface (CLI)
The Seucrity Profiles Operator CLI `spoc` aims to support use cases where
Kubernetes is not available at all (for example in edge scenarios). It targets
to provide re-used functionality from the operator itself, especially for
development and testing environments. In the future, we plan to extend the CLI
to interact with the operator itself.
For now, the CLI is able to:
- Record seccomp profiles for a command in YAML (CRD) and JSON (OCI) format.
- Run commands with applied seccomp profiles in both formats.
`spoc` can be retrieved either by downloading the statically linked binary
directly from the [available releases][releases], or by running it within the
official container images:
```console
> podman run -it gcr.io/k8s-staging-sp-operator/security-profiles-operator:latest spoc
NAME:
spoc - Security Profiles Operator CLI
USAGE:
spoc [global options] command [command options] [arguments...]
COMMANDS:
version, v display detailed version information
record, r run a command and record the security profile
run, x run a command using a security profile
help, h Shows a list of commands or help for one command
```
[releases]: https://github.com/kubernetes-sigs/security-profiles-operator/releases/latest
### Record seccomp profiles for a command
To record a seccomp profile via `spoc`, run the corresponding subcommand
followed by any command and arguments:
```console
> sudo spoc record echo test
2023/03/10 10:09:09 Loading bpf module
…
2023/03/10 10:09:13 Adding base syscalls: capget, capset, chdir, …
2023/03/10 10:09:13 Wrote seccomp profile to: /tmp/profile.yaml
2023/03/10 10:09:13 Unloading bpf module
```
Now the seccomp profile should be written in the CRD format:
```console
> cat /tmp/profile.yaml
```
```yaml
apiVersion: security-profiles-operator.x-k8s.io/v1beta1
kind: SeccompProfile
metadata:
name: echo
spec:
architectures:
- SCMP_ARCH_X86_64
defaultAction: SCMP_ACT_ERRNO
syscalls:
- action: SCMP_ACT_ALLOW
names:
- access
- …
- write
status: {}
```
The output file path can be specified as well by using `spoc record
-o/--output-file`.
We can see that `spoc` automatically adds required base syscalls for OCI
container runtimes to ensure compatibility with them to allow using the profile
within Kubernetes. This behavior can be disabled by using `spoc record
-n/--no-base-syscalls`, or by specifying custom syscalls via `spoc record
-b/--base-syscalls`.
It is also possible to change the format to JSON via `spoc record -t/--type
raw-seccomp`:
```console
> sudo spoc record -t raw-seccomp echo test
…
2023/03/10 10:15:17 Wrote seccomp profile to: /tmp/profile.json
2023/03/10 10:15:17 Unloading bpf module
```
```console
> jq . /tmp/profile.json
```
```json
{
"defaultAction": "SCMP_ACT_ERRNO",
"architectures": ["SCMP_ARCH_X86_64"],
"syscalls": [
{
"names": ["access", "…", "write"],
"action": "SCMP_ACT_ALLOW"
}
]
}
```
All commands are interruptable by using Ctrl^C, while `spoc record` will still
write the resulting seccomp profile after process terminating.
### Run commands with seccomp profiles
If we now want to test the resulting profile, then `spoc` is able to run any
command by using seccomp profiles via `spoc run`:
```console
> sudo spoc run -p /tmp/profile.yaml echo test
2023/03/10 10:20:00 Reading file /tmp/profile.json
2023/03/10 10:20:00 Setting up seccomp
2023/03/10 10:20:00 Load seccomp profile
2023/03/10 10:20:00 Running command with PID: 567625
test
```
If we now modify the profile, for example by forbidding `chmod`:
```console
> jq 'del(.syscalls[0].names[] | select(. | contains("chmod")))' /tmp/profile.json > /tmp/profile-chmod.json
```
Then running `chmod` via `spoc run` will now throw an error, because the syscall
is not allowed any more:
```console
> sudo spoc run -p /tmp/profile-chmod.json chmod +x /tmp/profile-chmod.json
2023/03/10 10:25:38 Reading file /tmp/profile-chmod.json
2023/03/10 10:25:38 Setting up seccomp
2023/03/10 10:25:38 Load seccomp profile
2023/03/10 10:25:38 Running command with PID: 594242
chmod: changing permissions of '/tmp/profile-chmod.json': Operation not permitted
2023/03/10 10:25:38 Command did not exit successfully: exit status 1
```
### Pull security profiles from OCI registries
The `spoc` client is able to pull security profiles from OCI artifact compatible
registries. To do that, just run `spoc pull`:
```console
> spoc pull ghcr.io/security-profiles/runc:v1.1.4
16:32:29.795597 Pulling profile from: ghcr.io/security-profiles/runc:v1.1.4
16:32:29.795610 Verifying signature
Verification for ghcr.io/security-profiles/runc:v1.1.4 --
The following checks were performed on each of these signatures:
- Existence of the claims in the transparency log was verified offline
- The code-signing certificate was verified using trusted certificate authority certificates
[{"critical":{"identity":{"docker-reference":"ghcr.io/security-profiles/runc"},…}}]
16:32:33.208695 Creating file store in: /tmp/pull-3199397214
16:32:33.208713 Verifying reference: ghcr.io/security-profiles/runc:v1.1.4
16:32:33.208718 Creating repository for ghcr.io/security-profiles/runc
16:32:33.208742 Using tag: v1.1.4
16:32:33.208743 Copying profile from repository
16:32:34.119652 Reading profile
16:32:34.119677 Trying to unmarshal seccomp profile
16:32:34.120114 Got SeccompProfile: runc-v1.1.4
16:32:34.120119 Saving profile in: /tmp/profile.yaml
```
The profile can be now found in `/tmp/profile.yaml` or the specified output file
`--output-file` / `-o`. If username and password authentication is required,
either use the `--username`, `-u` flag or export the `USERNAME` environment
variable. To set the password, export the `PASSWORD` environment variable.
### Push security profiles to OCI registries
The `spoc` client is also able to push security profiles from OCI artifact
compatible registries. To do that, just run `spoc push`:
```
> export USERNAME=my-user
> export PASSWORD=my-pass
> spoc push -f ./examples/baseprofile-crun.yaml ghcr.io/security-profiles/crun:v1.8.1
16:35:43.899886 Pushing profile ./examples/baseprofile-crun.yaml to: ghcr.io/security-profiles/crun:v1.8.1
16:35:43.899939 Creating file store in: /tmp/push-3618165827
16:35:43.899947 Adding profile to store: ./examples/baseprofile-crun.yaml
16:35:43.900061 Packing files
16:35:43.900282 Verifying reference: ghcr.io/security-profiles/crun:v1.8.1
16:35:43.900310 Using tag: v1.8.1
16:35:43.900313 Creating repository for ghcr.io/security-profiles/crun
16:35:43.900319 Using username and password
16:35:43.900321 Copying profile to repository
16:35:46.976108 Signing container image
Generating ephemeral keys...
Retrieving signed certificate...
Note that there may be personally identifiable information associated with this signed artifact.
This may include the email address associated with the account with which you authenticate.
This information will be used for signing this artifact and will be stored in public transparency logs and cannot be removed later.
By typing 'y', you attest that you grant (or have permission to grant) and agree to have this information stored permanently in transparency logs.
Your browser will now be opened to:
https://oauth2.sigstore.dev/auth/auth?access_type=…
Successfully verified SCT...
tlog entry created with index: 16520520
Pushing signature to: ghcr.io/security-profiles/crun
```
We can specify an username and password in the same way as for `spoc pull`.
Please also note that signing is always required for push and pull. It is
possible to add custom annotations to the security profile by using the
`--annotations` / `-a` flag multiple times in `KEY:VALUE` format.
## Uninstalling
To uninstall, remove the profiles before removing the rest of the operator:
```sh
$ kubectl delete seccompprofiles --all --all-namespaces
$ kubectl delete -f https://raw.githubusercontent.com/kubernetes-sigs/security-profiles-operator/main/deploy/operator.yaml
```