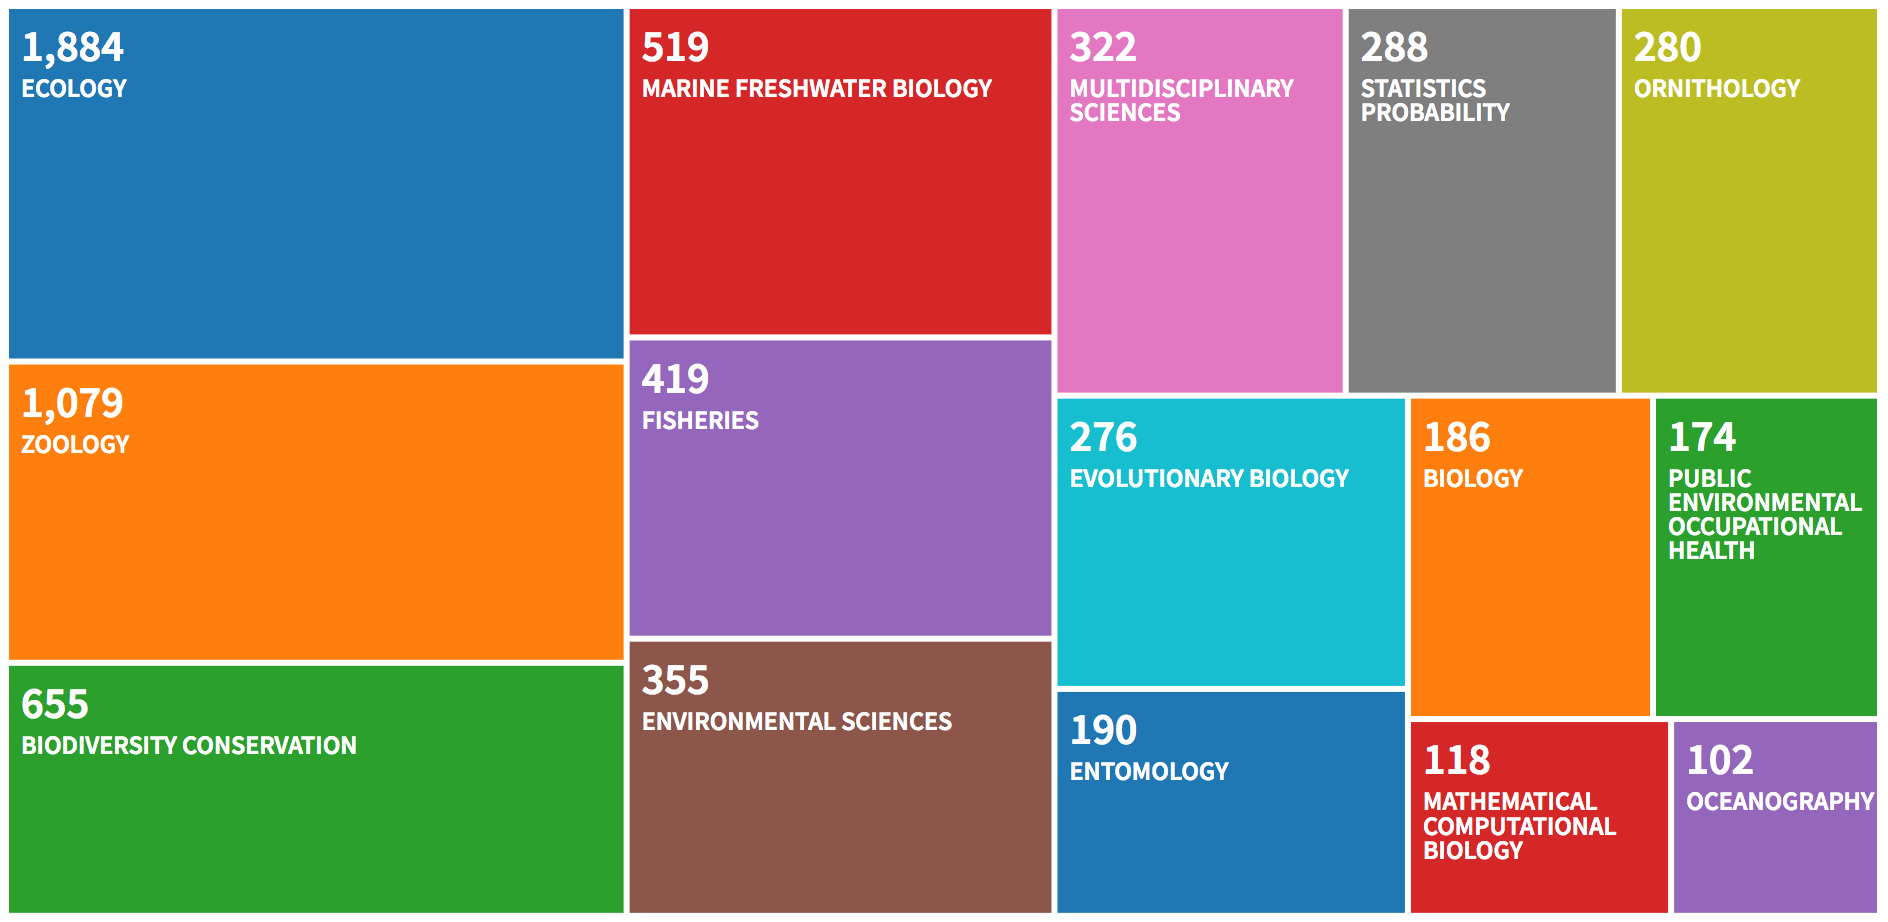
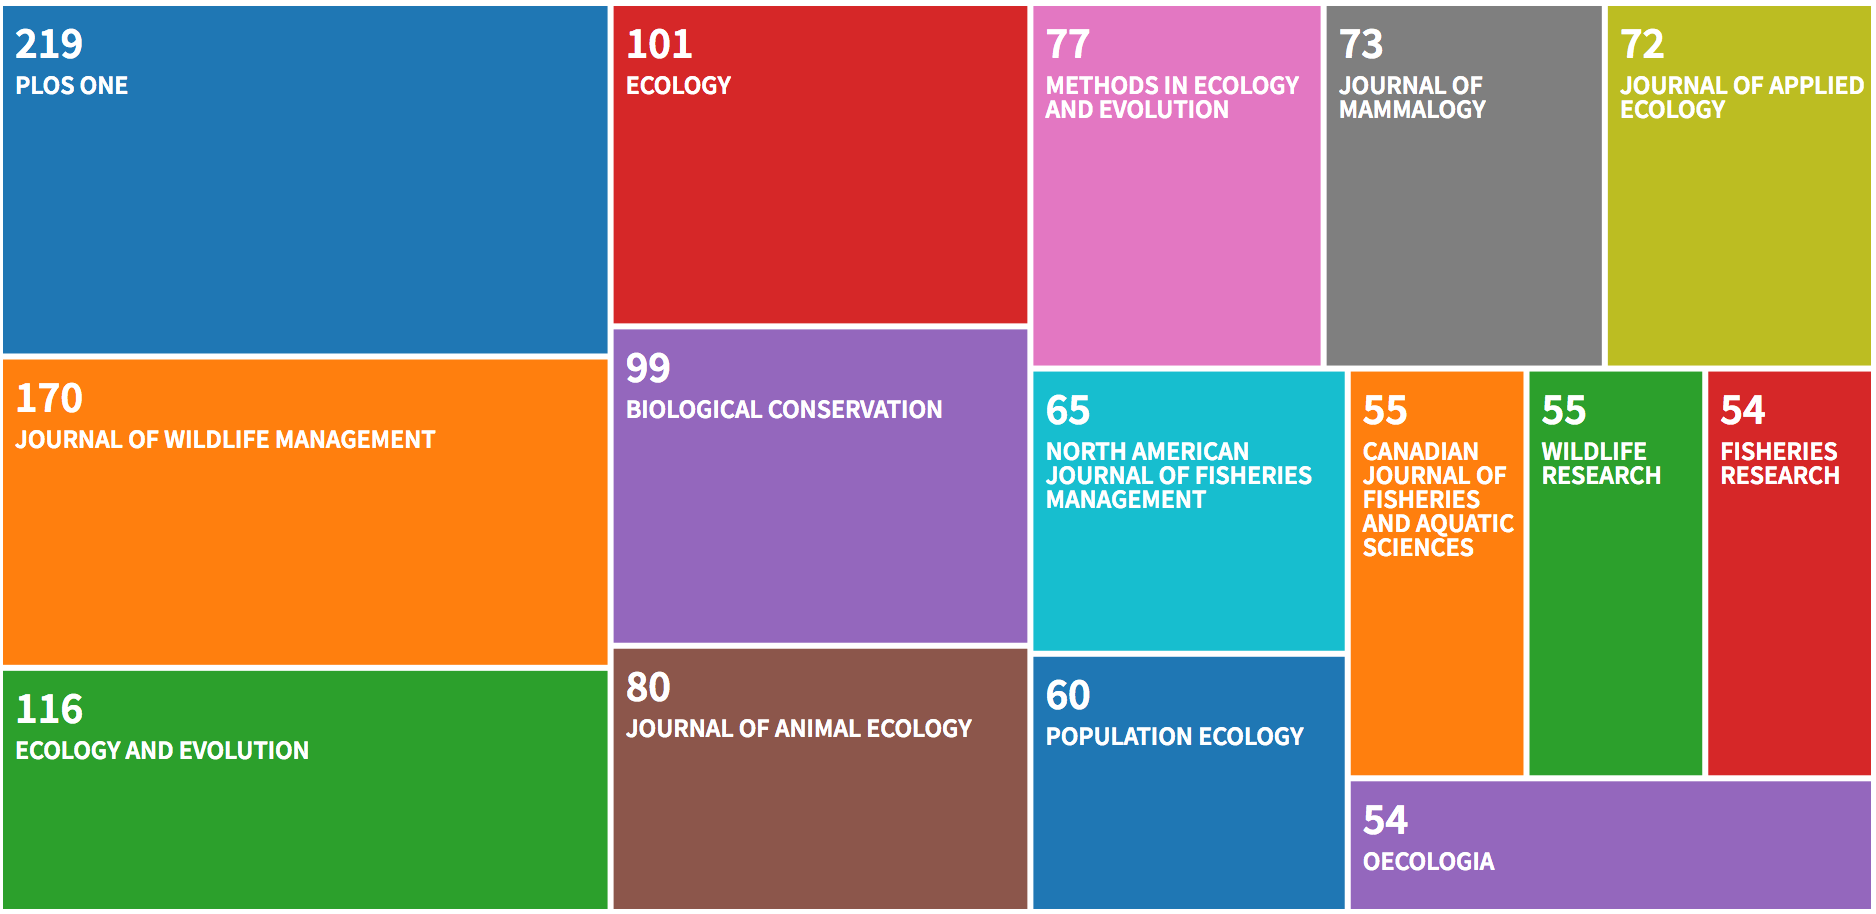
In this document, I carry out a bibliometric analysis of the
capture-recapture literature over the last 10 years. To do so, I follow
the excellent vignette of the R bibliometrix
package.
I also carry out a text analysis using topic modelling; I followed the steps here and checked the Text Mining with R excellent book many times.
To collect the data, I use the following settings:
- Data source: Clarivate Analytics Web of Science (http:https://apps.webofknowledge.com)
- Data format: Plain text
- Query: capture-recapture OR mark-recapture OR capture-mark-recapture in Topic (search in title, abstract, author, keywords, and more)
- Timespan: 2009-2019
- Document Type: Articles
- Query data: 5 August, 2019
Load the packages we will need
library(bibliometrix) # bib analyses
library(quanteda) # textual data analyses
library(tidyverse) # manipulation and viz data
library(tidytext) # handle text
library(topicmodels) # topic modelling
Read in and format the data.
# Loading txt or bib files into R environment
D <- readFiles("data/savedrecs.txt",
               "data/savedrecs(1).txt",
               "data/savedrecs(2).txt",
               "data/savedrecs(3).txt",
               "data/savedrecs(4).txt",
               "data/savedrecs(5).txt",
               "data/savedrecs(6).txt",
               "data/savedrecs(7).txt",
               "data/savedrecs(8).txt",
               "data/savedrecs(9).txt",
               "data/savedrecs(10).txt")

# Converting the loaded files into a R bibliographic dataframe
# (takes a minute or two)
M <- convert2df(D, dbsource="wos", format="plaintext")
##
## Converting your wos collection into a bibliographic dataframe
##
## Articles extracted 100
## Articles extracted 200
## Articles extracted 300
## Articles extracted 400
## Articles extracted 500
## Articles extracted 600
## Articles extracted 700
## Articles extracted 800
## Articles extracted 900
## Articles extracted 1000
## Articles extracted 1100
## Articles extracted 1200
## Articles extracted 1300
## Articles extracted 1400
## Articles extracted 1500
## Articles extracted 1600
## Articles extracted 1700
## Articles extracted 1800
## Articles extracted 1900
## Articles extracted 2000
## Articles extracted 2100
## Articles extracted 2200
## Articles extracted 2300
## Articles extracted 2400
## Articles extracted 2500
## Articles extracted 2600
## Articles extracted 2700
## Articles extracted 2800
## Articles extracted 2900
## Articles extracted 3000
## Articles extracted 3100
## Articles extracted 3200
## Articles extracted 3300
## Articles extracted 3400
## Articles extracted 3500
## Articles extracted 3600
## Articles extracted 3700
## Articles extracted 3800
## Articles extracted 3900
## Articles extracted 4000
## Articles extracted 4100
## Articles extracted 4200
## Articles extracted 4300
## Articles extracted 4400
## Articles extracted 4500
## Articles extracted 4600
## Articles extracted 4700
## Articles extracted 4800
## Articles extracted 4900
## Articles extracted 5000
## Articles extracted 5022
## Done!
##
##
## Generating affiliation field tag AU_UN from C1: Done!
Export back as a csv for further inspection:
M %>%
  mutate(title = tolower(TI),
         abstract = tolower(AB),
         authors = AU,
         journal = SO,
         keywords = tolower(DE)) %>%
  select(title, keywords, journal, authors, abstract) %>%
write_csv("crdat.csv")I ended up with 5022 articles. Note that WoS only allows 500 items to be exported at once, therefore I had to repeat the same operation multiple times.
WoS provides the user with a bunch of graphs, let’s have a look.
The number of publications per year is: 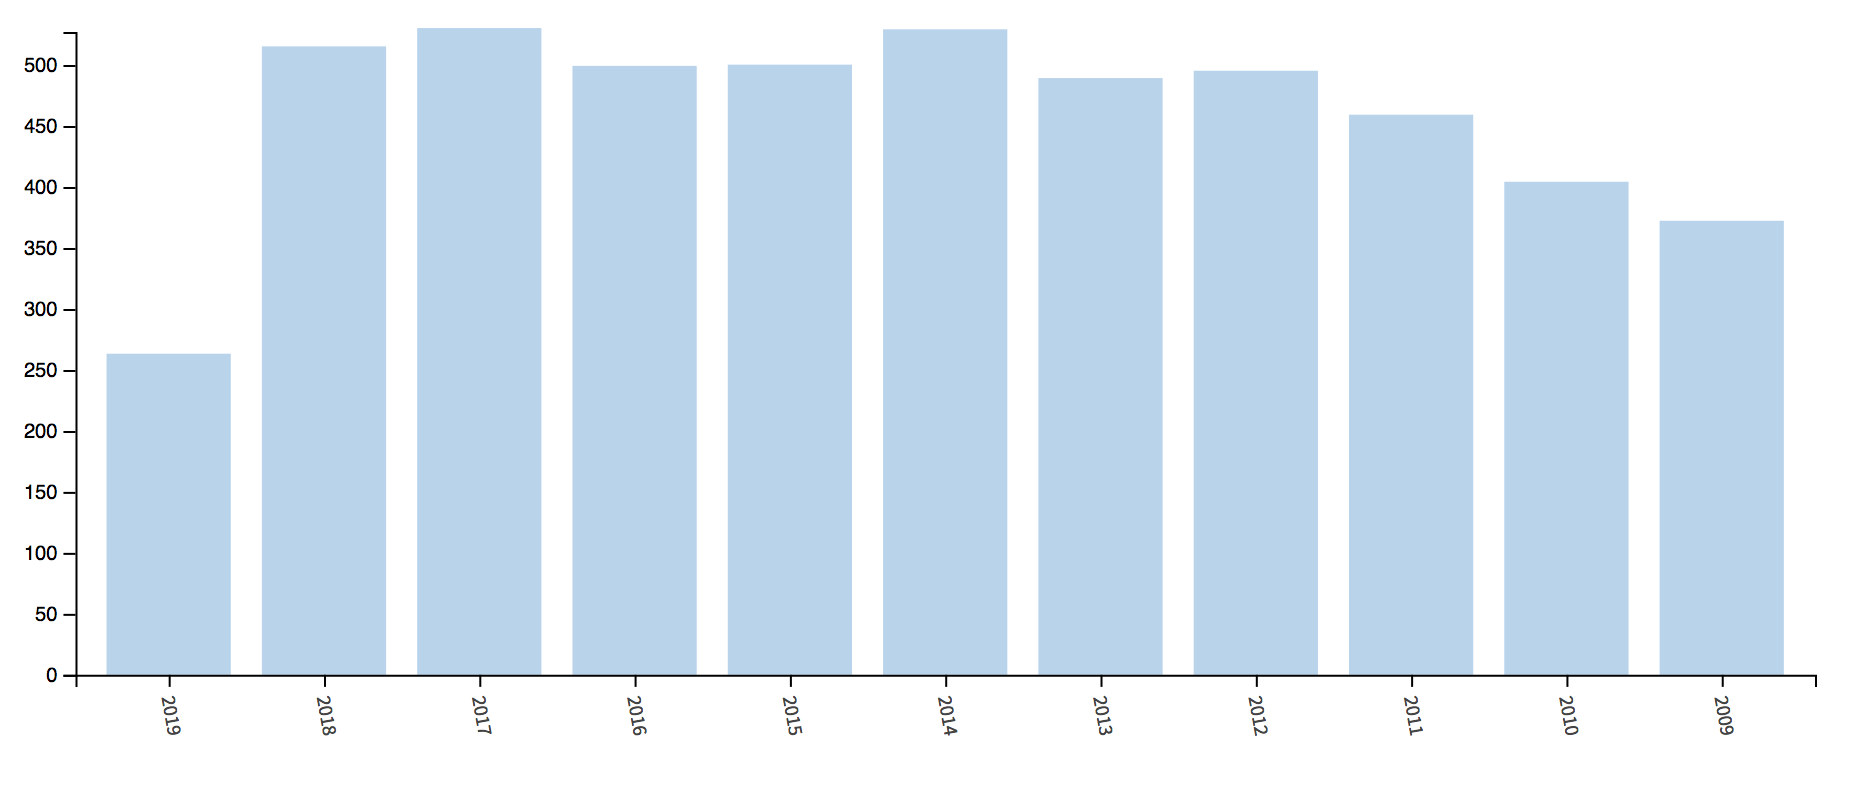
The countries of the first author are: 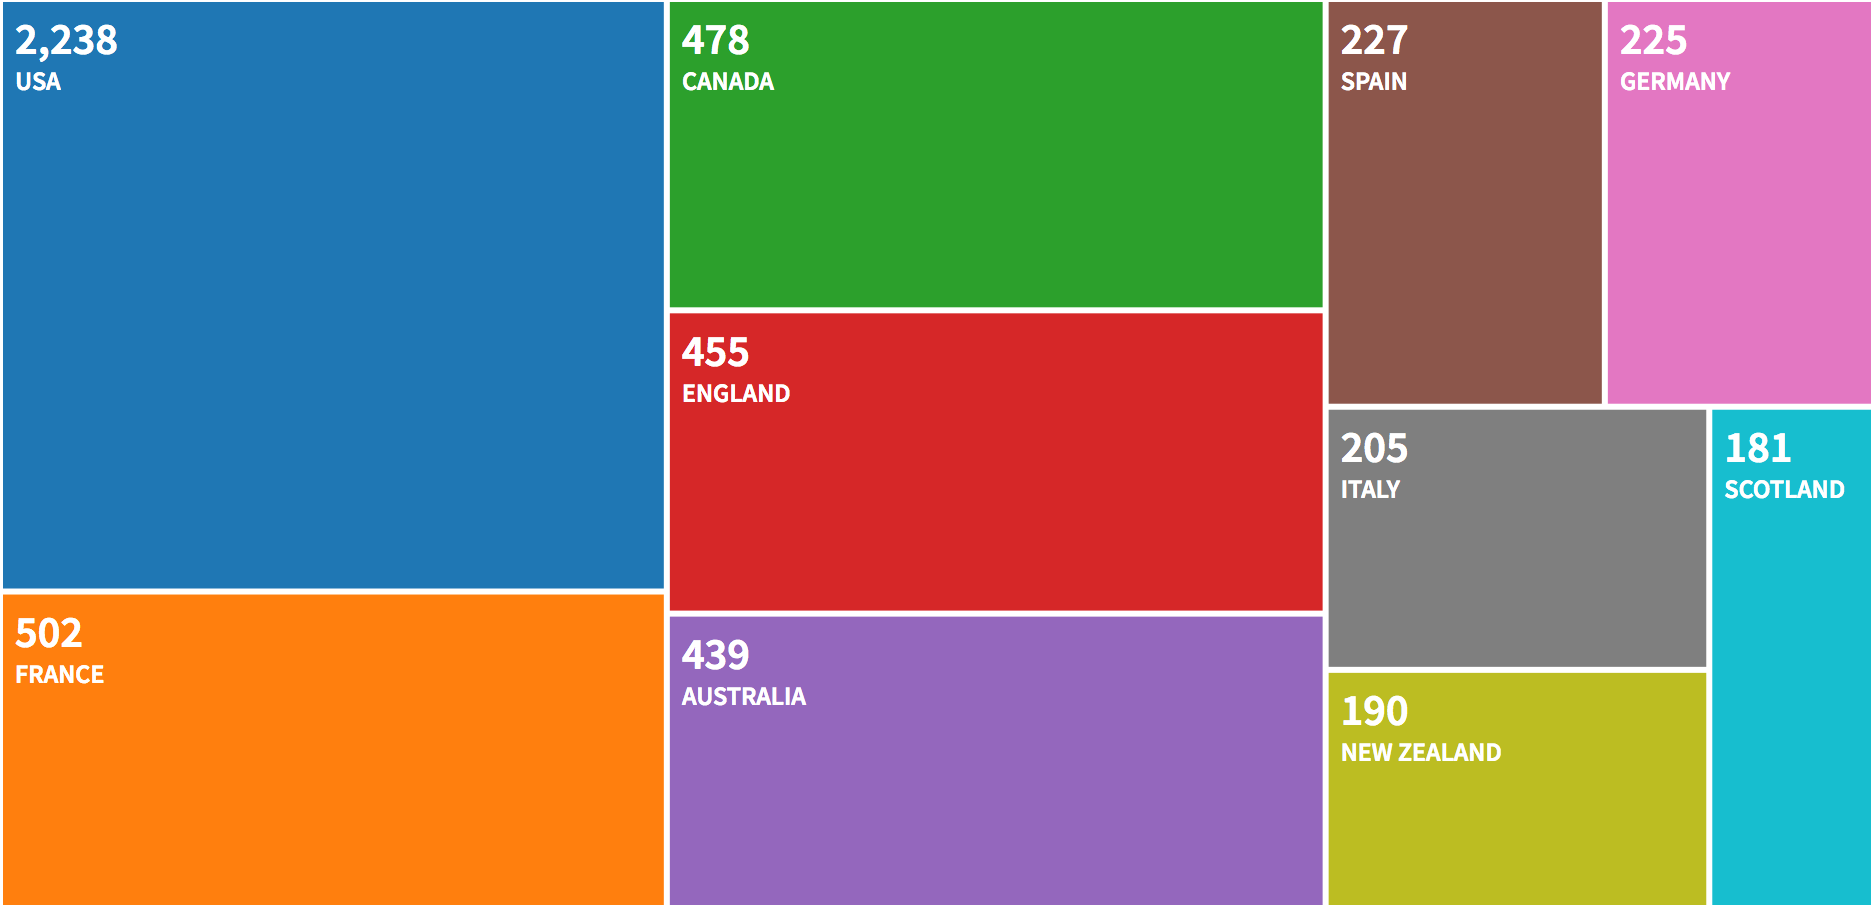
The most productive authors are: 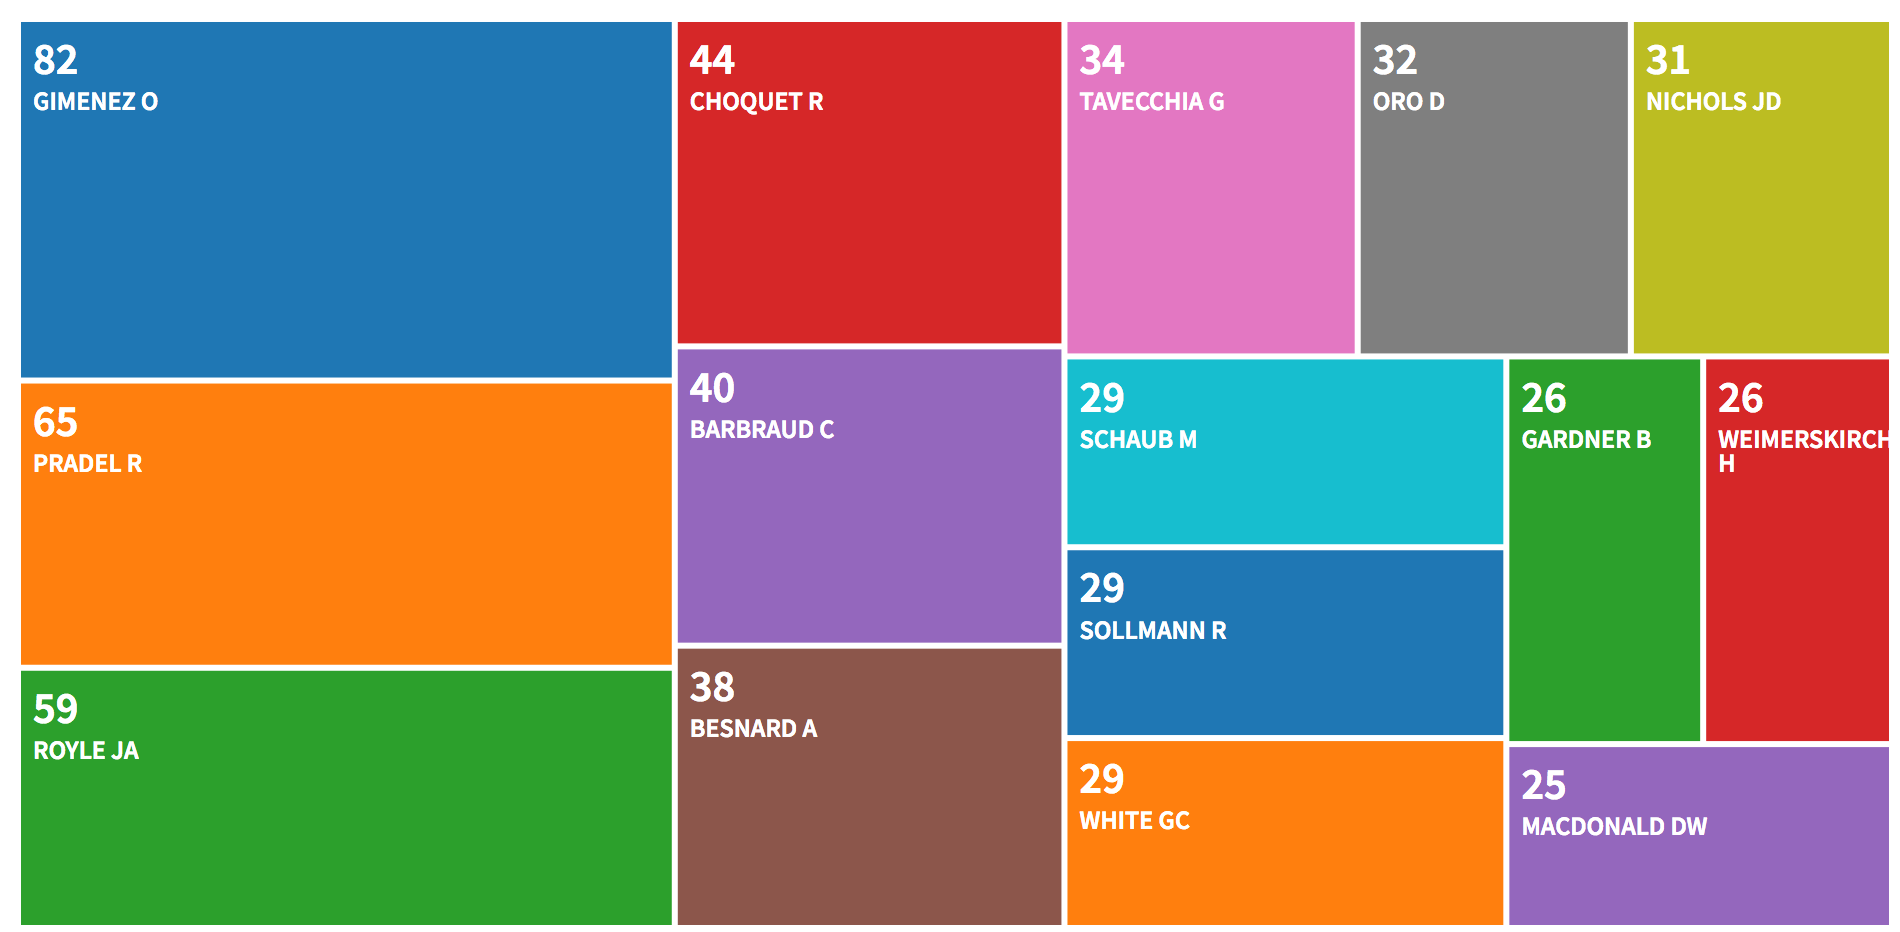
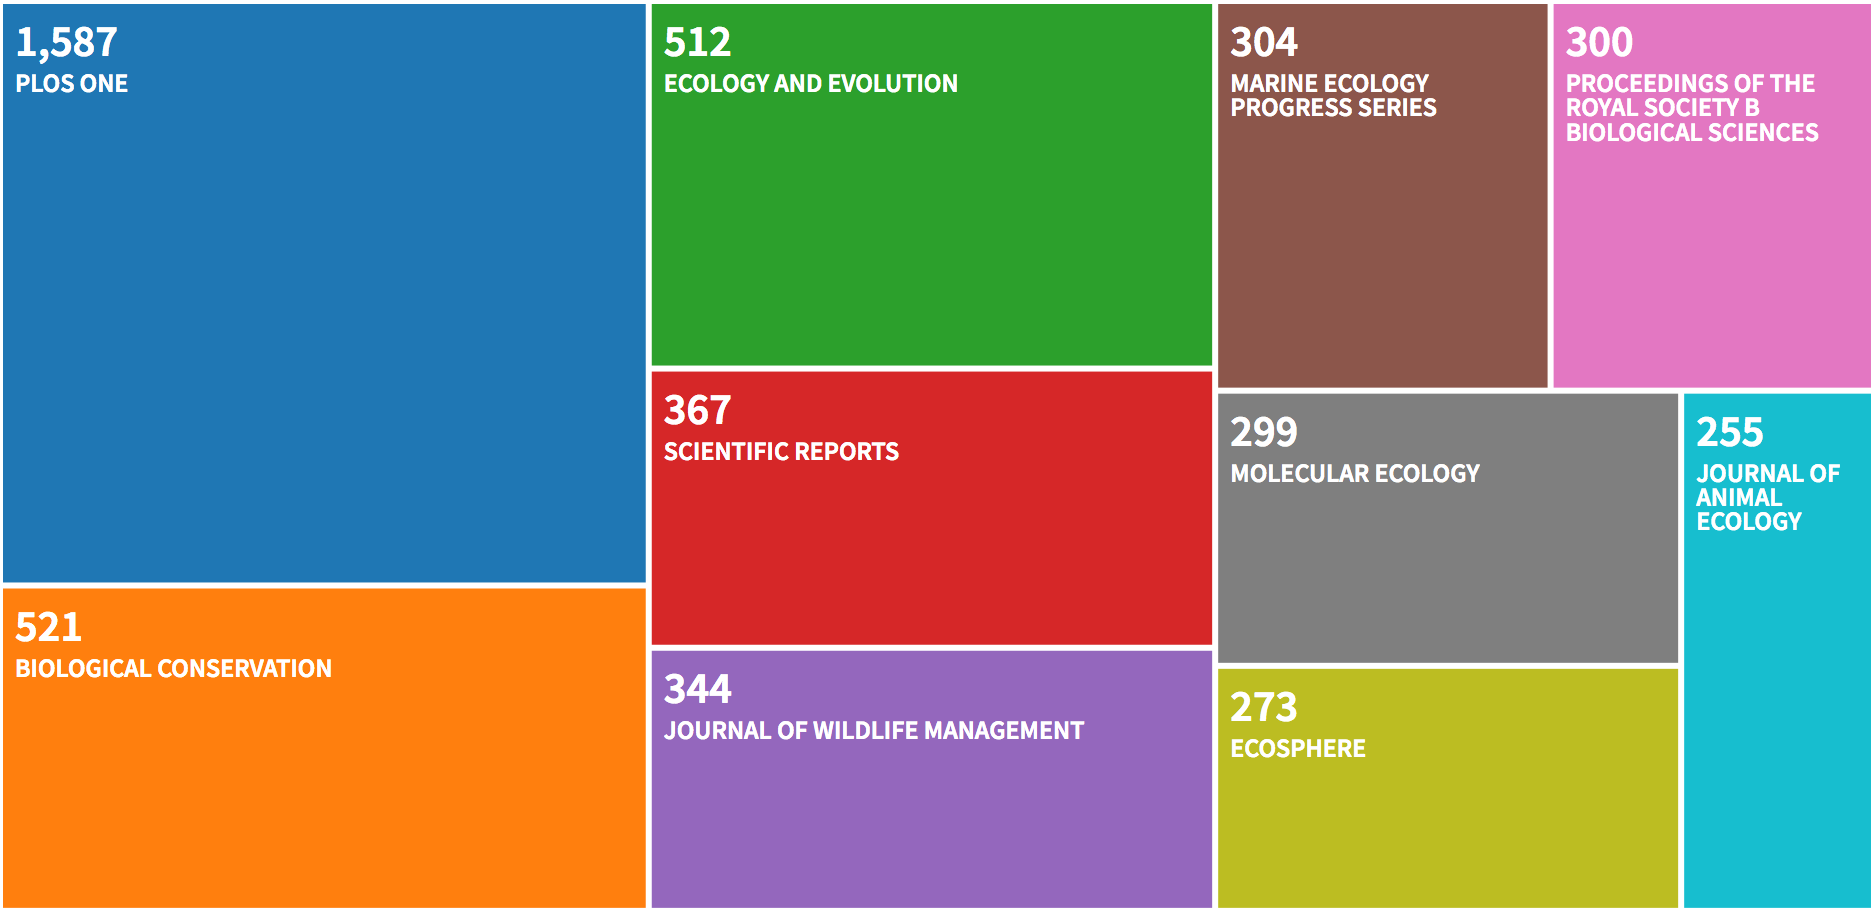
The graphs for the dataset of citing articles (who uses and what
capture-recapture are used for) show the same patterns as the dataset of
published articles, except for the journals. There are a few different
journals from which a bunch of citations are coming from, namely
Biological Conservation, Scientific Reports, Molecular Ecology and
Proceedings of the Royal Society B - Biological Sciences:
Let’s have a look to the data with R.
Number of papers per journal
dat <- as_tibble(M)
dat %>%
  group_by(SO) %>%
  count() %>%
  filter(n > 50) %>%
  ggplot(aes(reorder(SO, n), n)) +
  geom_col() +
  coord_flip() +
  labs(title = "Nb of papers per journal")
Wordcloud
dat$abstract <- tm::removeWords(dat$AB, stopwords("english"))
abs_corpus <- corpus(dat$abstract)
abs_dfm <- dfm(abs_corpus, remove = stopwords("en"), remove_numbers = TRUE, remove_punct = TRUE)
textplot_wordcloud(abs_dfm, min_count = 1500)
Most common words in titles
wordft <- dat %>%
  mutate(line = row_number()) %>%
  filter(nchar(TI) > 0) %>%
  unnest_tokens(word, TI) %>%
  anti_join(stop_words)
## Joining, by = "word"
wordft %>%
  count(word, sort = TRUE)
## # A tibble: 9,348 x 2
## word n
## <chr> <int>
## 1 population 1136
## 2 recapture 800
## 3 survival 646
## 4 capture 556
## 5 estimating 362
## 6 data 361
## 7 abundance 355
## 8 mark 343
## 9 size 315
## 10 density 299
## # … with 9,338 more rows
wordft %>%
  count(word, sort = TRUE) %>%
  filter(n > 200) %>%
  mutate(word = reorder(word, n)) %>%
  ggplot(aes(word, n)) +
  geom_col() +
  xlab(NULL) +
coord_flip() labs(title = "Most common words in titles")## $title
## [1] "Most common words in titles"
##
## attr(,"class")
## [1] "labels"
Most common words in abstracts
wordab <- dat %>%
  mutate(line = row_number()) %>%
  filter(nchar(AB) > 0) %>%
  unnest_tokens(word, AB) %>%
  anti_join(stop_words)
## Joining, by = "word"
wordab %>%
  count(word, sort = TRUE)
## # A tibble: 33,339 x 2
## word n
## <chr> <int>
## 1 population 9456
## 2 recapture 5760
## 3 survival 5742
## 4 species 5438
## 5 data 5366
## 6 capture 4158
## 7 study 4100
## 8 estimates 3660
## 9 mark 3434
## 10 individuals 3385
## # … with 33,329 more rows
wordab %>%
  count(word, sort = TRUE) %>%
  filter(n > 1500) %>%
  mutate(word = reorder(word, n)) %>%
  ggplot(aes(word, n)) +
  geom_col() +
  xlab(NULL) +
coord_flip() labs(title = "Most common words in abstracts")## $title
## [1] "Most common words in abstracts"
##
## attr(,"class")
## [1] "labels"
Now we turn to a more detailed analysis of the published articles. First calculate the main bibliometric measures:
results <- biblioAnalysis(M, sep = ";")
options(width=100)
S <- summary(object = results, k = 10, pause = FALSE)
##
##
## Main Information about data
##
## Documents 5022
## Sources (Journals, Books, etc.) 808
## Keywords Plus (ID) 10728
## Author's Keywords (DE) 10943
## Period 2009 - 2019
## Average citations per documents 11.54
##
## Authors 15128
## Author Appearances 23004
## Authors of single-authored documents 174
## Authors of multi-authored documents 14954
## Single-authored documents 201
##
## Documents per Author 0.332
## Authors per Document 3.01
## Co-Authors per Documents 4.58
## Collaboration Index 3.1
##
## Document types
## ARTICLE 4940
## ARTICLE; BOOK CHAPTER 6
## ARTICLE; EARLY ACCESS 7
## ARTICLE; PROCEEDINGS PAPER 69
##
##
## Annual Scientific Production
##
## Year Articles
## 2009 369
## 2010 401
## 2011 456
## 2012 492
## 2013 486
## 2014 526
## 2015 497
## 2016 496
## 2017 527
## 2018 512
## 2019 253
##
## Annual Percentage Growth Rate -3.703741
##
##
## Most Productive Authors
##
## Authors Articles Authors Articles Fractionalized
## 1 GIMENEZ O 82 GIMENEZ O 17.95
## 2 PRADEL R 65 ROYLE JA 15.92
## 3 ROYLE JA 59 PRADEL R 12.82
## 4 CHOQUET R 44 BOHNING D 10.78
## 5 BARBRAUD C 40 CHOQUET R 9.91
## 6 BESNARD A 38 BARBRAUD C 9.12
## 7 TAVECCHIA G 34 WHITE GC 7.84
## 8 ORO D 32 SCHAUB M 7.78
## 9 NICHOLS JD 31 KING R 7.69
## 10 SCHAUB M 29 BESNARD A 7.51
##
##
## Top manuscripts per citations
##
## Paper TC TCperYear
## 1 CHOQUET R, 2009, ECOGRAPHY 414 41.4
## 2 WHITEHEAD H, 2009, BEHAV ECOL SOCIOBIOL 350 35.0
## 3 LUIKART G, 2010, CONSERV GENET 289 32.1
## 4 GLANVILLE J, 2009, P NATL ACAD SCI USA 251 25.1
## 5 PATTERSON CC, 2012, DIABETOLOGIA 237 33.9
## 6 WALLACE BP, 2010, PLOS ONE 207 23.0
## 7 GOMEZ P, 2011, SCIENCE 195 24.4
## 8 MERTES PM, 2011, J ALLERGY CLIN IMMUN 165 20.6
## 9 ROYLE JA, 2009, ECOLOGY 158 15.8
## 10 SOMERS EC, 2014, ARTHRITIS RHEUMATOL 156 31.2
##
##
## Corresponding Author's Countries
##
## Country Articles Freq SCP MCP MCP_Ratio
## 1 USA 1766 0.3530 1432 334 0.189
## 2 UNITED KINGDOM 322 0.0644 185 137 0.425
## 3 AUSTRALIA 321 0.0642 202 119 0.371
## 4 FRANCE 311 0.0622 197 114 0.367
## 5 CANADA 305 0.0610 198 107 0.351
## 6 SPAIN 161 0.0322 95 66 0.410
## 7 ITALY 151 0.0302 89 62 0.411
## 8 GERMANY 147 0.0294 66 81 0.551
## 9 NEW ZEALAND 131 0.0262 72 59 0.450
## 10 BRAZIL 128 0.0256 95 33 0.258
##
##
## SCP: Single Country Publications
##
## MCP: Multiple Country Publications
##
##
## Total Citations per Country
##
## Country Total Citations Average Article Citations
## 1 USA 21863 12.38
## 2 FRANCE 4395 14.13
## 3 UNITED KINGDOM 4382 13.61
## 4 AUSTRALIA 3719 11.59
## 5 CANADA 3466 11.36
## 6 GERMANY 2005 13.64
## 7 NEW ZEALAND 1922 14.67
## 8 ITALY 1599 10.59
## 9 SWITZERLAND 1491 21.30
## 10 SPAIN 1437 8.93
##
##
## Most Relevant Sources
##
## Sources Articles
## 1 PLOS ONE 219
## 2 JOURNAL OF WILDLIFE MANAGEMENT 170
## 3 ECOLOGY AND EVOLUTION 116
## 4 ECOLOGY 101
## 5 BIOLOGICAL CONSERVATION 99
## 6 JOURNAL OF ANIMAL ECOLOGY 80
## 7 METHODS IN ECOLOGY AND EVOLUTION 77
## 8 JOURNAL OF MAMMALOGY 73
## 9 JOURNAL OF APPLIED ECOLOGY 72
## 10 NORTH AMERICAN JOURNAL OF FISHERIES MANAGEMENT 65
##
##
## Most Relevant Keywords
##
## Author Keywords (DE) Articles Keywords-Plus (ID) Articles
## 1 MARK RECAPTURE 722 SURVIVAL 647
## 2 CAPTURE RECAPTURE 475 CONSERVATION 525
## 3 SURVIVAL 326 CAPTURE RECAPTURE 497
## 4 CAPTURE MARK RECAPTURE 247 ABUNDANCE 494
## 5 ABUNDANCE 173 POPULATION 491
## 6 POPULATION DYNAMICS 145 MARKED ANIMALS 404
## 7 DEMOGRAPHY 140 SIZE 371
## 8 DISPERSAL 138 POPULATIONS 339
## 9 CONSERVATION 131 MARK RECAPTURE 328
## 10 POPULATION SIZE 125 DYNAMICS 302
Visualize
plot(x = results, k = 10, pause = FALSE)The 100 most frequent cited manuscripts:
CR <- citations(M, field = "article", sep = ";")
cbind(CR$Cited[1:100])
## [,1]
## WHITE GC, 1999, BIRD STUDY, V46, P120 1310
## BURNHAM K, 2002, MODEL SELECTION MULT 1131
## LEBRETON JD, 1992, ECOL MONOGR, V62, P67, DOI 10.2307/2937171 835
## WILLIAMS B. K., 2002, ANAL MANAGEMENT ANIM 546
## OTIS DL, 1978, WILDLIFE MONOGR, P1 536
## JOLLY GM, 1965, BIOMETRIKA, V52, P225, DOI 10.1093/BIOMET/52.1-2.225 368
## SEBER GAF, 1965, BIOMETRIKA, V52, P249 320
## CHOQUET R, 2009, ECOGRAPHY, V32, P1071, DOI 10.1111/J.1600-0587.2009.05968.X 313
## SEBER GA, 1982, ESTIMATION ANIMAL AB 306
## KENDALL WL, 1997, ECOLOGY, V78, P563 277
## BORCHERS DL, 2008, BIOMETRICS, V64, P377, DOI 10.1111/J.1541-0420.2007.00927.X 265
## CORMACK RM, 1964, BIOMETRIKA, V51, P429, DOI 10.1093/BIOMET/51.3-4.429 243
## POLLOCK KH, 1982, J WILDLIFE MANAGE, V46, P752, DOI 10.2307/3808568 233
## EFFORD M, 2004, OIKOS, V106, P598, DOI 10.1111/J.0030-1299.2004.13043.X 228
## PRADEL R, 1996, BIOMETRICS, V52, P703, DOI 10.2307/2532908 217
## KARANTH KU, 1998, ECOLOGY, V79, P2852 214
## CASWELL H., 2001, MATRIX POPULATION MO 203
## HUGGINS RM, 1989, BIOMETRIKA, V76, P133, DOI 10.1093/BIOMET/76.1.133 203
## POLLOCK KH, 1990, WILDLIFE MONOGR, P1 203
## SCHWARZ CJ, 1996, BIOMETRICS, V52, P860, DOI 10.2307/2533048 201
## PRADEL R, 2005, BIOMETRICS, V61, P442, DOI 10.1111/J.1541-0420.2005.00318.X 196
## BROWNIE C, 1993, BIOMETRICS, V49, P1173, DOI 10.2307/2532259 195
## HOOK EB, 1995, EPIDEMIOL REV, V17, P243, DOI 10.1093/OXFORDJOURNALS.EPIREV.A036192 193
## CHOQUET R, 2009, ENVIRON ECOL STAT SE, V3, P845, DOI 10.1007/978-0-387-78151-8_39 185
## PRADEL R, 1997, BIOMETRICS, V53, P60, DOI 10.2307/2533097 185
## PLEDGER S, 2000, BIOMETRICS, V56, P434, DOI 10.1111/J.0006-341X.2000.00434.X 171
## ROYLE JA, 2014, SPATIAL CAPTURE-RECAPTURE, P1 166
## STEARNS SC, 1992, EVOLUTION LIFE HIST 163
## BUCKLAND S. T, 2001, INTRO DISTANCE SAMPL 162
## KERY M, 2012, BAYESIAN POPULATION ANALYSIS USING WINBUGS: A HIERARCHICAL PERSPECTIVE, P1 154
## BURNHAM K. P., 1998, MODEL SELECTION INFE 147
## ROYLE JA, 2008, ECOLOGY, V89, P2281, DOI 10.1890/07-0601.1 146
## HUGGINS RM, 1991, BIOMETRICS, V47, P725, DOI 10.2307/2532158 143
## ROYLE J. A., 2008, HIERARCHICAL MODELIN 139
## ROYLE JA, 2009, ECOLOGY, V90, P3233, DOI 10.1890/08-1481.1 125
## LEBRETON JD, 2002, J APPL STAT, V29, P353, DOI 10.1080/02664760120108638 124
## MACKENZIE DI, 2002, ECOLOGY, V83, P2248, DOI 10.2307/3072056 123
## LEBRETON JD, 2009, ADV ECOL RES, V41, P87, DOI 10.1016/S0065-2504(09)00403-6 120
## KARANTH KU, 1995, BIOL CONSERV, V71, P333, DOI 10.1016/0006-3207(94)00057-W 118
## SAETHER BE, 2000, ECOLOGY, V81, P642, DOI 10.2307/177366 118
## MACKENZIE DI, 2006, OCCUPANCY ESTIMATION 114
## KENDALL WL, 1995, BIOMETRICS, V51, P293, DOI 10.2307/2533335 113
## BURNHAM K.P., 2002, MODEL SELECTION INFE 110
## HESTBECK JB, 1991, ECOLOGY, V72, P523, DOI 10.2307/2937193 106
## AMSTRUP SC, 2005, HANDBOOK OF CAPTURE-RECAPTURE ANALYSIS, P1 104
## BROOKS SP, 1998, J COMPUT GRAPH STAT, V7, P434, DOI 10.2307/1390675 103
## SCHWARZ CJ, 1993, BIOMETRICS, V49, P177, DOI 10.2307/2532612 103
## WOODS JG, 1999, WILDLIFE SOC B, V27, P616 103
## KENDALL WL, 1999, ECOLOGY, V80, P2517, DOI 10.1890/0012-9658(1999)080[2517:ROCCRM]2.0.CO 102
## GROSBOIS V, 2008, BIOL REV, V83, P357, DOI 10.1111/J.1469-185X.2008.00047.X 101
## R CORE TEAM, 2015, R LANG ENV STAT COMP 101
## WAITS LP, 2001, MOL ECOL, V10, P249, DOI 10.1046/J.1365-294X.2001.01185.X 100
## CHAO A, 1987, BIOMETRICS, V43, P783, DOI 10.2307/2531532 99
## CHAO A, 2001, STAT MED, V20, P3123, DOI 10.1002/SIM.996.ABS 99
## LINK WA, 2003, BIOMETRICS, V59, P1123, DOI 10.1111/J.0006-341X.2003.00129.X 99
## AKAIKE H., 1973, 2 INT S INF THEOR, P267, DOI DOI 10.1007/978-1-4612-1694-0_ 97
## BURNHAM KENNETH P., 1993, P199 97
## EFFORD MG, 2009, ENVIRON ECOL STAT SE, V3, P255, DOI 10.1007/978-0-387-78151-8_11 95
## R DEVELOPMENT CORE TEAM, 2011, R LANG ENV STAT COMP 94
## PRADEL R., 2005, ANIMAL BIODIVERSITY AND CONSERVATION, V28, P189 93
## R CORE TEAM, 2013, R LANG ENV STAT COMP 93
## GREENWOOD PJ, 1980, ANIM BEHAV, V28, P1140, DOI 10.1016/S0003-3472(80)80103-5 92
## YIP PSF, 1995, AM J EPIDEMIOL, V142, P1047 92
## PLEDGER S, 2003, BIOMETRICS, V59, P786, DOI 10.1111/J.0006-341X.2003.00092.X 90
## KENDALL WL, 2002, ECOLOGY, V83, P3276 89
## PAETKAU D, 2003, MOL ECOL, V12, P1375, DOI 10.1046/J.1365-294X.2003.01820.X 89
## SOISALO MK, 2006, BIOL CONSERV, V129, P487, DOI 10.1016/J.BIOCON.2005.11.023 89
## WILSON B, 1999, ECOL APPL, V9, P288, DOI 10.2307/2641186 89
## WAITS LP, 2005, J WILDLIFE MANAGE, V69, P1419, DOI 10.2193/0022-541X(2005)69[1419:NGSTFW]2.0.CO 88
## ARNOLD TW, 2010, J WILDLIFE MANAGE, V74, P1175, DOI 10.2193/2009-367 86
## PRITCHARD JK, 2000, GENETICS, V155, P945 86
## R CORE TEAM, 2016, R LANG ENV STAT COMP 86
## SILVER SC, 2004, ORYX, V38, P148, DOI 10.1017/S0030605304000286 86
## SOLLMANN R, 2011, BIOL CONSERV, V144, P1017, DOI 10.1016/J.BIOCON.2010.12.011 86
## GAILLARD JM, 2000, ANNU REV ECOL SYST, V31, P367, DOI 10.1146/ANNUREV.ECOLSYS.31.1.367 85
## GAILLARD JM, 2003, ECOLOGY, V84, P3294, DOI 10.1890/02-0409 85
## R CORE TEAM, 2014, R LANG ENV STAT COMP 84
## KARANTH KU, 2006, ECOLOGY, V87, P2925, DOI 10.1890/0012-9658(2006)87[2925:ATPDUP]2.0.CO 83
## SPIEGELHALTER DJ, 2002, J ROY STAT SOC B, V64, P583, DOI 10.1111/1467-9868.00353 83
## ANDERSON DR, 1994, ECOLOGY, V75, P1780, DOI 10.2307/1939637 82
## GELMAN A, 2004, BAYESIAN DATA ANAL 82
## STANLEY TR, 1999, ENVIRON ECOL STAT, V6, P197, DOI 10.1023/A:1009674322348 82
## GELMAN A, 1992, STAT SCI, V7, P457, DOI DOI 10.1214/SS/1177011136 81
## LUNN DJ, 2000, STAT COMPUT, V10, P325, DOI 10.1023/A:1008929526011 81
## SCHWARZ CJ, 1999, STAT SCI, V14, P427 81
## WILSON KR, 1985, J MAMMAL, V66, P13, DOI 10.2307/1380951 81
## KREBS CJ, 1999, ECOLOGICAL METHODOLO 80
## PULLIAM HR, 1988, AM NAT, V132, P652, DOI 10.1086/284880 80
## FOSTER RJ, 2012, J WILDLIFE MANAGE, V76, P224, DOI 10.1002/JWMG.275 78
## BESBEAS P, 2002, BIOMETRICS, V58, P540, DOI 10.1111/J.0006-341X.2002.00540.X 77
## GAILLARD JM, 1998, TRENDS ECOL EVOL, V13, P58, DOI 10.1016/S0169-5347(97)01237-8 77
## MORRIS W. F., 2002, QUANTITATIVE CONSERV 77
## SCHAUB M, 2004, ECOLOGY, V85, P2107, DOI 10.1890/03-3110 77
## LUKACS PM, 2005, MOL ECOL, V14, P3909, DOI 10.1111/J.1365-294X.2005.02717.X 76
## MILLER CR, 2005, MOL ECOL, V14, P1991, DOI 10.1111/J.1365-294X.2005.02577.X 76
## R DEVELOPMENT CORE TEAM, 2012, R LANG ENV STAT COMP 76
## REXSTAD E., 1991, USERS GUIDE INTERACT 76
## WHITE G. C., 1982, CAPTURE RECAPTURE RE 76
## EFFORD M. G., 2004, ANIMAL BIODIVERSITY AND CONSERVATION, V27, P217 75
## HURVICH CM, 1989, BIOMETRIKA, V76, P297, DOI 10.2307/2336663 75
The most frequent cited first authors:
CR <- citations(M, field = "author", sep = ";")
cbind(CR$Cited[1:25])
## [,1]
## WHITE GC 1671
## LEBRETON JD 1254
## ROYLE JA 1249
## BURNHAM K 1144
## PRADEL R 1017
## KENDALL WL 919
## POLLOCK KH 891
## CHOQUET R 858
## NICHOLS JD 671
## R DEVELOPMENT CORE TEAM 648
## KARANTH KU 620
## WILLIAMS B K 602
## OTIS DL 553
## CHAO A 540
## SCHWARZ CJ 512
## R CORE TEAM 511
## SCHAUB M 505
## SEBER GAF 488
## MACKENZIE DI 475
## BURNHAM K P 466
## BURNHAM KP 461
## KERY M 449
## EFFORD MG 435
## GELMAN A 399
## PLEDGER S 399
Top authors productivity over time:
topAU <- authorProdOverTime(M, k = 10, graph = TRUE)Collaboration network. Below is an author collaboration network, where nodes represent top 30 authors in terms of the numbers of authored papers in our dataset; links are co-authorships. The Louvain algorithm is used throughout for clustering.
M <- metaTagExtraction(M, Field = "AU_CO", sep = ";")
NetMatrix <- biblioNetwork(M, analysis = "collaboration", network = "authors", sep = ";")
net <- networkPlot(NetMatrix, n = 30, Title = "Collaboration network", type = "fruchterman", size=TRUE, remove.multiple=FALSE,labelsize=0.7,cluster="louvain")
Country collaborations
NetMatrix <- biblioNetwork(M, analysis = "collaboration", network = "countries", sep = ";")
net <- networkPlot(NetMatrix, n = 20, Title = "Country collaborations", type = "fruchterman", size=TRUE, remove.multiple=FALSE,labelsize=0.7,cluster="louvain")
A keyword co-occurrences network
NetMatrix <- biblioNetwork(M, analysis = "co-occurrences", network = "keywords", sep = ";")
# Main characteristics of the network
netstat <- networkStat(NetMatrix)
summary(netstat, k = 10)
##
##
## Main statistics about the network
##
## Size 10867
## Density 0.002
## Transitivity 0.08
## Diameter 6
## Degree Centralization 0.192
## Average path length 2.772
##
# Plot the network
net <- networkPlot(NetMatrix, normalize="association", weighted=T, n = 50, Title = "Keyword co-occurrences", type = "fruchterman", size=T,edgesize = 5,labelsize=0.7)
Co-citation network
# Create a co-citation network
NetMatrix <- biblioNetwork(M, analysis = "co-citation", network = "references", sep = ";")
# Plot the network
net <- networkPlot(NetMatrix, n = 10, Title = "Co-citation Network", type = "fruchterman", size=T, remove.multiple=FALSE, labelsize=0.7,edgesize = 5)wordfabs <- dat %>%
mutate(line = row_number()) %>%
filter(nchar(AB) > 0) %>%
unnest_tokens(word, AB) %>%
anti_join(stop_words) %>%
filter(str_detect(word, "[^\\d]")) %>%
group_by(word) %>%
mutate(word_total = n()) %>%
ungroup() ## Joining, by = "word"
desc_dtm <- wordfabs %>%
  count(line, word, sort = TRUE) %>%
  ungroup() %>%
  cast_dtm(line, word, n)
desc_lda <- LDA(desc_dtm, k = 20, control = list(seed = 42))
tidy_lda <- tidy(desc_lda)top_terms <- tidy_lda %>%
filter(topic < 13) %>%
group_by(topic) %>%
top_n(10, beta) %>%
ungroup() %>%
arrange(topic, -beta)
top_terms %>%
mutate(term = reorder(term, beta)) %>%
group_by(topic, term) %>%
arrange(desc(beta)) %>%
ungroup() %>%
mutate(term = factor(paste(term, topic, sep = "__"),
levels = rev(paste(term, topic, sep = "__")))) %>%
ggplot(aes(term, beta, fill = as.factor(topic))) +
geom_col(show.legend = FALSE) +
coord_flip() +
scale_x_discrete(labels = function(x) gsub("__.+$", "", x)) +
labs(title = "Top 10 terms in each LDA topic",
x = NULL, y = expression(beta)) +
facet_wrap(~ topic, ncol = 4, scales = "free")#ggsave('topic_abstracts.png', dpi = 600)This is quite informative! Topics can fairly easily be interpreted (may need to go back to the paper most related to a specific topic to be sure): 1 is about estimating fish survival, 2 is about photo-id, 3 is general about modeling and estimation, 4 is disease ecology, 5 is about estimating abundance of marine mammals, 6 is about capture-recapture in (human) health sciences, 7 is about the conservation of large carnivores (tigers, leopards), 8 is about growth and recruitment, 9 about prevalence estimation in humans (I think), 10 is about the estimation of individual growth in fish, 11 is (not a surprise) about birds (migration and reproduction), and 12 is about habitat perturbations (I think).
