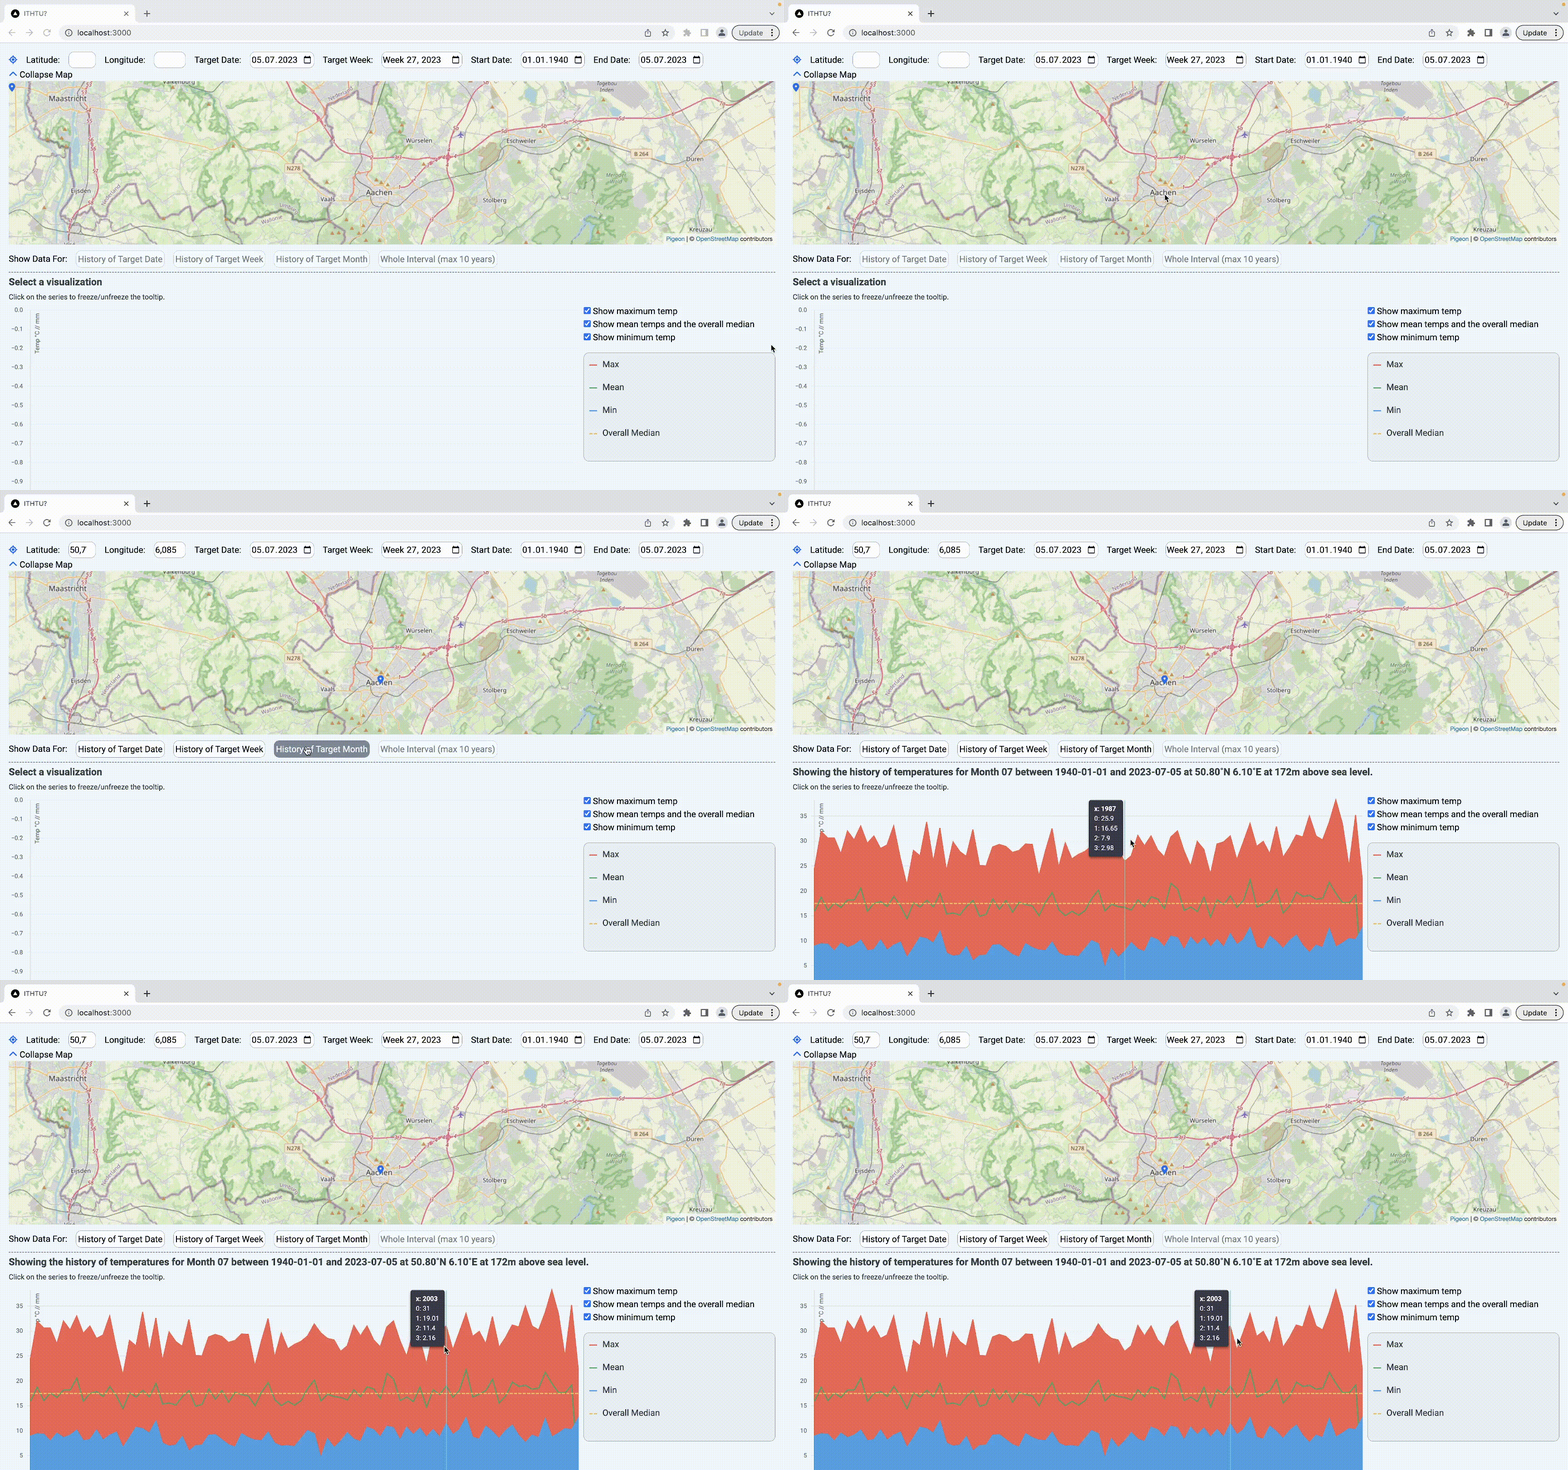
This web app lets you visualize and compare weather trends for any geolocation. Inspect historical data for any specific date, calender week or month in a timespan from 1940 until today.
Trends are computed in line with the National Center for Atmospheric Research Staff (Eds). Last modified 05 Sep 2014. "The Climate Data Guide: Trend Analysis." Retrieved from here.
This is a Next.js app using React-Vis, Pigeon Maps, and the Open Meteo API.
Clone the repo and run the development server:
npm run devOpen https://localhost:3000 to use the app.
