Profiling workflow for dotnet/runtime repository {#top}
- Profiling workflow for dotnet/runtime repository {#top}
This doc explains how to profile local dotnet/runtime builds and it's targetted at dotnet/runtime repository contributors.
Before you start any performance investigation, you need to build dotnet/runtime in release, create a small repro app and change the default project settings. if you want to profile a benchmarkdotnet test (like those in this repo), benchmarkdotnet has built-in profiling option to collect trace.
The next step is to choose the right profiler depending on the OS:
- Windows
- Visual Studio Profiler allows for cpu and memory profiling. It's intuitive to use and you should use it be default.
- PerfView is the ultimate .net profiler but it has a high entry cost. if visual studio profiler is not enough, you should switch to perfview.
- Linux
- dotnet trace works on every OS, it's easy to use and it should be your default choice on Unix systems.
- PerfCollect is a simple, yet very powerful script that allows for profiling native parts of .NET Core. You should use it if
dotnet tracecan not handle your case.
If you clearly need information on CPU instruction level, then depending on the hardware you should use Intel VTune or amd uprof.
You need to build dotnet/runtime in Release first:
C:\Projects\runtime> build -c ReleaseThe build produces two things that we care about:
dotnetand allSystem.XYZ.dllsused internally to run Libraries unit tests. It can be used by Visual Studio Profiler to run the code that you want to profile. Example:
C:\Projects\runtime\artifacts\bin\testhost\net9.0-windows-Release-x64\dotnet.exe
CoreRunand allSystem.XYZ.dllsthat can be used to run the code that you want to profile. Example:
C:\Projects\runtime\artifacts\bin\testhost\net9.0-windows-Release-x64\shared\Microsoft.NETCore.App\9.0.0\CoreRun.exe
- But the dotnet/runtime build only produces the artifacts necessary for a runtime, not for an sdk. Visual Studio will require a full SDK to be able to compile your console app from the next step. One way to convert your generated runtime into a full sdk, is to navigate to the
runtime\.dotnet\folder, copy thepacksandsdkfolders located inside, and then paste them insideruntime\artifacts\bin\testhost\net9.0-windows-Release-x64\.
Once you rebuild the part of dotnet/runtime you are working on, the appropriate .dll gets updated and the next time you run profiler, dotnet|CoreRun is going to use the updated library.
C:\Projects\runtime\src\libraries\System.Text.RegularExpressions\src> dotnet msbuild /p:Configuration=ReleaseThe next step is to prepare a small console app that executes the code that you want to profile. The app should run for at least a few seconds and keep the overhead as small as possible to make sure it does not dominate the profile.
Following code can be used to profile the DateTime.UtcNow:
using System;

namespace ProfilingDocs
{
    class Program
    {
        static int Main()
        {
            long ticks = 0;

            for (int i = 0; i < 30_000_000; i++) // 30_000_000 is enough to run for 2-3 seconds
            {
                ticks ^= DateTime.UtcNow.Ticks; // xor is cheap operation (modulo is not)
            }

            return (int)ticks; // return the result to prevent from dead code elimination
        }
    }
}Hint: If you need to implement some initialization logic you can extract it to a standalone method and use [MethodImpl] to prevent from inlining. It's going to make it easier for you to filter the profiler output: instead of filtering by time you are going to be able to filter to a single method.
class Program
{
    static void Main() => WhatYouCareAbout(Setup());

    [MethodImpl(MethodImplOptions.NoInlining)]
    private static $SomeType Setup() { }

    [MethodImpl(MethodImplOptions.NoInlining)]
    private static void WhatYouCareAbout($SomeType initialized) { }
}It's recommended to disable Tiered JIT (to avoid the need of warmup) and emit full symbols (not enabled by default for Release builds):
<Project Sdk="Microsoft.NET.Sdk">

  <PropertyGroup>
    <OutputType>Exe</OutputType>
    <TargetFramework>net9.0</TargetFramework>

    <DebugType>pdbonly</DebugType>
    <DebugSymbols>true</DebugSymbols>

    <TieredCompilation>false</TieredCompilation>
  </PropertyGroup>

</Project>
Visual Studio Profiler is not as powerful as PerfView, but it's definitely more intuitive to use. If you don't know which profiler to use, you should use it by default.
To profile a local build of dotnet/runtime and get symbol solving working in Visual Studio Profiler you can use the produced dotnet or CoreRun.
Following script launches a Visual Studio solution with environment variables required to use a local version of the .NET Core SDK:
@ECHO OFF
SETLOCAL

:: This tells .NET Core to use the dotnet.exe passed as first argument to the script
SET DOTNET_ROOT=%1

:: This tells .NET Core not to go looking for .NET Core in other places
SET DOTNET_MULTILEVEL_LOOKUP=0

:: Put our local dotnet.exe on PATH first so Visual Studio knows which one to use
SET PATH=%DOTNET_ROOT%;%PATH%

SET sln=%2

:: This starts VS
start %sln%
You can just save it as startvs.cmd file and run providing path to the testhost folder produced by dotnet/runtime build and a VS solution with repo project:
startvs.cmd "C:\Projects\runtime\artifacts\bin\testhost\net9.0-windows-Release-x64\" "C:\Projects\repro\ProfilingDocs.sln"Once you started the VS with the right environment variables you need to click on the Debug menu item and then choose Performance Profiler or just press Alt+F2:
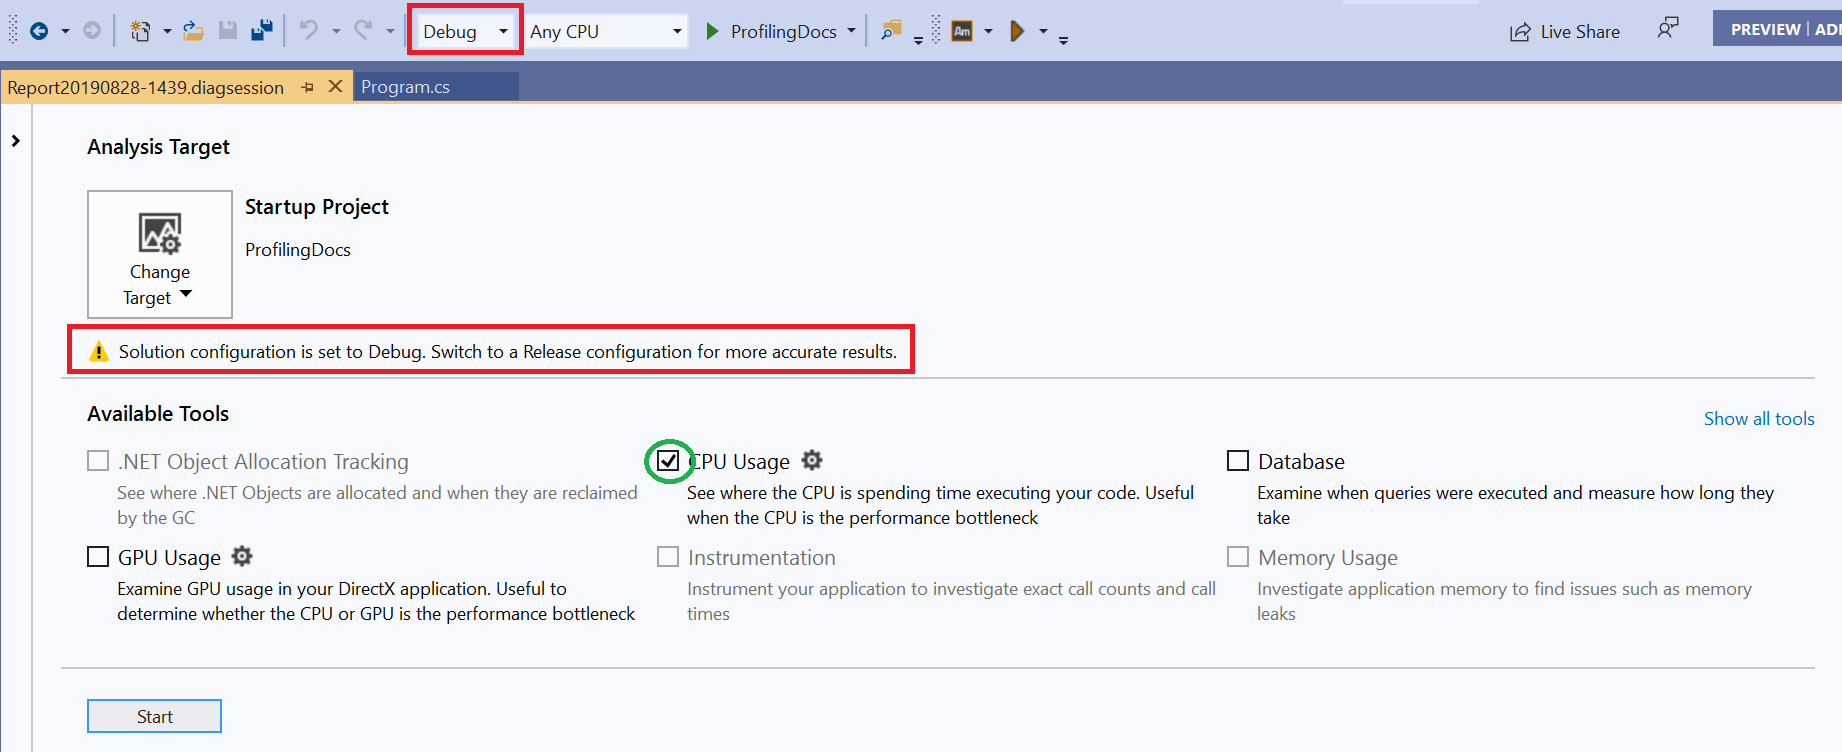
Switch to Release configuration, check CPU Usage and just click Start:
Give VS a few seconds to run. It's important to execute enough code to run for at least a few seconds to let the profiler gather enough samples:
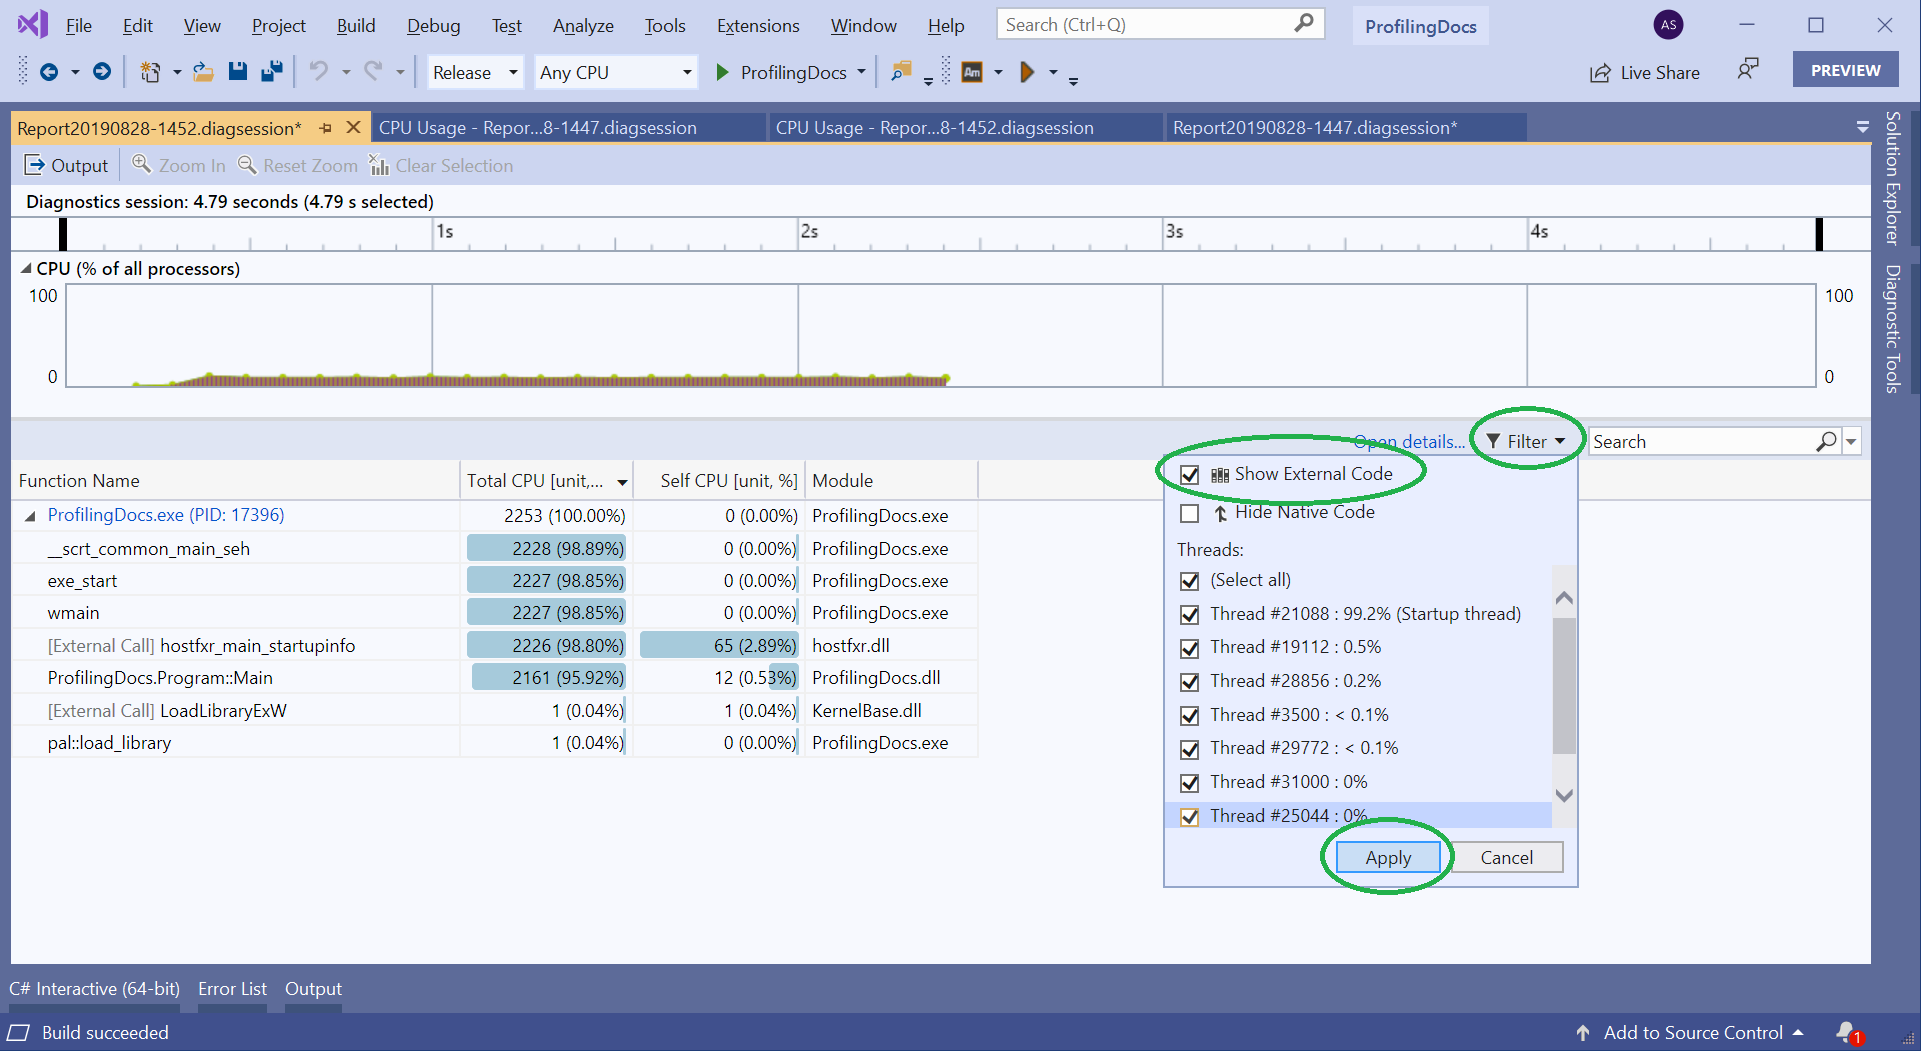
By default VS Profiler does not show the External Code (functions in system and framework component). When you are profiling dotnet/runtime this is the most important thing you care about. To show the external code click Filter then check Show External Code and click Apply button.
If you don't do that, then VS is going to tell you that most of the time was spent in "External Code" but you won't be able to tell what code was it exactly.
From here, you should be able to analyze the profile.
You can either click on the Main method and drill into interesting methods:
Or just sort the methods by exclusive CPU time by clicking on the Self CPU column and clicking on the most time-consuming method name.
Visual Studio Profiler 2019 has changed the default policy for loading symbol files.
If you see "Source information is not available" message:
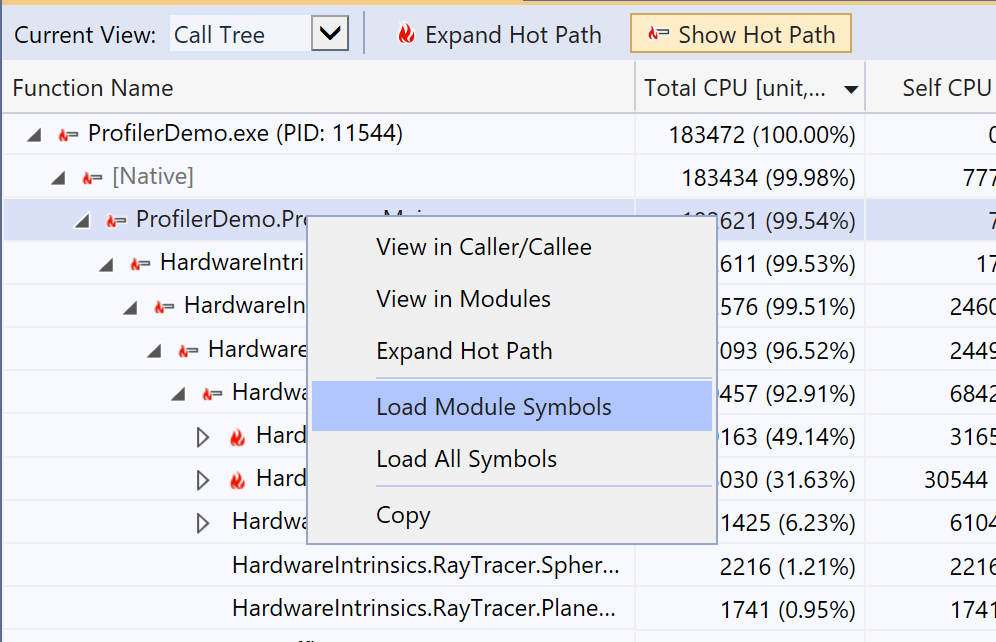
You need to switch to "Call Tree" view, right click on a method from given module and choose "Load Module Symbols" from the menu:
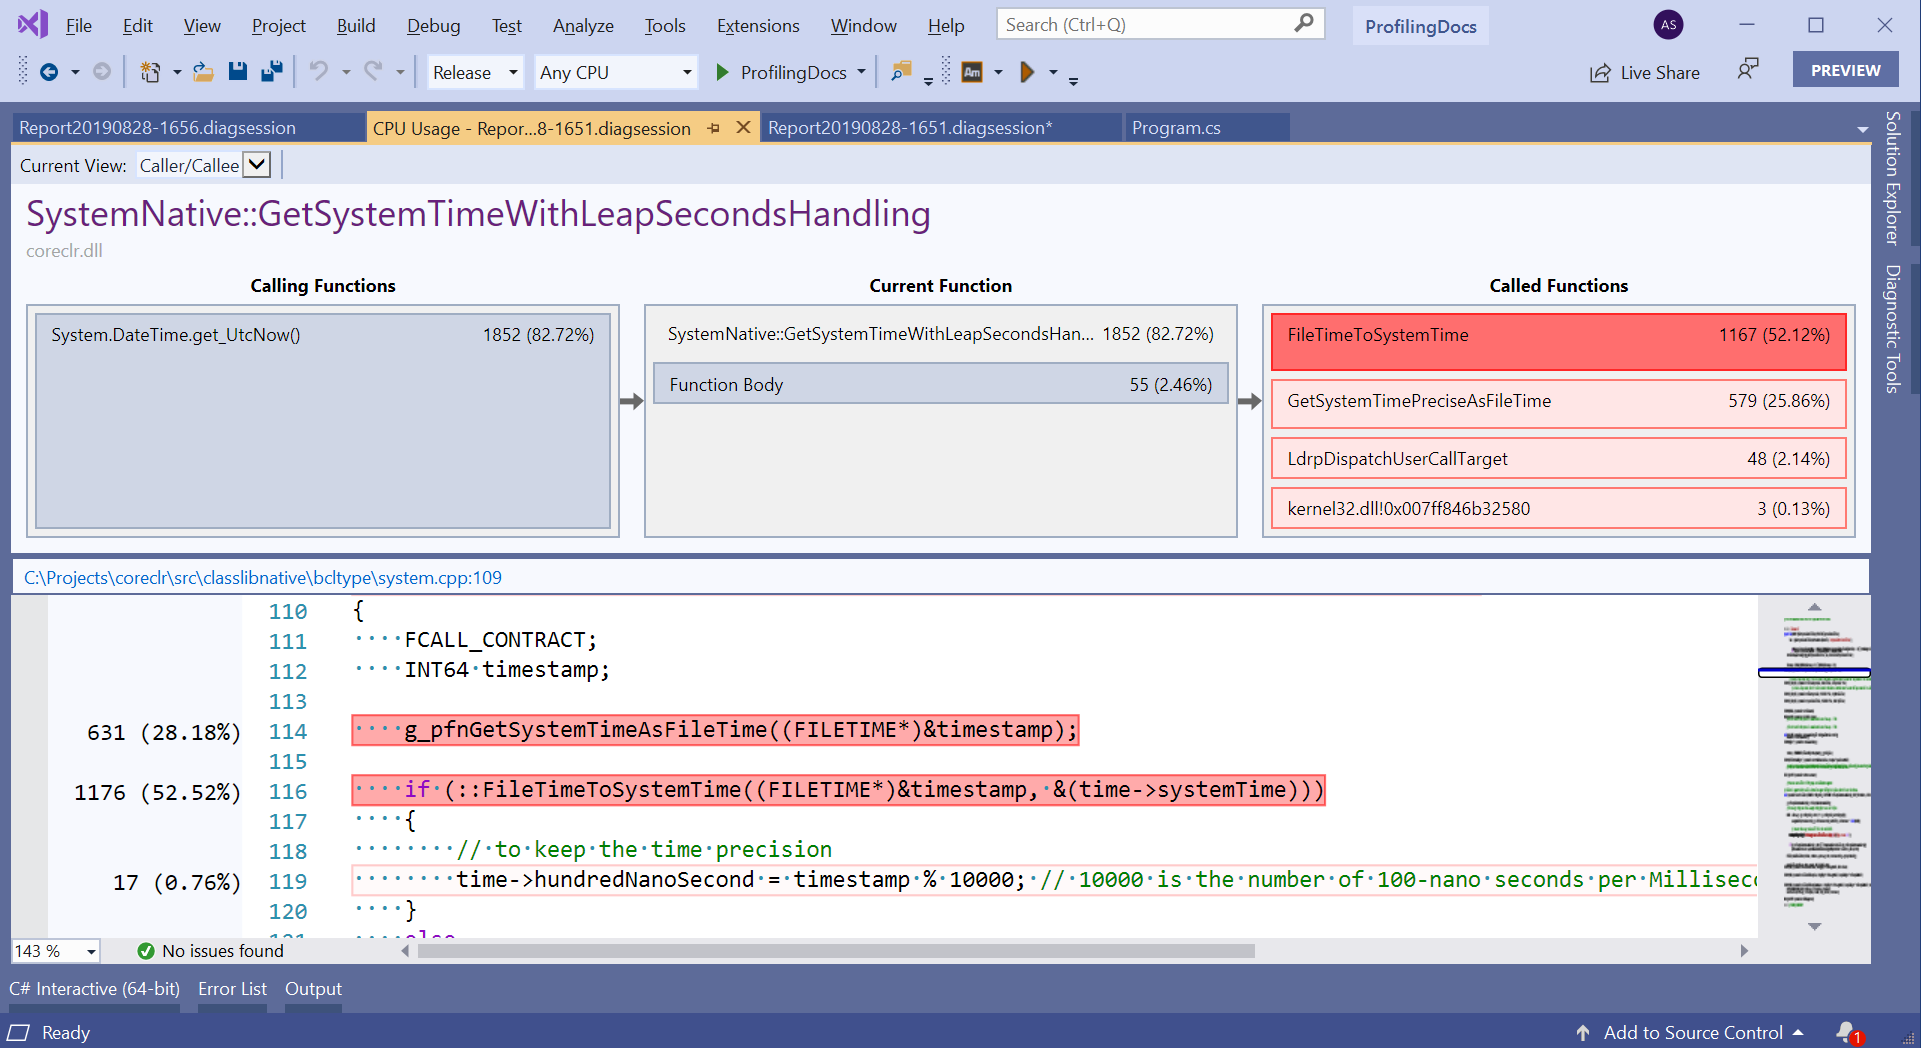
If you have configured everything properly you are able to see the CPU time spent per source code line!
If you prefer to use CoreRun instead of dotnet you need to select Launch an executable
And provide the neccessary arguments (path to the compiled repro dll):
The alternative is to run the repro app using CoreRun yourself and use VS Profiler to attach to a running process:
Since DateTime.UtcNow does not allocate managed memory, we are going to profile a different app:
using System.Runtime.CompilerServices;
using System.Security.Cryptography;

namespace ProfilingDocs
{
    class Program
    {
        static void Main()
        {
            for (int i = 0; i < 100_000; i++)
            {
                Consume(CryptoConfig.CreateFromName("RSA"));
            }
        }

        [MethodImpl(MethodImplOptions.NoInlining)]
        private static void Consume<T>(in T _) { }
    }
}
To track memory allocation you need to check .NET Object Allocation Tracking in the performance wizard and click Start.
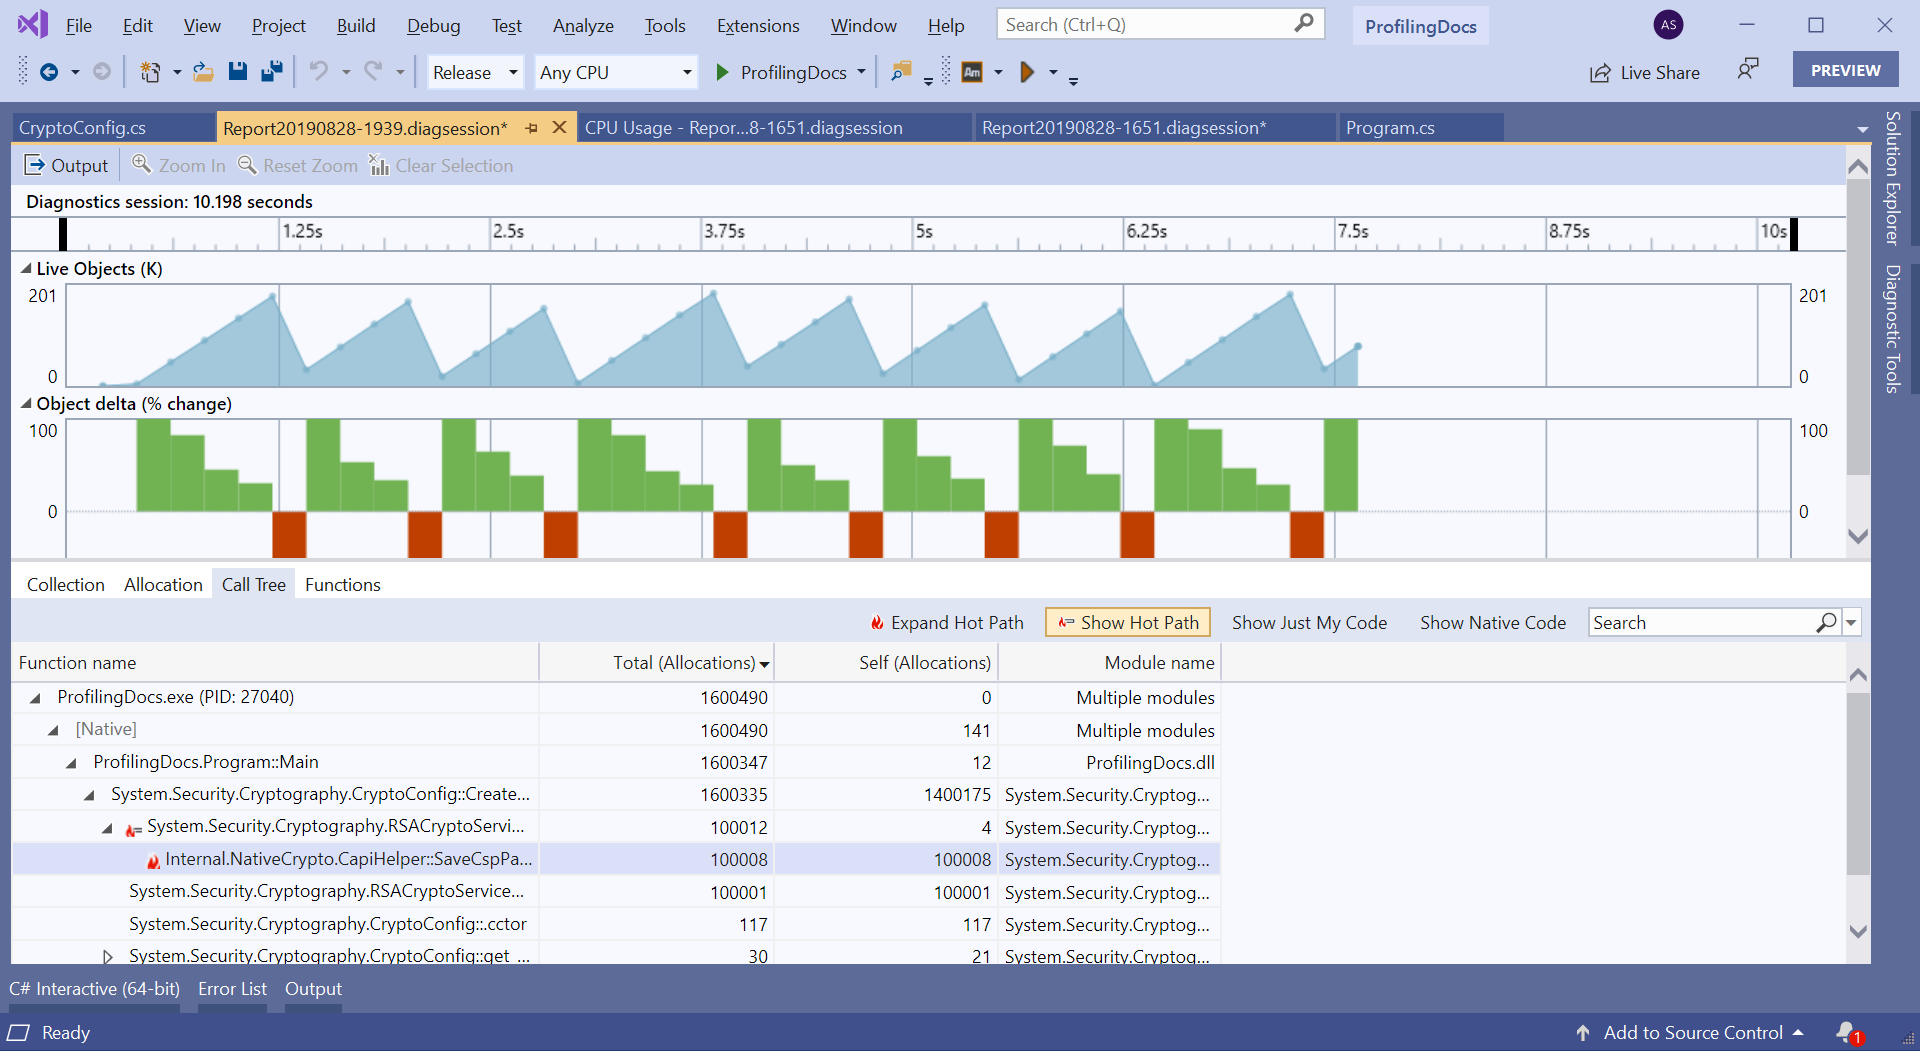
The reported results contain information about all allocated .NET objects.
Again, if you have configured everything properly you are able to right click on method name and Go to Source File!
PerfView is the ultimate .NET Profiler and if you are new to PerfView it's recommended to read it's tutorial or watch the tutorial videos.
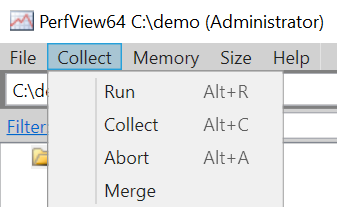
We can Collect profile data by either Running a standalone executable (or command) or Collecting the data machine wide with explicit start and stop.
When profiling local dotnet/runtime build it's recommended to Run a standalone repro app using CoreRun.
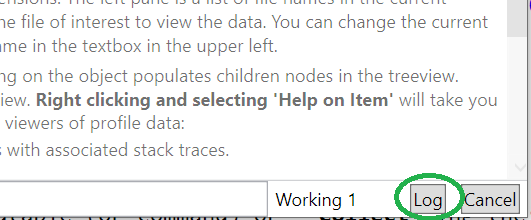
If for some reason PerfView fails to run the command you need to click the Log button in left bottom corner and read the logs to find out what happened.
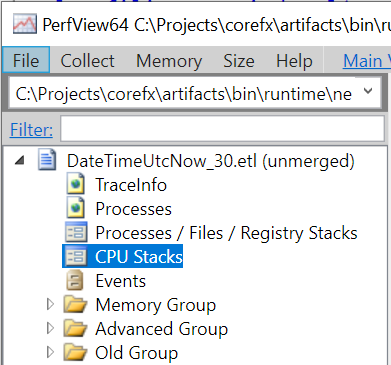
Once PerfView finishes the run you need to open the CPU Stacks
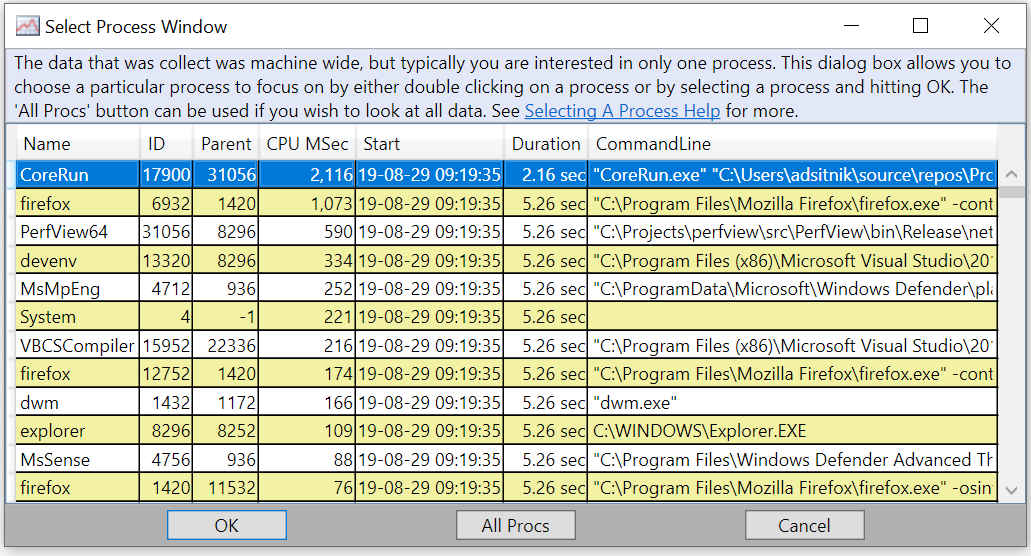
By default PerfView collects the profile data machine wide. Once you click on the CPU Stacks it shows you a window with the list of processes active during profile session. It sorts the processes descending by CPU time so the most active processes are at the top. You just need to select CoreRun and click OK.
Once you do that it opens the CPU Stacks window with the default filtering applied.
The first thing you need to do is to make sure that you have at least a few 1000 samples (preferably over 5000) and that the process is actually CPU bound.
The Metric/Interval is a quick measurement of how CPU bound the trace is as a whole. A value of 1 indicates a program that on average consumes all the CPU from a single processor. Unless that is high, your problem is not CPU (it can be some blocking operation like network/disk read).
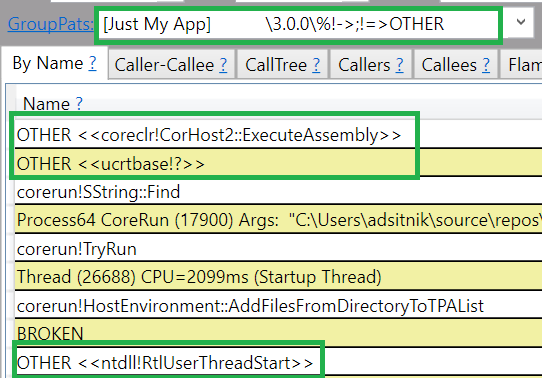
Fundamentally, what is collected by the PerfView profiler is a sequence of stacks. A stack is collected every millisecond for each hardware processor on the machine. This is very detailed information and hence by default PerfView groups the stacks. This is very useful when you are profiling a real-world application in a production environment, but when you work on the .NET Team and you profile some simple repro app you care about all details and you don't want the results to be grouped by modules.
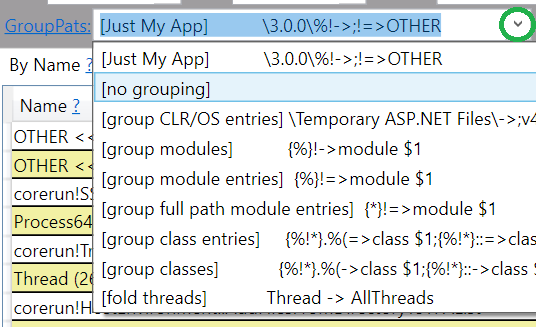
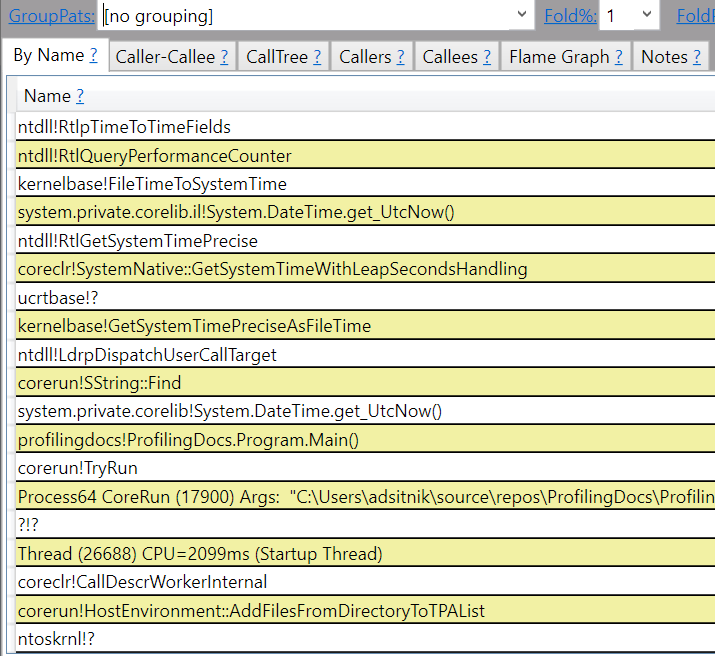
This is why you should disable the grouping by selecting [no grouping] item from GroupPats combo box. If you want to learn more about GroupPats just click on it (it looks like a web link and it opens help).
Now you can see much more details:
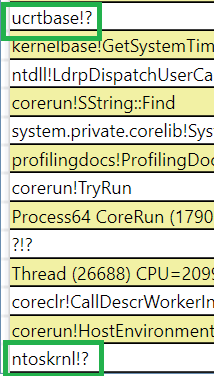
But some of the results contain !? which means unsolved symbols.
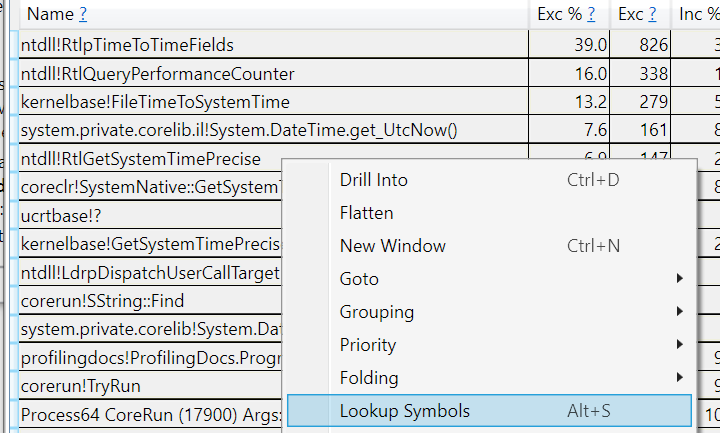
To solve the symbols you just need to select given names, right click and choose Lookup symbols. You can also just press Ctrl+A (select all) and Alt+S (Lookup symbols).
PerfView does an excellent job at solving symbols. It's capable of solving not only the app code symbols but also .NET Runtime and Windows OS symbols. It's one of the moments when it shines compared to other profilers that very often struggle with that.
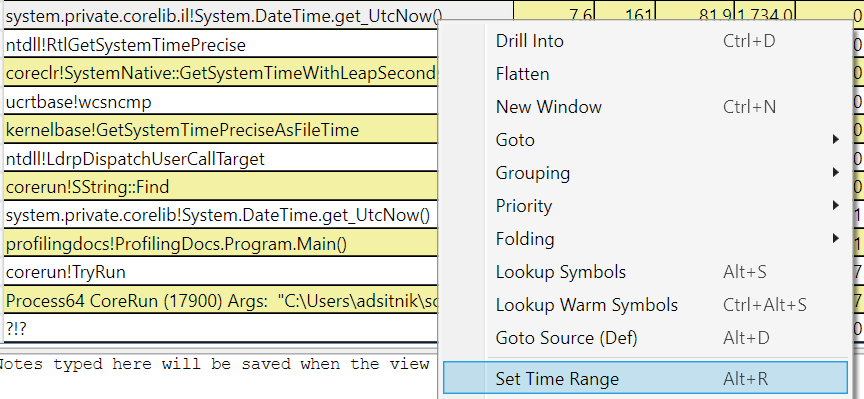
When we are using the Collect -> Run option PerfView profiles entire process lifetime. It's very useful when you are interested in things like .NET Runtime startup performance. But typically you just care about specific method. So the next thing you need to do is to set the Time Range. You can do that by selecting the interesting method, right clicking and choosing Set Time Range. Or just pressing Alt+R.
As you can see, all the methods that were executed before the first and after last call to DateTime.UtcNow got filtered out:
When - This is a visualization of how the INCLUSIVE samples collected for that node vary over time. The total range (from the Start and End text boxes), is divided into 32 time 'TimeBuckets' and the inclusive samples for that node are accumulated into those 32 buckets. Each bucket is then represented as a digit that represents a scaled value.
This simple text representation of histogram can be very useful when profiling more complex scenarios, but in this case it just shows us that DateTime.UtcNow was executed all the time. But this is exactly what we wanted!
Once we get the data filtered we can start the analysis.
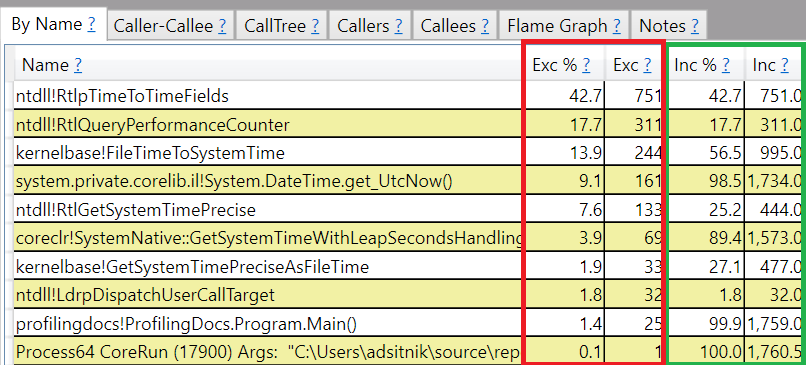
The By Name tab contains the list of all methods captured during profile time. This list is by default sorted in descending order by Exclusive CPU time. It means that the most expensive methods which perform actual CPU computation are at the top of the table. These are the methods you care about.
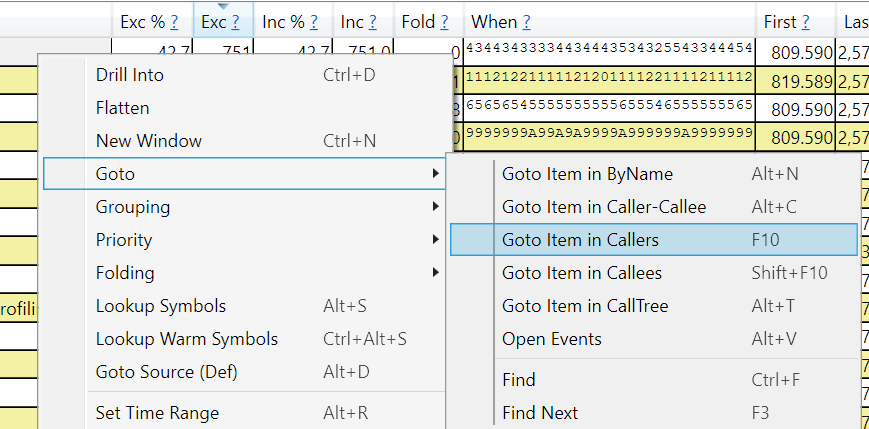
To find out who is calling the most time consuming method you can right click on it and select Goto -> Goto Item in Callers or just press F10.
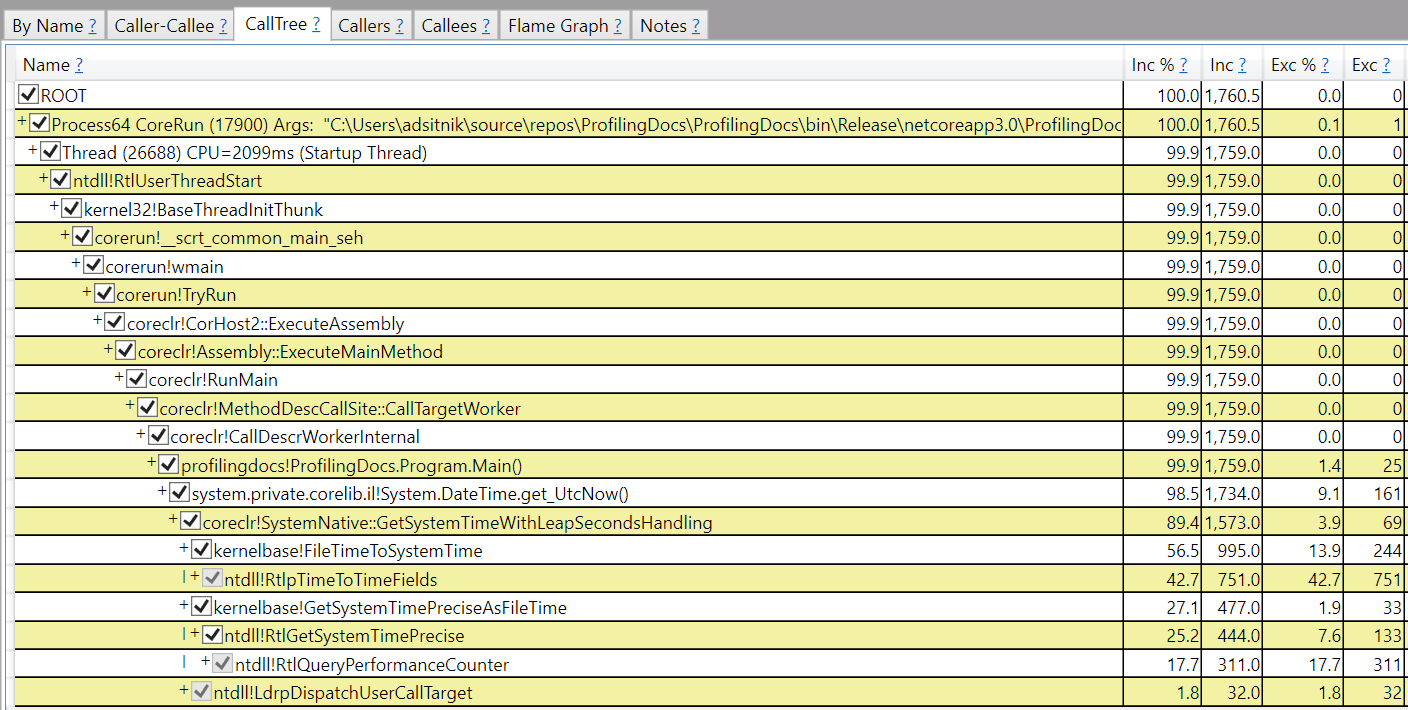
If you wish you can see the entire Call Tree by clicking on the Call Tree tab:
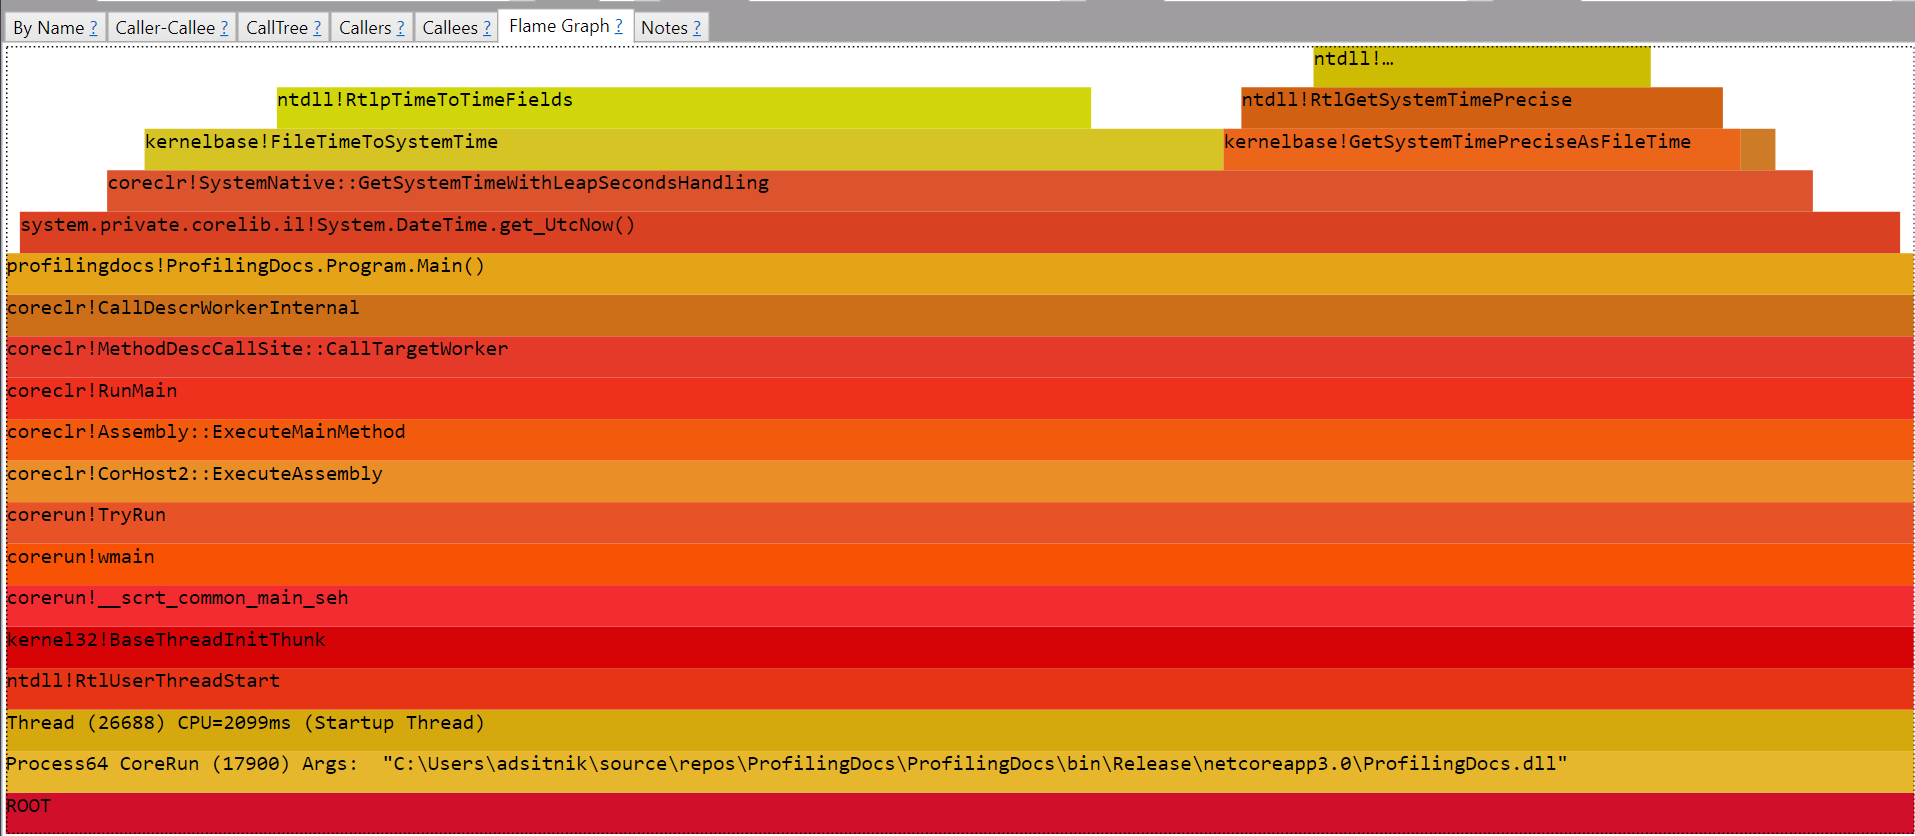
Flame Graph offers you a different form of visualization::
The graph starts at the bottom. Each box represents a method in the stack (inclusive CPU time). Every parent is the caller, children are the callees. The wider the box, the more time it was on-CPU.
For the leaf nodes the inclusive time == exclusive time. The difference between the parent and children box width (marked with red on the image below) is the exclusive parent (caller) time.
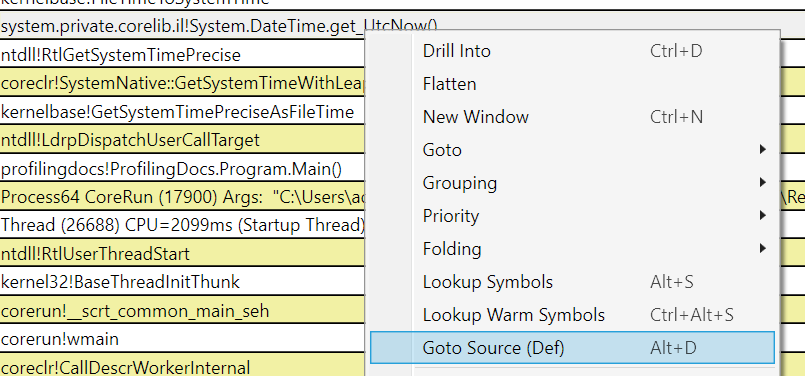
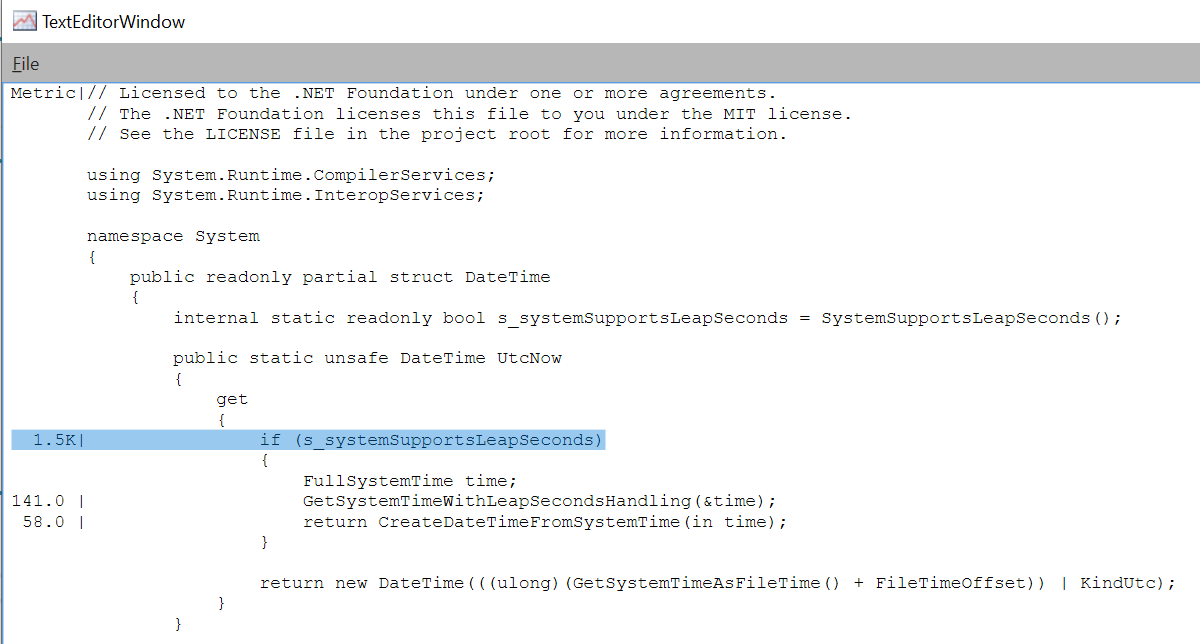
parent.InclusiveTime - children.InclusiveTime = parent.ExclusiveTimeIf you want to view the Source Code of the given method you need to right-click on it and select Goto Source (Def) menu item. Or just press Alt+D.
If PerfView fails to show you the source code you should read the Log output. If you are unable to make it work and you really care about it you should switch to Visual Studio Profiler.
Note: As of today, PerfView keeps the .pdb files opened after showing the source code. It means that if you keep the trace file opened in PerfView and try to rebuild dotnet/runtime the build is going to fail. You might need to close PerfView to rebuild dotnet/runtime.
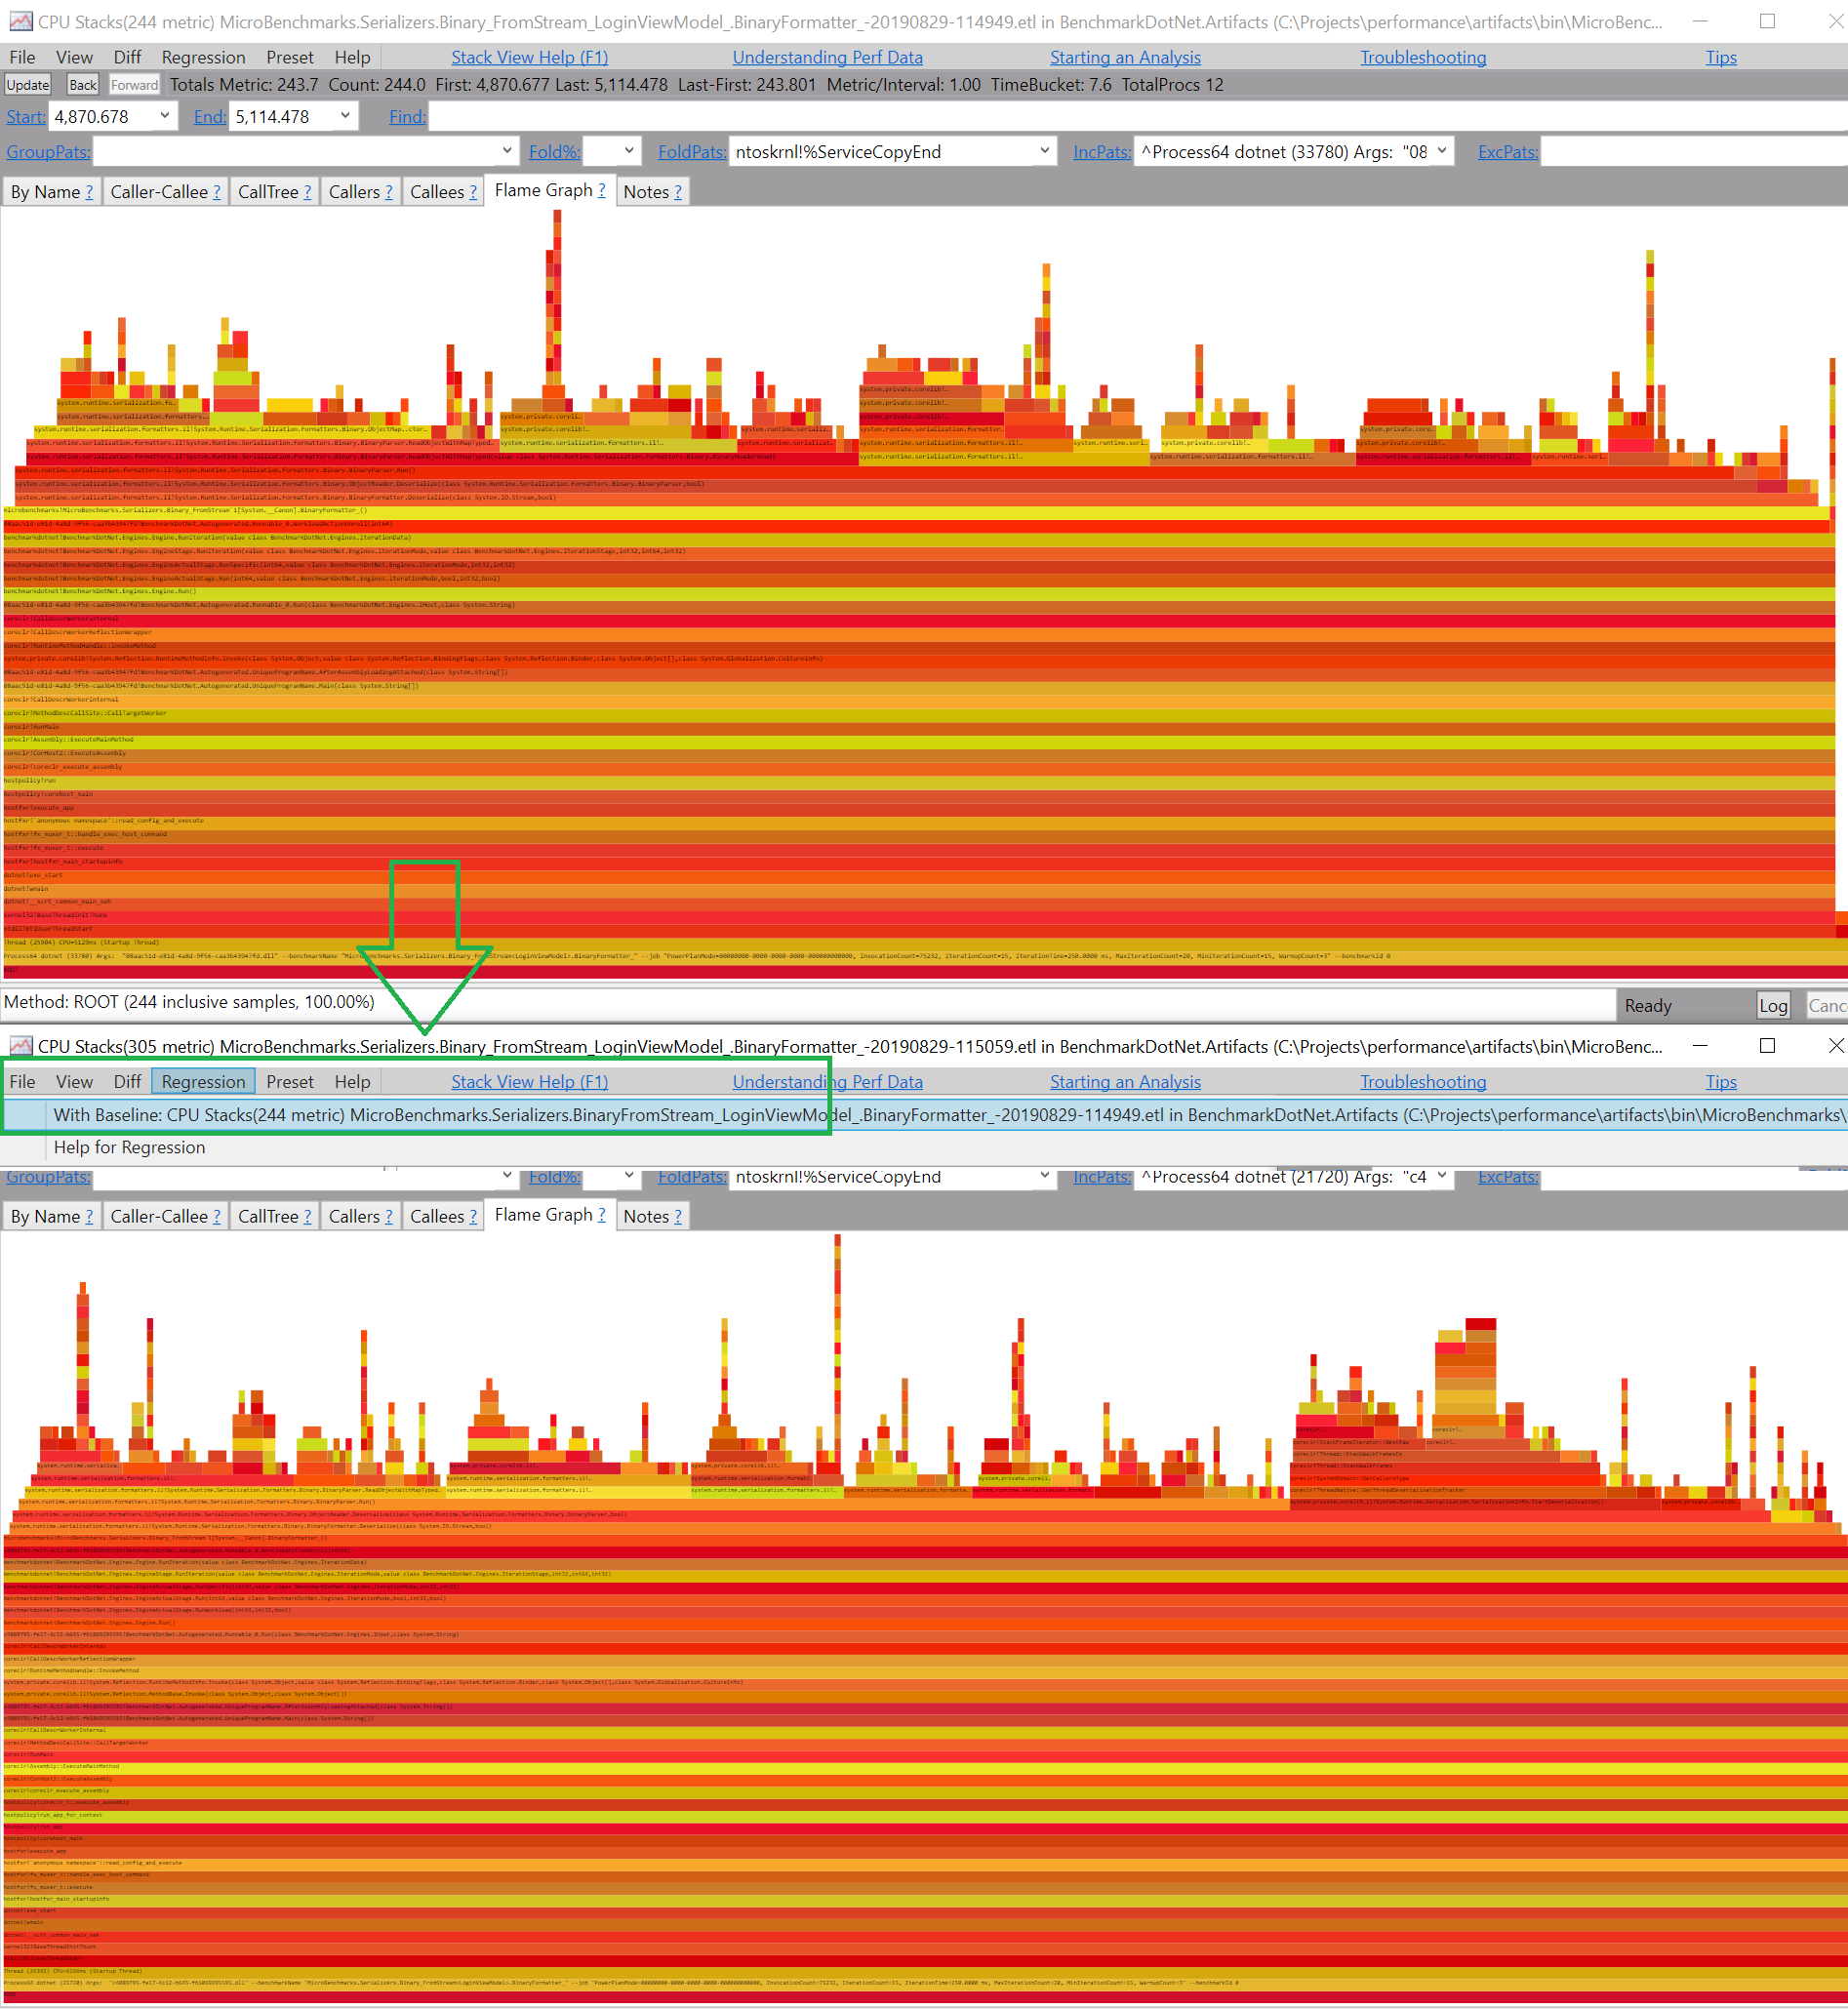
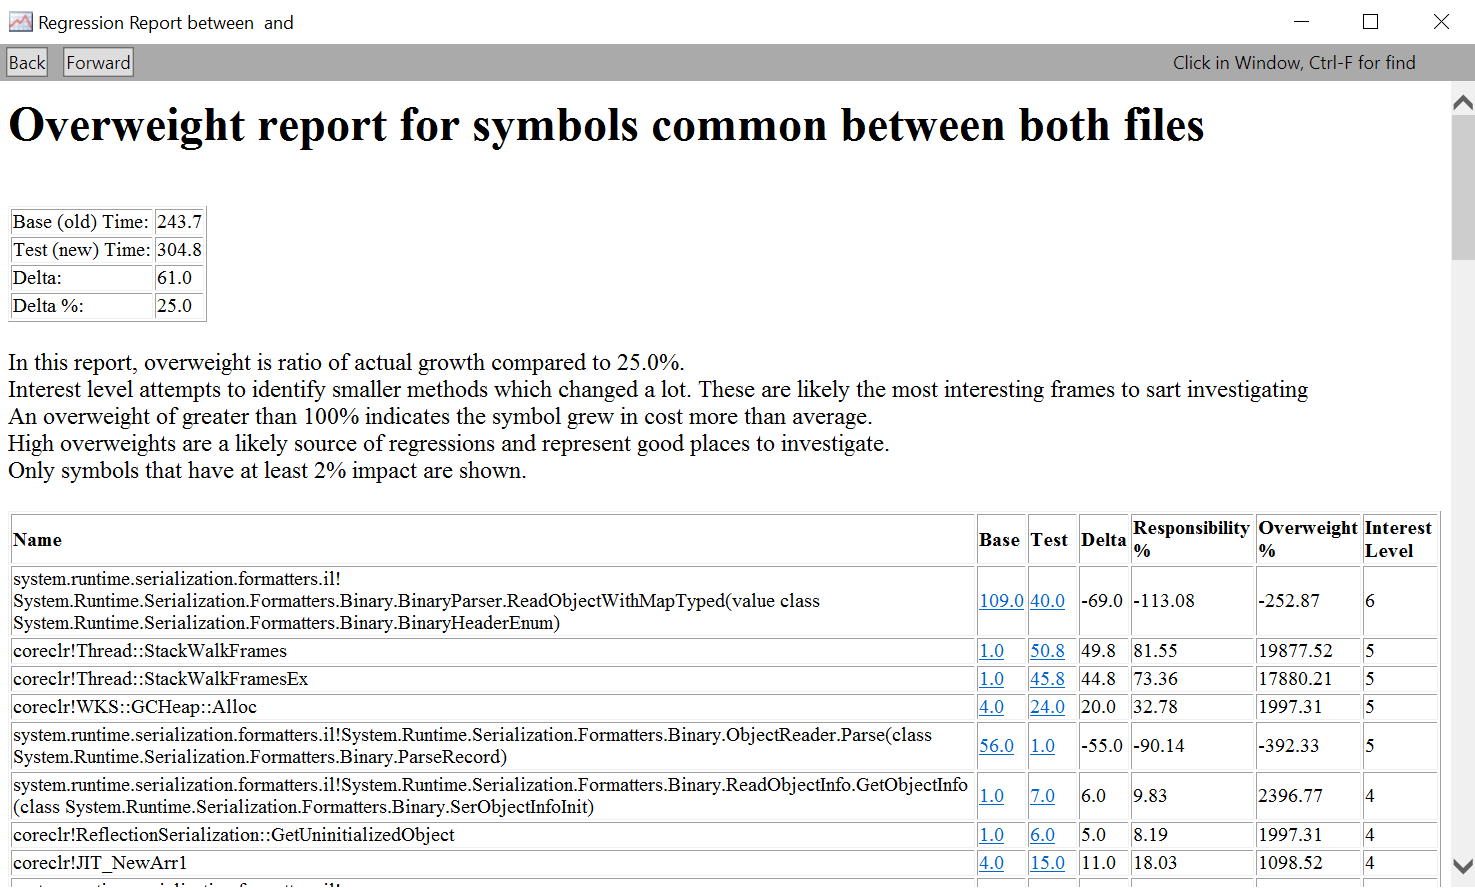
PerfView has a built-in support for identifying regressions. To use it you need to:
- profile two different versions of .NET Core running exact same C# code
- open both trace files in PerfView and apply exactly the same filters
- choose
Regression -> With Baselinefrom the top Menu
It's recommended to use it instead of trying to eyeball complex Flame Graphs.
Intel VTune is a very powerful profiler that allows for low-level profiling:
- provides micro-architecture specific analysis
- identifies hot spots and bottlenecks
- utilizes MSRs to get additional low-level hardware information
VTune supports Windows, Linux and macOS!
Let's use PerfView to profile the following app that tries to reproduce Potential regression: Dictionary of Value Types #25842:
using System.Collections.Generic;
using System.Linq;
using System.Runtime.CompilerServices;

namespace ProfilingDocs
{
    class Program
    {
        const int LastElement = 512;

        static void Main()
        {
            Dictionary<int, int> dictionary = Enumerable.Range(start: 0, count: LastElement).ToDictionary(x => x);

            ActualJob(dictionary);
        }

        [MethodImpl(MethodImplOptions.NoInlining)]
        private static bool ActualJob(Dictionary<int, int> dictionary)
        {
            bool result = false;

            for (int i = 0; i < 3_000_000; i++)
            {
                for (int notFound = LastElement + 1; notFound < LastElement * 2; notFound++)
                {
                    result ^= dictionary.TryGetValue(notFound, out _);
                }
            }

            return result;
        }
    }
}
PerfView tells us that 70% of exclusive CPU time was spent in FindEntry method:
Once we open the source code of FindEntry method we can see that:
- there are two execution paths based on whether
IEqualityComparer<TKey>was provided or not (comparer == null) - there is a separate execution path for Value Types (
default(TKey)! != null) and another for reference types - JIT can devirtualize the calls to
EqualityComparer<TValue>.Defaultintrinsic. It means that calls toEqualsandGetHashCodecan get inlined. Which means that neither VS Profiler or PerfView are going to be able to assign profile samples to source code of the inlined method (the samples are going to be assigned to inlinee -FindEntrymethod).
When we open the Flame Graph we can see that the Call Stack ends at FindEntry method. So Equals and GetHashCode got devirtualized and inlined.
You should start every investigation with VS Profiler or PerfView. When you get to a point where you clearly need information on CPU instruction level and you are using Intel hardware, use VTune.
Run VTune as Administrator|sudo and click New Project:
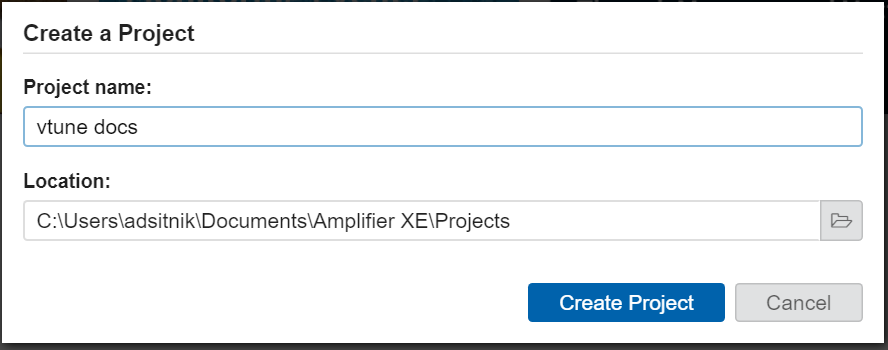
Provide the project name and click Create Project:
Specify path to CoreRun and provide the path to repro library as a parameter:
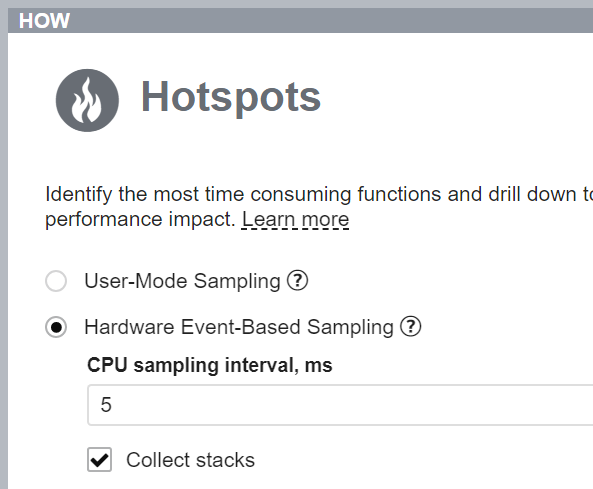
Choose Hardware Event-Based Sampling and check Collect Stacks:
Note: to Hardware Event-Based Sampling is available only if you don't have virtualization enabled. You might gonna need to reboot your PC and disable virtualization in BIOS to get it working.
Important: It's recommended to use Hardware Event-Based Sampling for small repro apps that run shorther that one minute. If you use User-Mode Sampling VTune might fail to recognize the module and assign vast majority of the profile samples (and CPU time) to [Outside any know module].
Now you are good to go! Just click the start button:
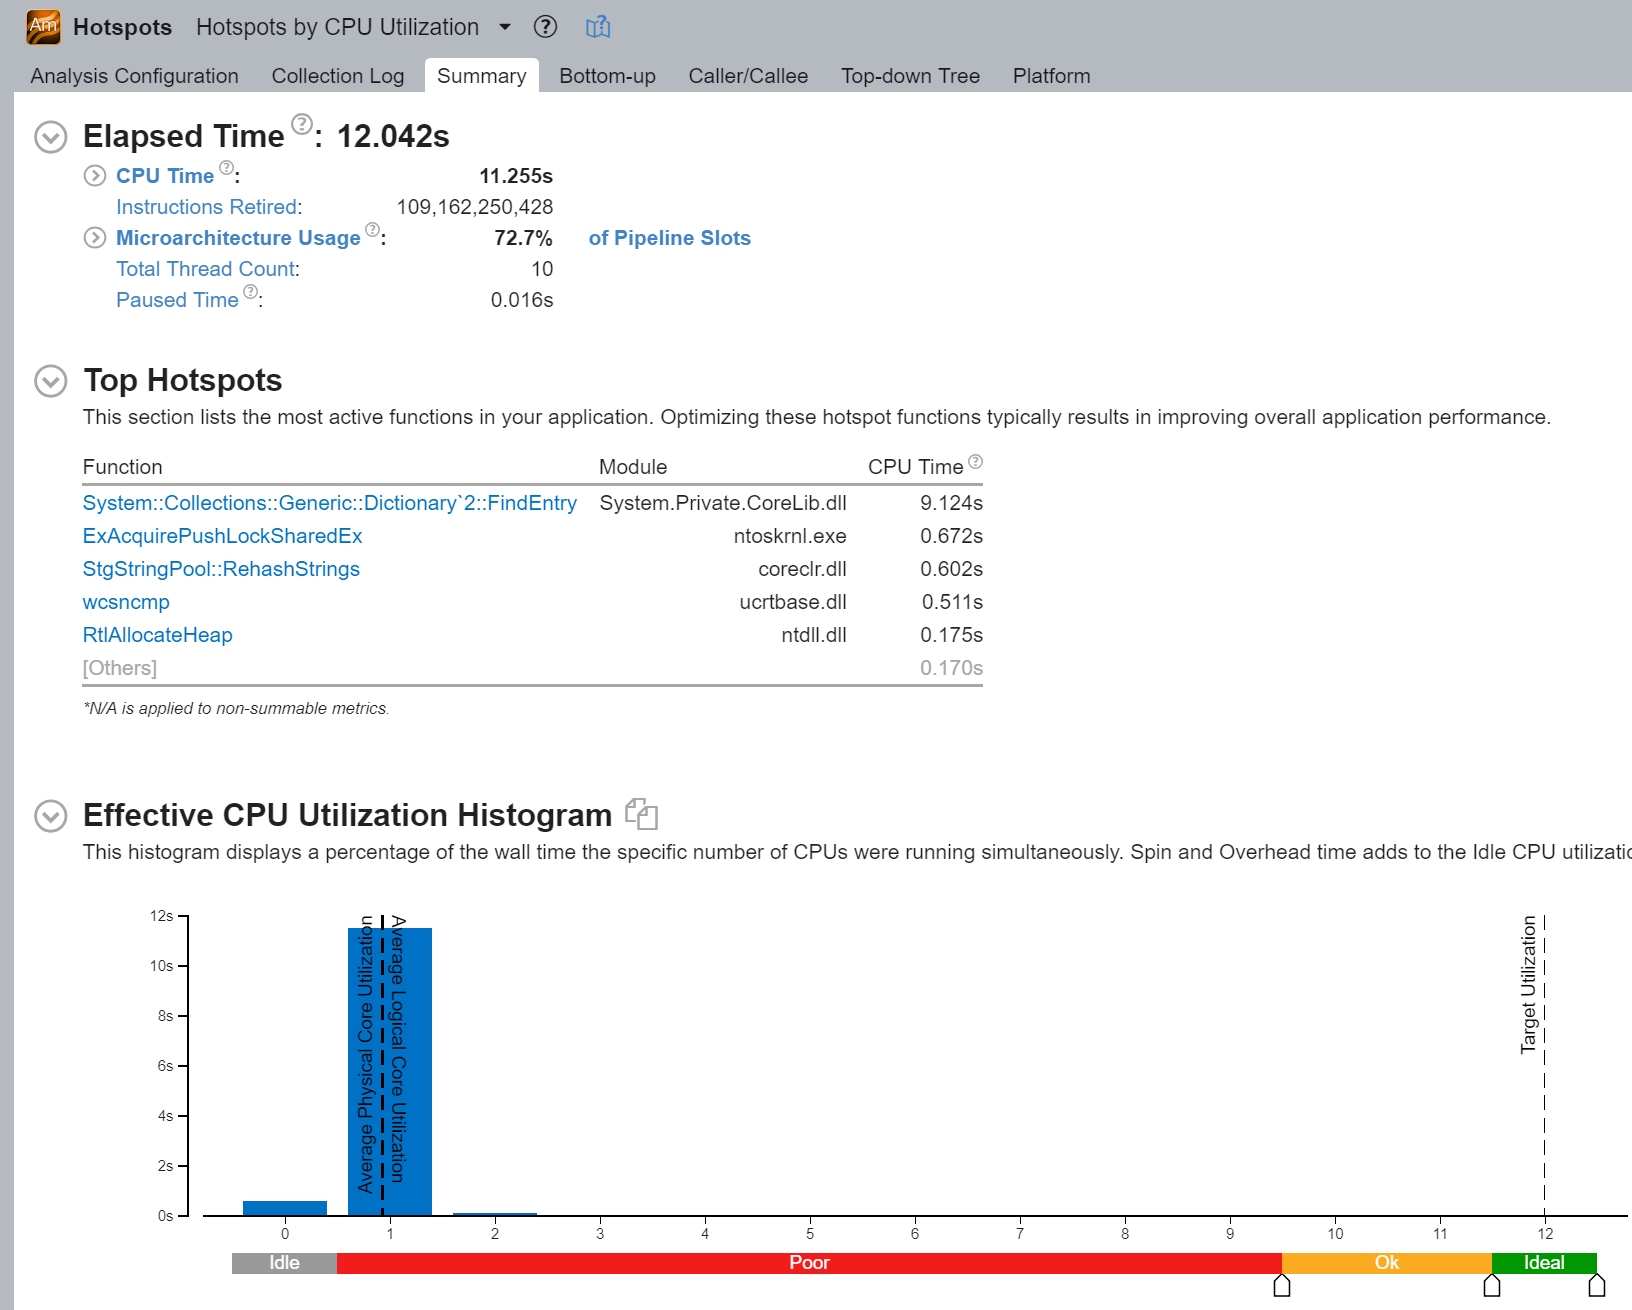
VTune is going to run provided app and display a summary after it's done processing the profile data:
Similar to PerfView, when we use Start button VTune profiles entire process lifetime. Since this time we are not interested in .NET Runtime startup performance we need to filter the profile. You can do that by selecting the interesting method, right clicking and choosing Filter in by Selection:
As you can see, we've filtered out a lot of noise and now ActualJob is 100% of the inclusive time.
We can now sort the methods by exclusive time by clicking on the CPU Time: Self column name:
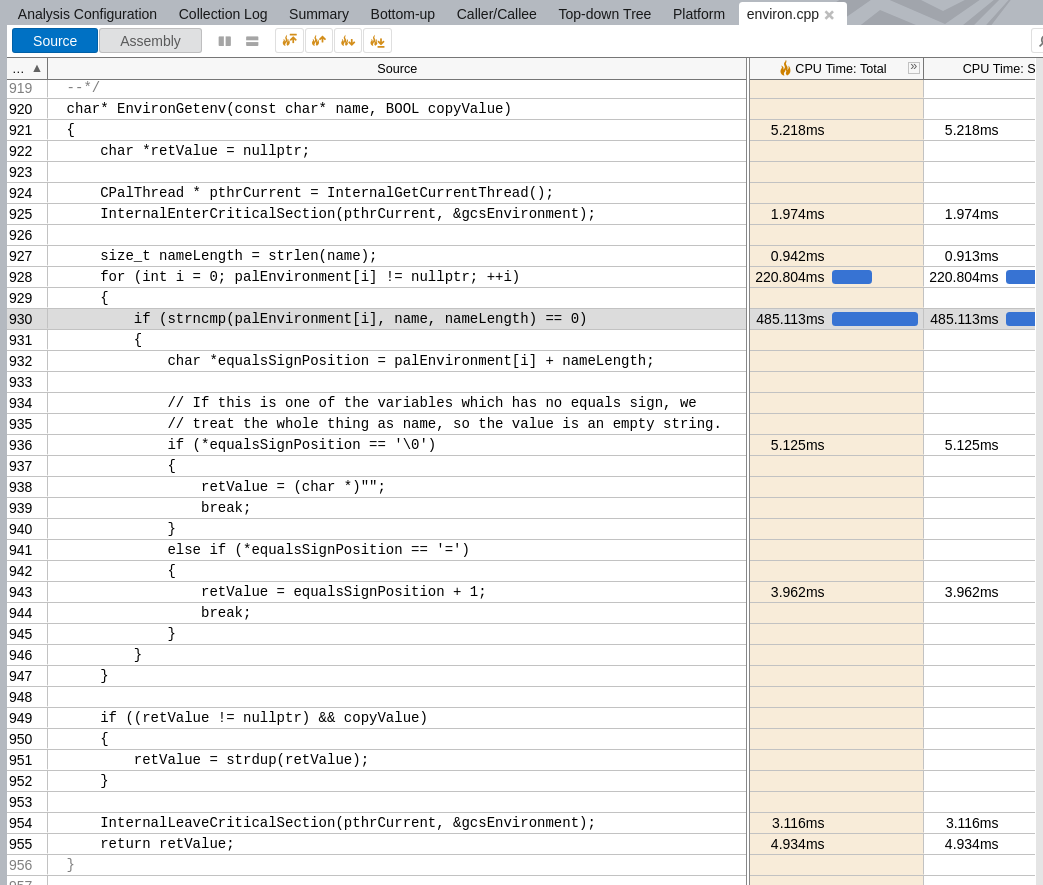
Right click on the most expensive method and choose View Source:
Which shows us that 6.68s out of 9.390 (ActualJob inclusive CPU time) was spent for modulo operation!
To go to the next hotsopot you can to click the Go to Smaller Function Hotspot button:
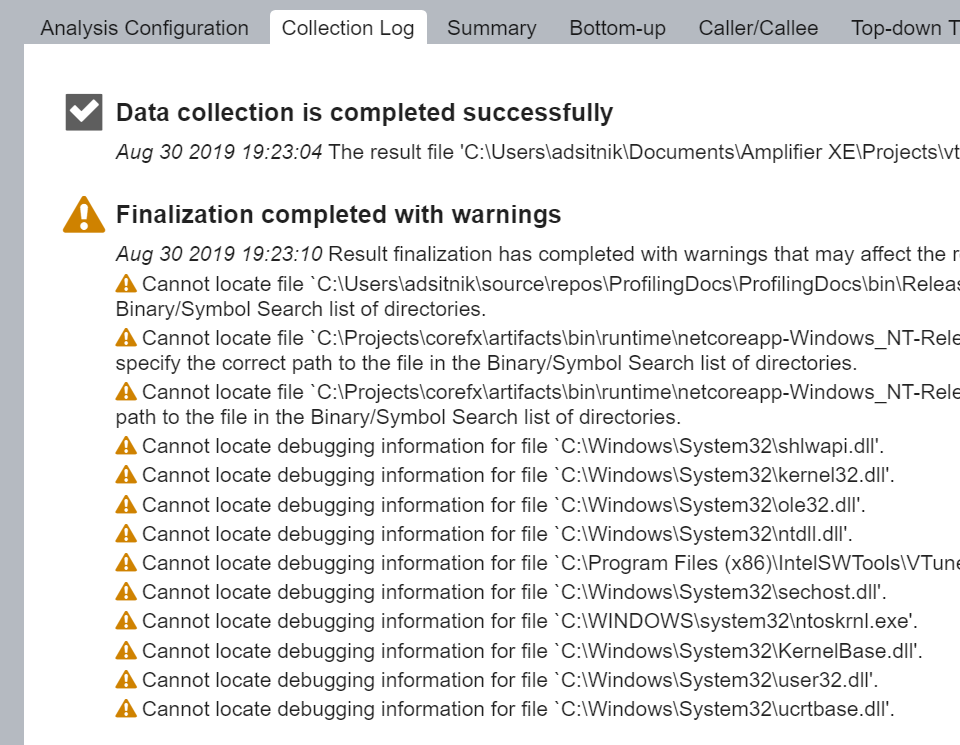
If you ever run into any problem with VTune, you should check the Collection Log:
If the error message does not tell you anything and you can't find any similar reports on the internet, you can ask for help on the Intel VTune Amplifier forum.
VTune is capable of showing not only the output assembly code but also native and managed source code.
If it ever fails to show the source code (the Source button is then greyed out), you can click on the Search Sources/Binaries button and specify additional folders that should be searched for symbol and source files.
Note: According to the VTune docs, the search is non-recursive. So adding just dotnet/runtime repo root folder to the list is not enough.
Hardware Event-Based Sampling is vulnerable to skids. When the event occurs, the counter increments and when it reaches the max interval value the event is fired with current Instruction Pointer. As an example we can use following source code:
bool result ^= dictionary.TryGetValue(notFound, out _);The profiler shows that a lot of inclusive CPU time was spent on the xor operation. Obviously, it's not true and it was most probably spent in the call to TryGetValue method. It means that to fully understand the output of Hardware Event-Based Sampling profilers you also need to be familiar with assembly code.
VTune works great on Linux and as of today it's the only fully featured profiler that works with .NET Core on Linux.
It works best when installed and run as sudo:
sudo ./install_GUI.sh
cd /opt/intel/vtune_amplifier_2019/bin64
sudo ./amplxe-gui
It can show CPU time per C++|C# source code line:
It's capable of solving both managed and native symbols:
It can show the disassembly of profiled methods:
PerfCollect is a simple, yet very powerful script that allows for profiling .NET Core apps on Linux. It is internally leveraging LTTng and using perf.
In contrary to dotnet trace it gives you native call stacks which are very useful when you need to profile native parts of dotnet/runtime.
It has it's own excellent documentation (a highly recommended read), the goal of this doc is not to duplicate it, but rather show how to profile local dotnet/runtime build running on a Linux VM from a Windows developer machine. We need two OSes because as of today only PerfView is capable of opening a PerfCollect trace file.
You need to install the script, make it an executable and run as sudo with install parameter to install all the dependencies.
curl -OL https://aka.ms/perfcollect
chmod +x perfcollect
sudo ./perfcollect installBefore you collect a trace, you need to prepare a Repro. as of today, perfcollect does not give you the possibility to run a standalone executable. it collects the data machine wide with explicit start and stop. the simplest way to create a repo app is to simply put the code that you want to profile inside a while(true) loop.
As an example, we are going to use following app that tries to reproduce String.StartsWith slower on Linux with some characters #40674
using System;
using System.Runtime.CompilerServices;

namespace ProfilingDocs
{
    class Program
    {
        static void Main()
        {
            Console.WriteLine("Started running. Press Ctrl+C to stop.");

            while (true)
            {
                Consume(string.Concat(new string('a', 512), "-").StartsWith("i"));
            }
        }

        [MethodImpl(MethodImplOptions.NoInlining)]
        private static void Consume<T>(in T _) { }
    }
}
Note: You can just build the repro app on your Windows dev machine and copy the output app to your Linux VM using scp.
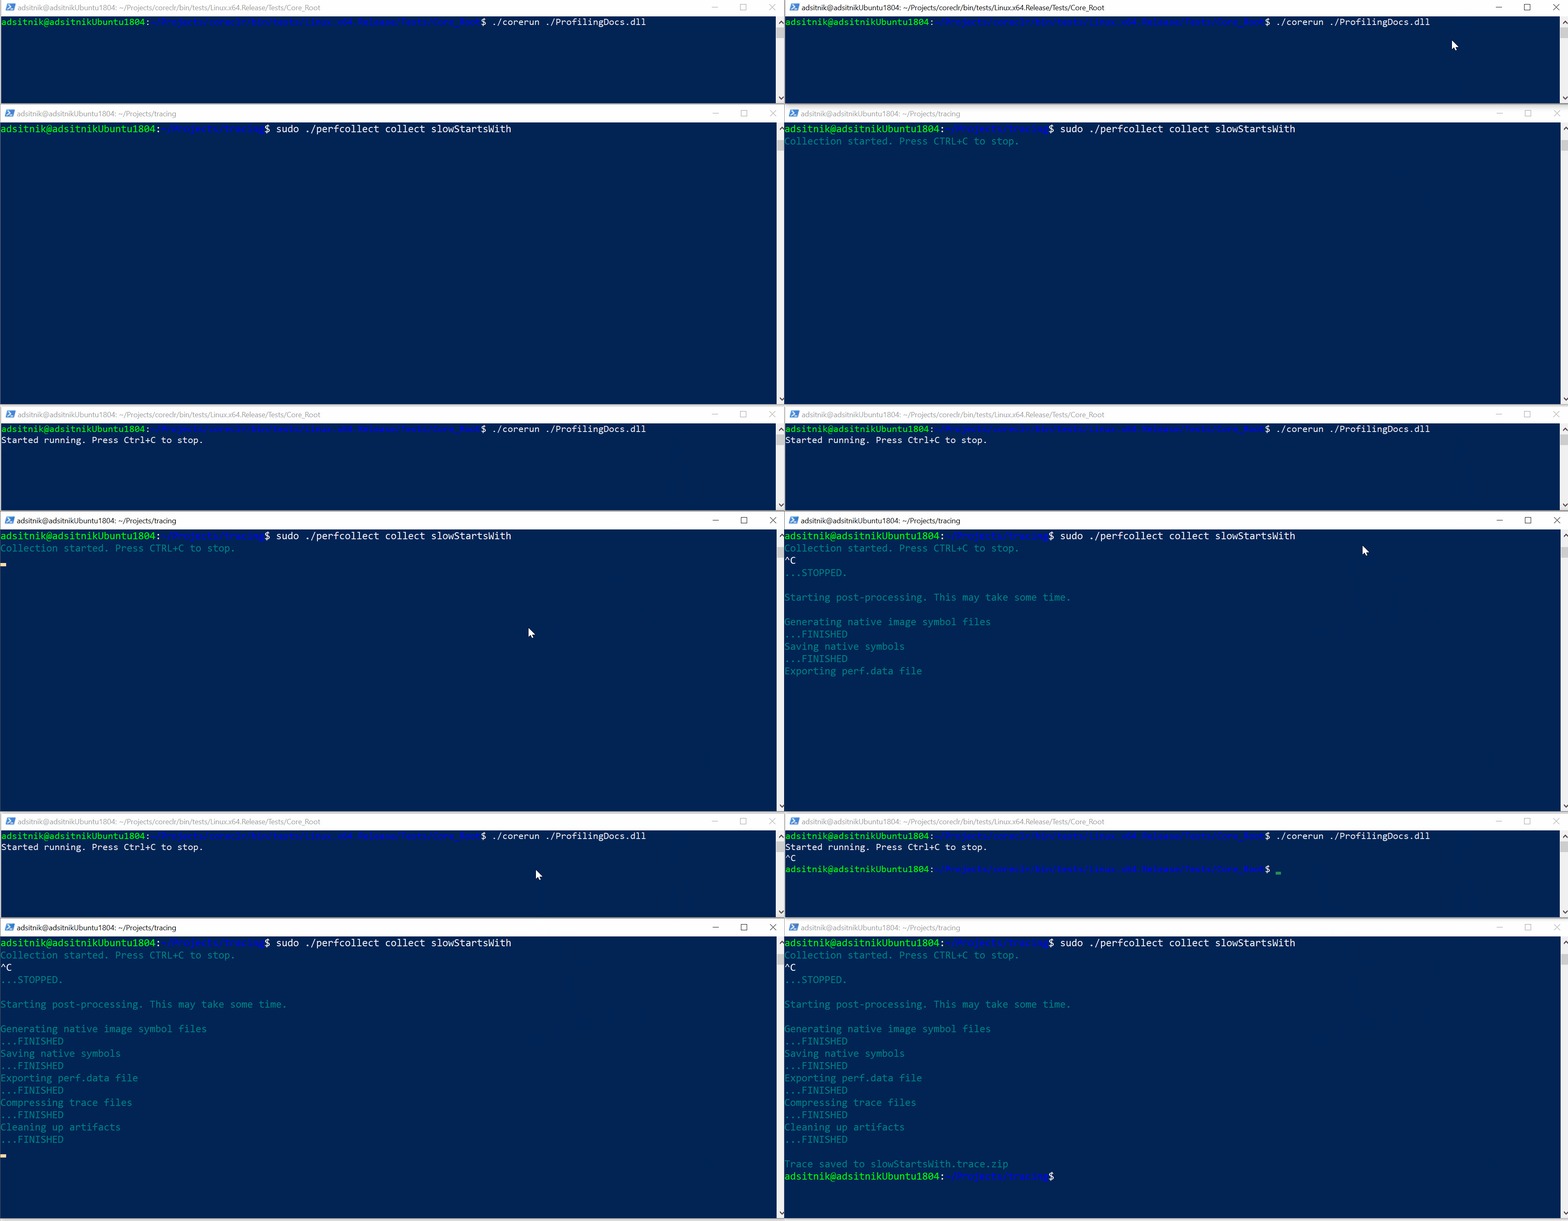
scp -r "C:\Users\adsitnik\source\repos\ProfilingDocs\ProfilingDocs\bin\Release\netcoreapp3.1\ProfilingDocs.dll" adsitnik@11.222.33.444:/home/adsitnik/Projects/coreclr/bin/tests/Linux.x64.Release/Tests/Core_Root/ProfilingDocs.dllTo collect a trace, you need to open two terminals:
- one for controlling tracing, referred to as [Trace]
- one for running the application, referred to as [App].
[App]: Setup the application shell - this enables tracing configuration inside of .NET Core:
export COMPlus_PerfMapEnabled=1
export COMPlus_EnableEventLog=1
[Trace] Start collection:
sudo ./perfcollect collect slowStartsWith[App]: Run the repro app using corerun. It's recommended to use corerun because it has crossgen required to solve native symbols in the same folder and hence native symbol solving is going to work out of the box:
cd /home/adsitnik/Projects/coreclr/bin/tests/Linux.x64.Release/Tests/Core_Root/
./corerun ./ProfilingDocs.dll
[Trace] Wait few seconds to let PerfCollect gather some samples and stop collection by pressing Ctrl+C in the trace terminal:
^C
...STOPPED.


Trace saved to slowStartsWith.trace.zip[App]: don't forget to stop your app by pressing Ctrl+C as well.
As mentioned previously, currently only PerfView is capable of opening a PerfCollect trace file. So to analyze the trace file you need to copy it to a Windows machine. You can do that by using scp.
scp -r adsitnik@11.222.33.444:/home/adsitnik/Projects/tracing/slowStartsWith.zip C:\traces\startsWithThe alternative is to use VTune which allows for profiling and analyzing profile information on Linux.
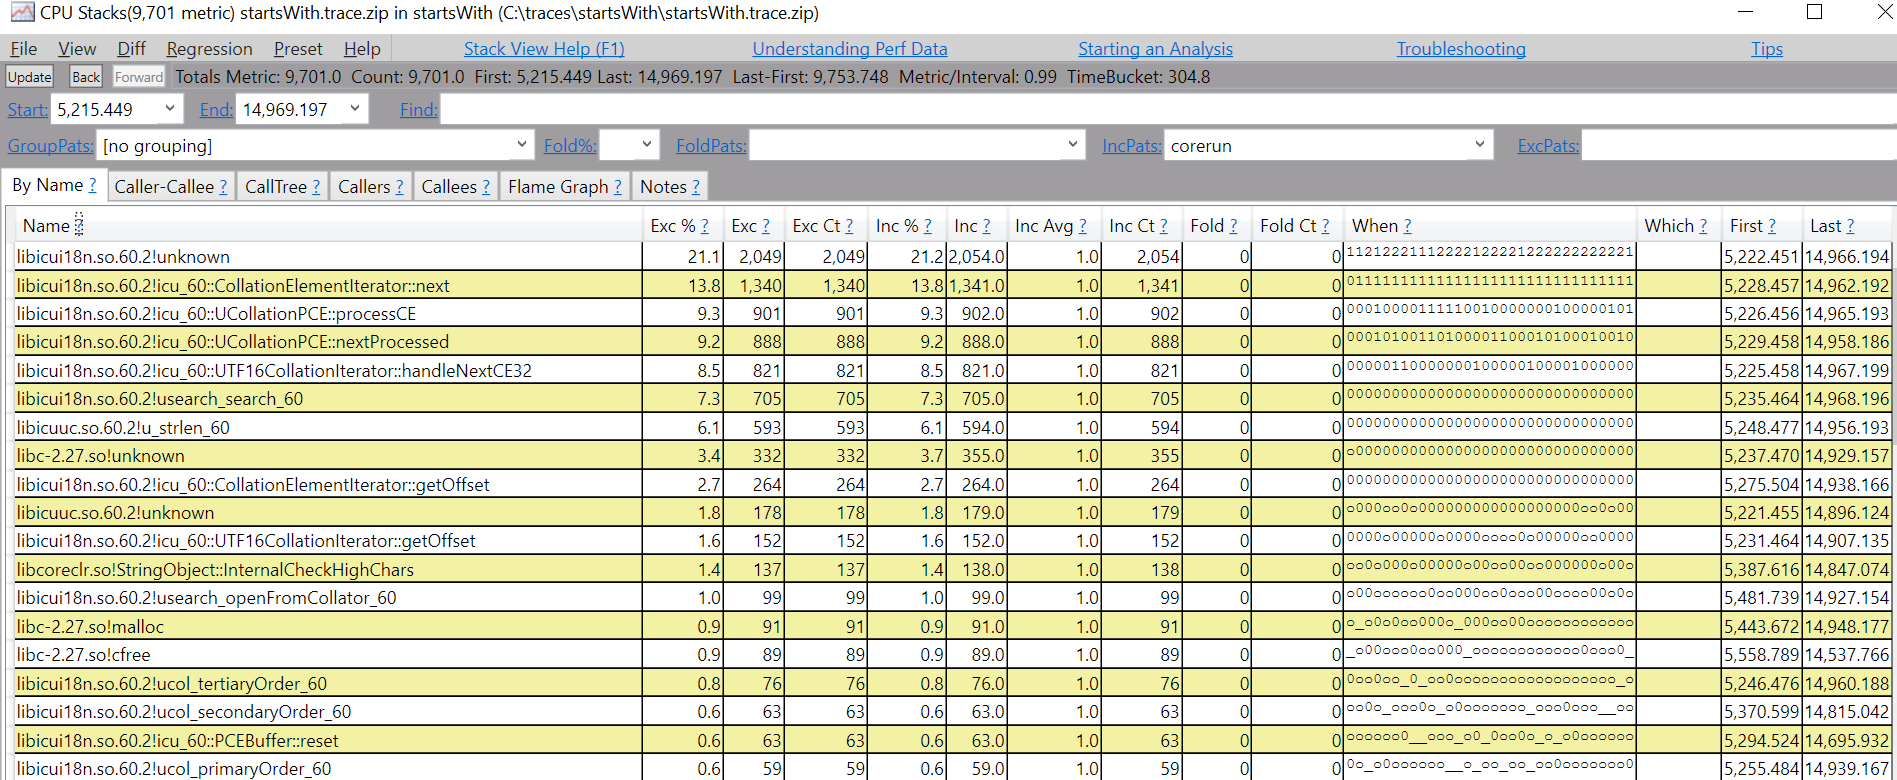
Once you get it there, you need to open it with PerfView and follow the filtering instructions to filter the trace and analyze the results.

