.. index:: monitor
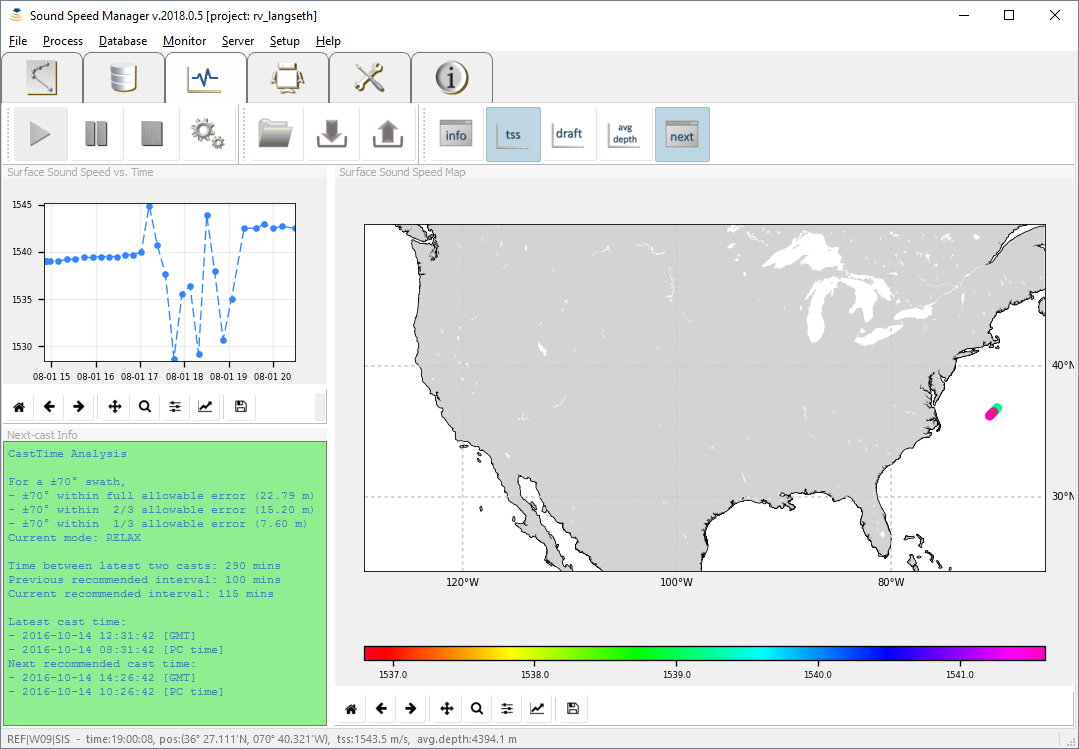
The Survey Data Monitor (:numref:`data_monitor_tool_tab`) has two main functionalities:
- Monitoring the survey data being collected (SIS required).
- Estimation of the time of the next cast (always available, but SIS information are used if present).
The default configuration uses the CastTime algorithm to estimate the time suggested for the next cast. CastTime analysis is based on the two latest casts from the Sound Speed Manager database (see :ref:`database_tab`).
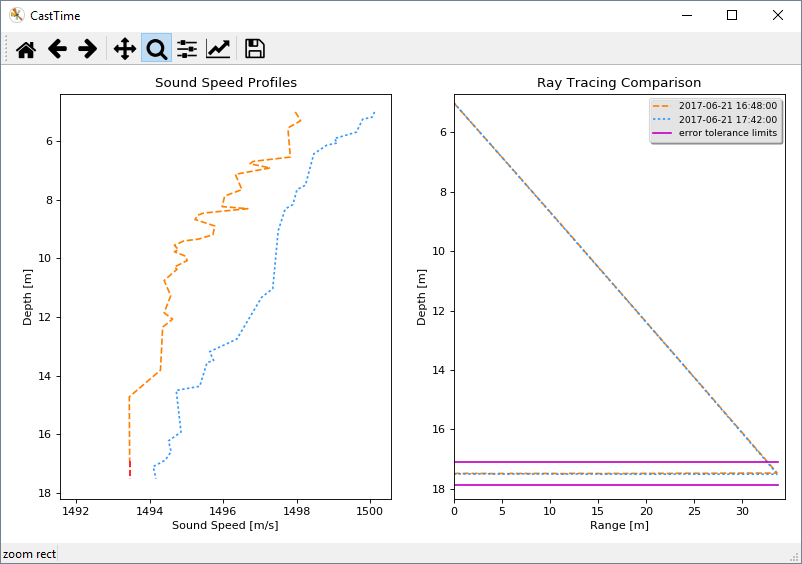
Example of analysis plot to display the error tolerance limits (in magenta on the right pane) used by CastTime to estimate the next cast time.
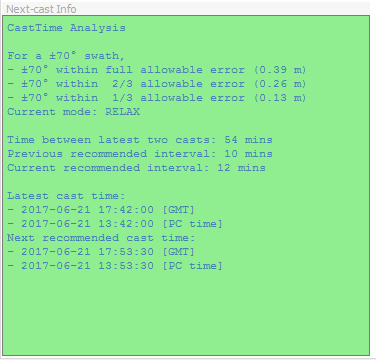
The background color in the Next-cast Info viewer (:numref:`data_monitor_tool_tab`) identifies three possible estimation states (calculated in function of the maximum allowable error):
- Steady state (blue): the casting interval is the same as in the previous estimation.
- Relax state (green): the previous casting interval was increased.
- Panic state (red): the previous casting interval was reduced.
Independently by the current estimation state, the Next-cast Info viewer starts to blink when the suggested next-cast time was reached, and there have not been newer casts stored in the database.
In the following sections, more details on how to use the Survey Data Monitor usage are provided.
The Data Monitor toolbar (:numref:`data_monitor_toolbar`) is used to start, pause, or stop the collection and the analysis of the survey data.
When SIS interaction is active, additional data (i.e., dynamic transducer draft, sound speed at transducer, and average depth across the sonar swath) are collected.
The collected monitoring data are stored in a survey database (.mon).
The Options button in the Data Monitor toolbar (:numref:`data_monitor_toolbar`) provides access to the setup, organized as follows:
- General tab (:numref:`data_monitor_option_general`).
- CastTime tab (:numref:`data_monitor_option_casttime`).
- ForeCast tab (currently disabled).
- Plots tab (:numref:`data_monitor_option_plots`).
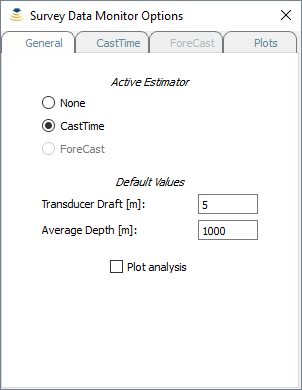
In the General tab, you can select the estimator to be used (ForeCast is currently disabled). You can also change the default values adopted by the estimator in case that SIS data are not available. When the Plot analysis flag is set, additional plots are visualized at the time of next-cast estimation.
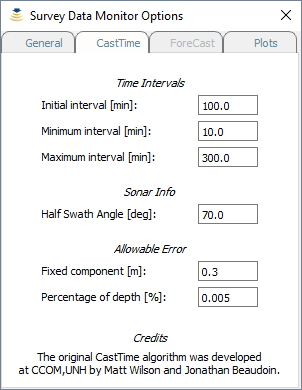
This tab contains the CastTime-specific settings: the initial casting interval, the possible range of variability for the estimated casting interval, the angle at which to calculate the ray-tracing, and the factors used in the formula used to calculate the maximum allowable error.
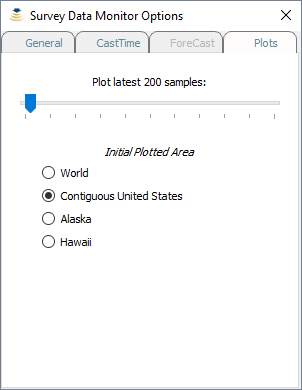
This tab is used to change the number of samples displayed in the plotters. This value does not affect the storing in the survey database (.mon). It is also possible to select the initial plotted area (e.g., CONUS).
Note
A high number of samples selected in the Plots tab (:numref:`data_monitor_option_plots`) may reduce the reactivity of Sound Speed Manager.
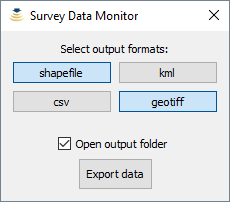
The Data Manager toolbar (:numref:`data_manager_toolbar`) provides functionalities to load previously collected data as well as to export such data in a few geospatial formats (:numref:`data_manager_export`).
It is also possible to import Kongsberg EM Series (.all) files.
When a GeoTiff output is selected, the surface sound speed values in the collected data points are rasterized in two kinds of files:
- Floating point GeoTiff, to be loaded in GIS applications (like QGis, Caris Hips&Sips, Esri ArcMap).
- Color-table Geotiff, supported by a large number of applications (e.g., Xylem HYPACK).

In magenta, the Data Manager toolbar controls to open the output folder, to load data, and to export in various formats.
The Data Views toolbar (:numref:`data_views_toolbar`) helps the user to customize the data visualization.
The Survey Data Monitor tool provides several plots and viewers that can be un-docked to ease their visualization while performing other tasks with Sound Speed Manager:
- General Info viewer.
- Surface Sound Speed Map plotter.
- Surface Sound Speed vs. Time plotter.
- Transducer Depth vs. Time plotter.
- Average Depth vs. Time plotter.
- Next-Cast Info viewer.
Each plotter has a navigation toolbar that provides basic functionalities like panning and zooming.
The Next-Cast Info viewer (:numref:`next_cast_info`) displays textual information related to the latest analysis performed by the next-cast estimator (e.g., CastTime).
