.. index::
   single: tab; data editor
.. index::
   single: data; import
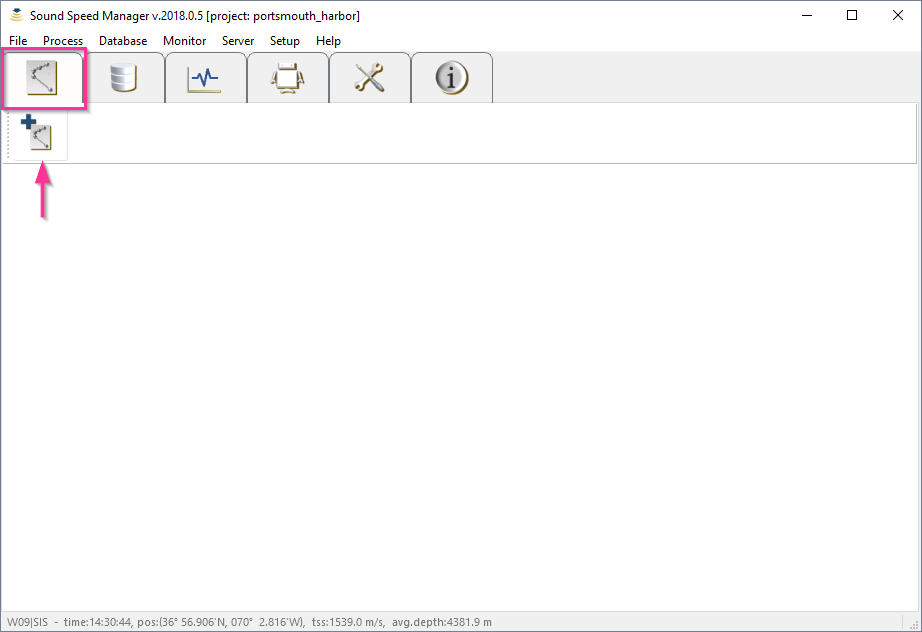
From the Editor tab, select Import data (:numref:`editor_tab0`) and choose the desired import file type (:numref:`editor_tab1`).
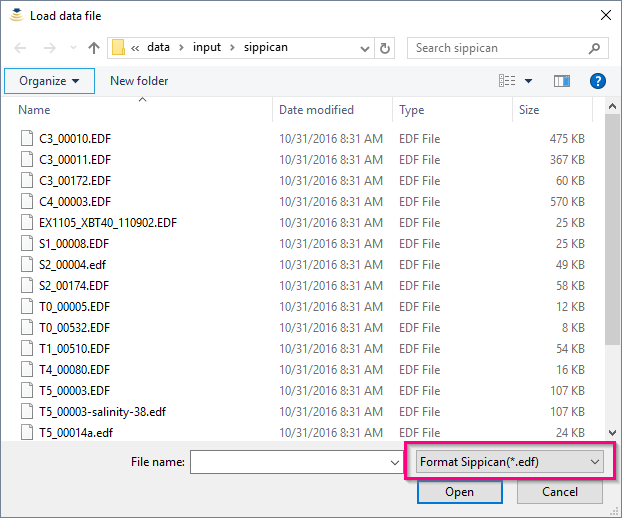
This will launch a file selection dialog (:numref:`editor_tab2`) with the expected file extension set as a filter, e.g. .edf
for Sippican files.
Note
A number of sample data files can be downloaded from the data folder in the project repository.
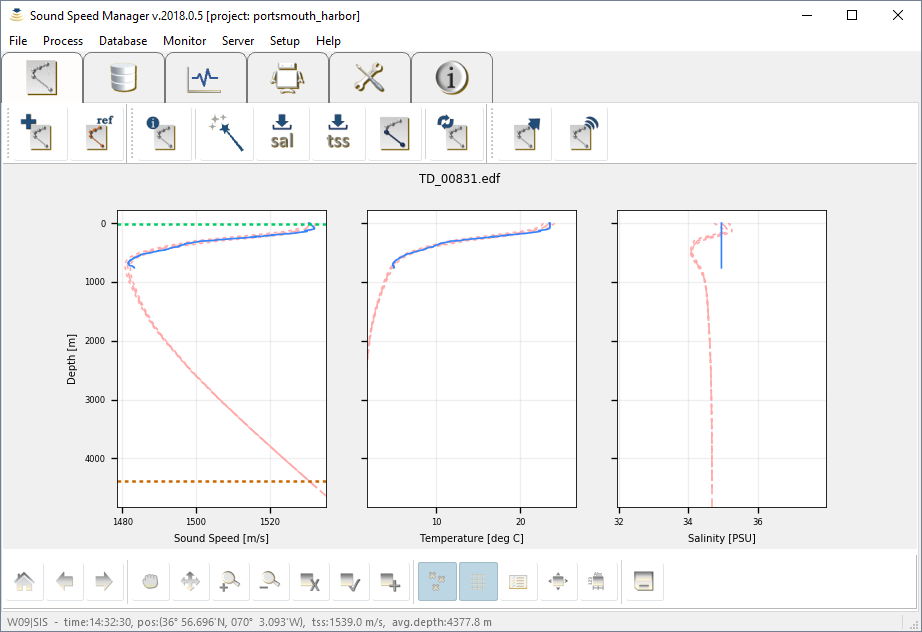
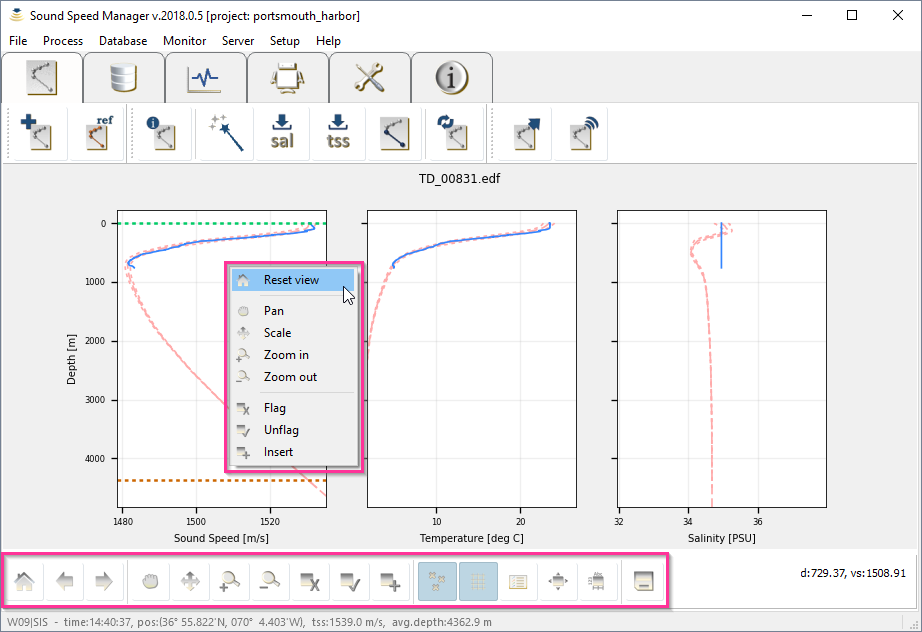
After the selection of the desired file, the window shows panels with the sound speed, temperature and salinity profiles drawn in solid blue (left to right, respectively, in :numref:`editor_tab3`).
During the import stage, the geographic position and date in the input file are used to query WOA or RTOFS atlases (if available) to obtain mean sound speed, temperature and salinity profiles (to provide a context during data editing), which are drawn in dashed colours. Thus, it is important that the cast positional metadata are correct for this lookup operation.
Furthermore, the position is also required by some formats to compute the pressure to depth conversion (since this
has a latitudinal dependence). Since some file formats do not support recording of geographic position
(e.g., Valeport .000) the user must enter these manually during import (if the SIS position datagram is
not available).
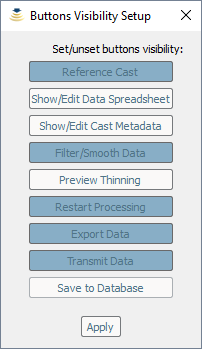
All the available processing steps can be accessed from the Process menu. A selection of these steps is present in the toolbar for ease their access in operation. This selection can be customized through the Button Visibility dialog (:numref:`buttons_visibility`) accessible using Process/Change Buttons Visiblity.
The mouse interactive mode is set using the plotting toolbar at the bottom (:numref:`editor_tab4`) or by directly right-clicking on the plots once a cast is loaded. Currently available inspection modes are:
- Reset view: to visualize the full profile
- Pan: to move the area visualized in the plot
- Scale: to modify the horizontal and vertical scales of the plots
- Zoom in: to zoom in to a selected area
- Zoom out: to zoom out from a selected area
- Flag: mark spurious measurements for removal from any plot panel through a left-click drag motion over the bad data points. The flagged points will be drawn in red.
- Unflag: reclaiming previously flagged data, using the same left-click and drag motion as Flag.
- Insert: manually adding points to the profiles can be useful to create a more realistic cast extension. This is particularly useful when the measured temperature and/or salinity values deviate from WOA/RTOFS or the reference profile near the bottom of the profile.
Zooming back out to the full view is accomplished by choosing Reset view from the plotting toolbar (or by directly right-clicking on the plot and selecting Reset view). The Hide flagged option in the plotting toolbar will toggle the display of flagged points.
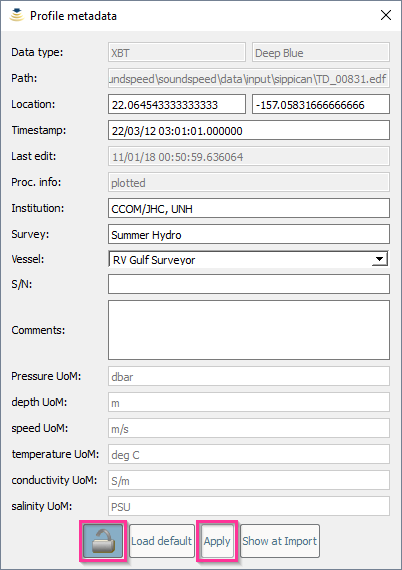
Several information related to the cast are collected during the import and the processing of a cast. Metadata can be viewed by clicking the Metadata button on the tool bar (:numref:`metadata_button`).
It is also possible to manually edit several of the metadata entries (:numref:`metadata_widget`) and to force the visualization of the Profile metadata tool at the import time (:numref:`metadata_at_import`).
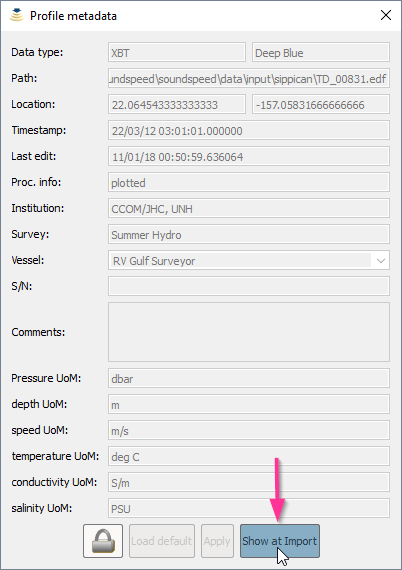
When the "Show at Import" button is flagged like in the figure, the Profile metadata tool is automatically displayed when a new profile is imported.
If required, the profile data can be automatically filtered and smoothed using the Filter/Smooth Data button (:numref:`editor_tab5`).
Sound speed data can be augmented with WOA/RTOFS/reference salinity and/or temperature. If a reference cast has been set, then the reference cast will be used to augment salinity and/or temperature profiles instead of the WOA/RTOFS profiles.
Note
You can set the desired augmentation source (e.g., the user-defined reference cast) in the Input tab available in the :ref:`application_settings`.
.. index:: XBT
XBT probes measure the temperature of water as they drop to the seafloor. Since the speed of sound in water is strongly affected by water temperature, this measurement can be used to estimate the sound speed profile. Since salinity can also influence the speed of sound in water, the accuracy of the sound speed estimate can be improved through better approximation of the water’s salinity. This approximation can be as simple as assuming that the salinity is constant over all depths or it could be as sophisticated as using an independent salinity depth profile from an alternate sensor such as a CTD or perhaps from an oceanographic model.
The package follows this second approach. The salinity profile is specified by selecting Retrieve salinity (:numref:`editor_tab6`) from the Editor toolbar (the option is only active when an XBT cast is loaded). With this command, the dashed WOA or RTOFS salinity profile is used to augment the XBT temperature measurement. Since the vertical resolution of the WOA/RTOFS grids is coarse compared to the typical sampling interval of the measured data, the salinity estimates are linearly interpolated to the depths associated with each of the temperature observations in the measured XBT profile.
The salinity plot (right-most of the three panels) will update with a salinity profile and the sound speed plot (left-most panel) is updated with sound speed (recalculated using the new salinity estimates). Sound speed values are calculated using the UNESCO equation (Fofonoff and Millard, 1983).
.. index:: XSV
In the case of an XSV file, the user can decide to augment the measured sound speed with WOA/RTOFS temperature and salinity through the XSV load temperature/salinity option under the Process menu (:numref:`editor_tab7`). The option is only active when an XSV cast is loaded.
Note
In this mode, the sound speed is NOT recalculated, the temperature and salinity are meant merely for SIS to compute transmission loss corrections for improved backscatter normalization. Thus, the application disallows the Retrieve salinity button in the Editor toolbar for XSV profiles.
.. index:: manual insertion
There are two methods to add points, after having selected the Insert mode in the right-click menu or in the plotting toolbar:
1. Adding sound speed points in the sound speed plot. This method adds points to the sound speed profile only and it holds the current temperature and salinity gradients constant (i.e., it makes no attempt to update the temperature/salinity profiles for the chosen sound speed). Thus, this method is well suited for output formats or transmission protocols in which the temperature/salinity values are not used.
2. Adding salinity and temperature points. This method adds salinity and temperature points in their respective plots and then calculates the resulting sound speed based on the temperature/salinity plots. A first click in the salinity plot sets both the point depth and salinity. A second click in the temperature plot sets the temperature for the point depth selected in the prior step. The package will automatically calculate the sound speed based off the temperature/salinity points previously selected. The click order can be reversed (i.e., a first click in temperature sets the depth and temperature).
Multipoint extensions are achieved through repeating the above sequence. If a deep extension that exceeds the view limits is required, use the pan utility to adjust the view limits.
If configured to receive data from SIS, the surface sound speed and transducer draft from the depth datagram broadcast can be used to create a surface layer of thickness equal to the transducer draft and of sound speed equal to the value used in beam forming (this is based on the assumption that the value comes from the surface sound speed probe). This operation can be achieved by selecting Retrieve Surface Sound Speed from the Editor toolbar (:numref:`editor_tab8`).
If neither the surface sound speed or transducer draft values are available from a SIS data broadcast, the software will prompt the user to input values for both.
The intent of this feature is to keep the sound speed profile and sound speed sensor values similar such that the numerical display monitors in SIS do not warn against sound speed discrepancies between the two measurements. It should be noted that this is done internally in SIS during their ray tracing operations, regardless of this external processing stage: “transducer depth sound speed is used as the initial entry in the sound speed profile used in the ray tracing calculations” (Kongsberg, 2012).
Using this package method, keeps the system from warning against discrepancies based on:
- The uncertainty in XBT temperature measurements (± 0.1°C, roughly equivalent to ± 0.4 m/s)
- Inadequate choice of salinity in the Sippican acquisition system
- Deviations of true salinity from the mean surface salinity in the WOA/RTOFS.
.. index:: WOA; extension
.. index:: RTOFS; extension
Profile extension can be applied by selecting Extend profile from the Editor toolbar (:numref:`editor_tab9`). This operation will extend the observed cast in depth as much as possible using the WOA/RTOFS profile. After that, the three plot panels will be updated. If necessary, users should edit any discontinuities between the cast in depth and the extension in the vicinity of the maximum observation depth.
The extension will only go as deep as 5,500 m as this is the deepest depth layer that the WOA/RTOFS atlases support (more details on such an operation are provided in :ref:`app_a_oceanographic_atlases`).
However, when files are transmitted to SIS or exported in .asvp format, the software extends the profile
to 12,000 m depth to meet SIS input criteria (thus, there is no need for the user do this manually).
Similar to data augmentation for XBT probes and for XSV probes, when a reference cast is set,
this will be used to extend the cast instead of WOA/RTOFS atlases data.
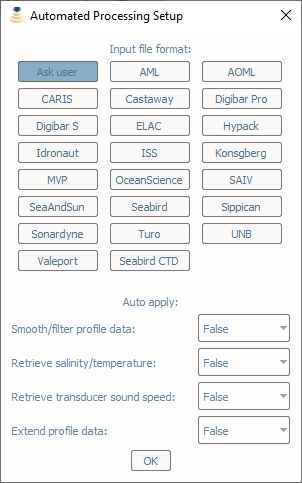
To streamline the processing of new sound speed profiles, it is also possible to automate a number of steps in the workflow. The Automated Processing Setup dialog (:numref:`automated_processing`) can be accessed under Process/Automate Processing.
The profile accepted by SIS has a limited number of samples, thus the collected profile often requires the application of a thinning algorithm when exporting in Kongsberg format. The thinning is obtained by iteratively running a custom version of the Douglas-Peucker algorithm.
In addition, a Preview thinning method is provided to inspect the result of such an algorithm before the actual transmission.
.. index:: data; export
Any file that is loaded into the package can be exported by accessing the Export data from the Editor toolbar (:numref:`editor_tab10`).
Several formats are currently supported, so the user must select the format of interest and then choose Export selected formats to actually perform the export. To inspect the content of a profile exported in the NCEI format, see :ref:`app_c_view_ncei_format`.
The export function will prompt the user for an output prefix prior to export.
.. index:: data; transmission
.. index:: SIS
Data transmission is triggered by selecting the Transmit data from the Editor toolbar (:numref:`editor_tab11`).
The recipients of such a transmission are configured in the configuration file (see :ref:`possible_configurations`).
.. index:: database
Each time that a profile is exported or transmitted, it is also automatically stored in the current active database.
It is also possible to force the storage of a profile using Process/Save to Database.
