- plot_5prime_end_from_bedgraph.py
5'-end data in bedgraph form --> plot of 5'-ends for specified region (or expoerted relative data)
usage: plot_5prime_end_from_bedgraph.py [-h] [-revo]
[-ctp CUSTOM_TITLE_PREFIX]
[-si SAMPLE_ID] [-svg] [-lim INT]
[-spa] [-npa] [-nda] [-ls] [-exp_d]
start-end FORWARD_DATA REVERSE_DATA
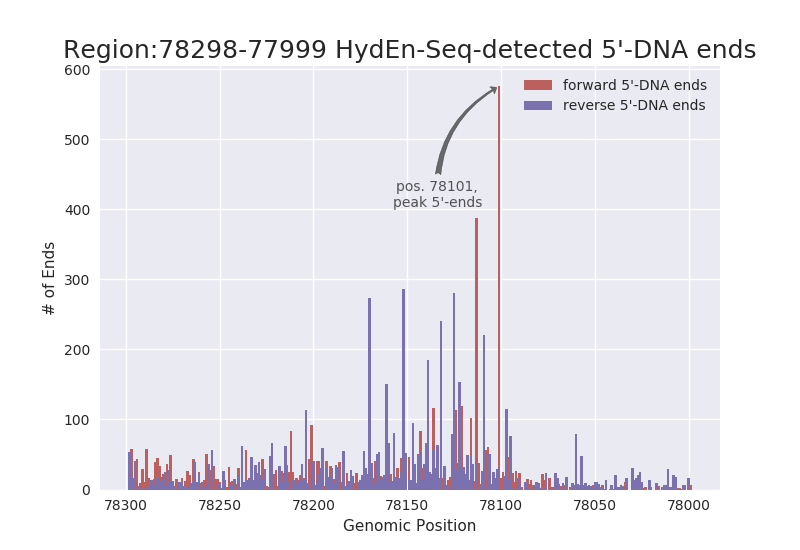
plot_5prime_end_from_bedgraph.py plots data from bedgraph files for a
particular region. **** Script by Wayne Decatur (fomightez @ github) ***
positional arguments:
start-end Region to plot indicated by start postion followed by
a dash, and then the end position. Example, `200-500`.
REQUIRED.
FORWARD_DATA Name of file containing the forward data in bedgraph
format. REQUIRED.
REVERSE_DATA Name of file containing the reverse data in bedgraph
format. REQUIRED.
optional arguments:
-h, --help show this help message and exit
-revo, --reverse_orientation
Plot left to right to correspond to 5'-> 3' direction
on reverse strand.
-ctp CUSTOM_TITLE_PREFIX, --custom_title_prefix CUSTOM_TITLE_PREFIX
Provide a string after this flag to use that text as
the start of the plot title. Typically, the region
info is used to form the tile of the plot image to be
saved; however, if this is provided it will be instead
used as part of the file name.
-si SAMPLE_ID, --sample_id SAMPLE_ID
Provide a string after this flag to use that text as
the sample id/strain name to be in parentheses at end
of the plot title. If provided, it will also be
incorporated into name of saved plot.
-svg, --svg Also save as a vector graphics file (SVG) useful for
working in subsequent graphics editing.
-lim INT, --limit INT
**FOR ADVANCED USE.*** Allows for controlling the
upper end of scale for y-axis. Should only be needed
when extremes of values in one plot might not match a
plot for a related but different sample. Put the upper
limit integer after the flag, such as `--limit 82`.
-spa, --single_peak_annotation
Only show annotation of the maximum peak for both
forward and reverse strand data.
-npa, --no_peak_annotation
Turn off annotation of the peak points of 5'-ends for
both forward and reverse data.
-nda, --no_dist_annotation
Turn off annotation of the distance between peak
points of forward and reverse data.
-ls, --large_size Print large image of plot.
-exp_d, --export_data
Export the data as CSV printed to the console as
stdout; use a redirect in a shell command to send the
output to a file. If the `--reverse_orientation`
option is utilized when the script is called then the
data is exported as of the complementary strand 5'-end
is the starting point. This is a utility feature added
to enable easily passing the data mined by this script
onto related scripts. This overrides the plotting
action, i.e, in this mode no plot will be made,
despite the name of the script.
IMPORTANTLY: There is a notebook demonstrating use of this script and illustrating many of the options available here.
Verified compatible with both Python 2.7 and Python 3.6.
Written to run from command line or pasted/loaded inside a Jupyter notebook cell.
The main ways to run the script are demonstrated in a series of notebooks illustrating using PatMatch with Python.
Example calls to run script from command line:
python plot_5prime_end_from_bedgraph.py 5013-5359 forward.bedgraph reverse.bedgraph

python plot_5prime_end_from_bedgraph.py 5013-5359 forward.bedgraph reverse.bedgraph --sample_id WT3b

python plot_5prime_end_from_bedgraph.py 5013-5359 forward.bedgraph reverse.bedgraph --sample_id WT3b --reverse_orientation
(Alternatively, upload the script to a Jupyter environment and use %run plot_5prime_end_from_bedgraph.py 5013-5359 forward.bedgraph reverse.bedgraph in a Python-backed notebook to run the example.)
The impetus for writing it was to plot ribonucleotide incorporation data from Clausen et al., 2015 (PMID:25622295); however, it is more general than that as it can plot any 5'-end data in bedgraph files. As of the time of writing this though part of the title text and other things reflecting that intention is hard coded inside the script, and so you should look at some of the variables under 'USER ADJUSTABLE VALUES ' and edit the text to reflect your data if you use it for something else.
EXAMPLE OUTPUT:
- plot_coverage.py (NEED TO PUT IN THIS REPO STILL)
high-throughput sequencing data --> plot of coverage for specified region (or exported relative data)
Takes data previously generated by the use of Samtools with sorted and indexed BAM files for high-throughput sequencing data (intended for Illumina-generated data) and makes a plot of the coverage for the specified region. It can also be used to pass data from that source to other computational tools.
- plot_coverage_and_starts.py (NEED TO PUT IN THIS REPO STILL)
high-throughput sequencing data --> plot of coverage and 5'-ends for specified region (or exported relative data)
Takes data previously generated by the use of Samtools with sorted and indexed BAM files for high-throughput sequencing data (intended for Illumina-generated data) and makes a plot of the coverage and 5'-ends for the specified region. It can also be used to pass data from that source to other computational tools.
Note for plot_coverage.py and plot_coverage_and_starts.py I intend to put here--> These need data previously generated by the use of Samtools with sorted and indexed BAM files for sequencing data.
Another Note for the plot_coverage.py and plot_coverage_and_starts.py I intend to put here first --> Despite the names, they both have --export_data options that can be called to easily pass the data they mine from the input data, but WHEN THIS OPTION IS USED NO PLOT IS MADE. It is meant to be used in conjunction with plots probably already made and with other scripts, see the section Related items created by myself below. It was a deliberate choice to add directly to the script the ability to export the data rather than duplicating the data processing steps in a separate script with the idea it would lessen the need for propagating changes to multiple places to keep such related scripts in sync.
Another Note for the plot_coverage.py I intend to put here first -->* See here for alternatives to plot_coverage.py among the great answers listed in response to the question:
"RNA-seq pileup plots for publication: bedgraph/gene features/etc: what is your favourite solution? I use IGV day-to-day but for publication it looks not so great. I have some ggplot code that works, just. Is there a better way (with clean vector-format graphics?) #Bioinformatics"
I have made a script that utilizes the --export_data option to run plot_coverage_and_starts.py to automate an effort:
Specifically, the script shepherds_read_starts_at_start_of_origins_thru_to_plotting.py utilizes the --export_data option to run plot_coverage_and_starts.py in an automated manner and plot the starts in a subregion of the data using the script plot_stacked_bar_plots_with_fit.py. The associated script plot_stacked_bar_plots_with_fit.py is found here, as it is general and not specific to read data.
-
"karyoploteR is an R package to create karyoplots, that is, representations of whole genomes with arbitrary data plotted on them. ... The aim of karyoploteR is to offer the user an easy way to plot data along the genome to get broad genome-wide view to facilitate the identification of genome wide relations and distributions."
-
See here for alternatives to
plot_coverage.pyamong the great answers listed in response to the question:"RNA-seq pileup plots for publication: bedgraph/gene features/etc: what is your favourite solution? I use IGV day-to-day but for publication it looks not so great. I have some ggplot code that works, just. Is there a better way (with clean vector-format graphics?) #Bioinformatics"
-
Related to
plot_coverage.pyI'm curious about the answer to this Biostars post . -
Related to
plot_coverage.pyI'm curious about the answers to this Twitter post . Such as:-
"SeqMonk from @babraham_bioinf does all the things (including this): https://bioinformatics.babraham.ac.uk/projects/seqmonk/ complete with YouTube tutorial "
-
"Sounds like bamCoverage and computeMatrix from deepTools will do what you need. The former can give raw coverage for summarization. You can probably use mosdepth rather than bamCoverage if time is important, though you’d need to convert the results to bigWig."
-
-
gos: (epi)genomic visualization in python
"gos is a declarative (epi)genomics visualization library for Python. It is built on top of the Gosling JSON specification, providing an simplified interface for authoring interactive genomic visualizations."
-
Not for high-throughput data, but for a different type of modern sequencing data: NanoPack - NanoPlot and NanoStats and other Python scripts and modules for visualizing and processing Oxford Nanopore sequencing data