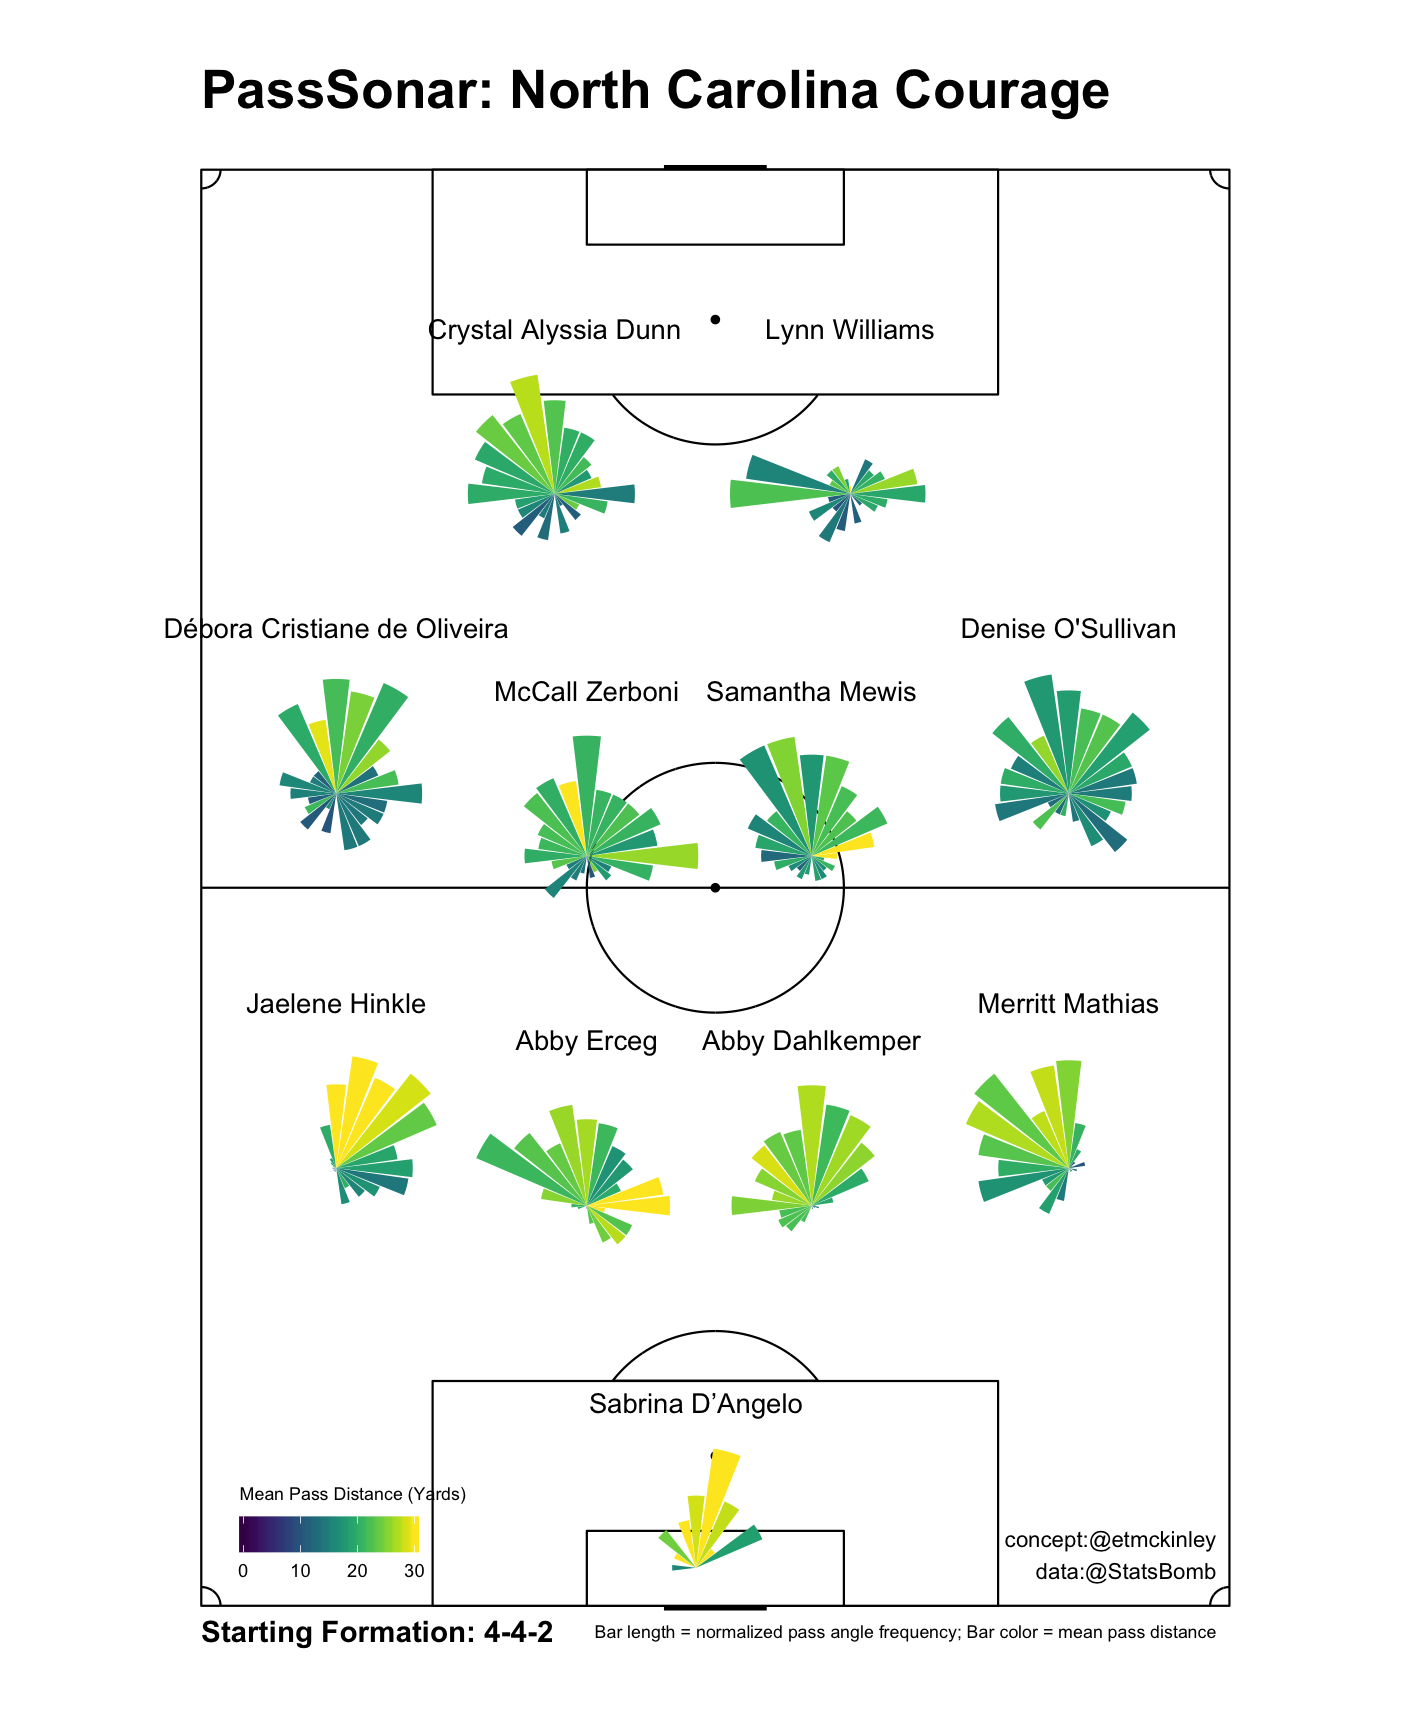
Example code to produce PassSonars from soccer event data using R.
PassSonars are a way of visualizing pass direction and distance. Essentially polar histograms, the length of the bars indicate the normalized pass frequency for each angle bin, while the color represents the distance for each segment. These can be modified to indicate other metrics as well. PassSonars were initially conceived as positional overlays, but variations can include zonal passing characteristics, inverted to look at receptions, or used to look at throw-ins, among others.
This code will produce a PassSonar overlay for a 4-4-2 formation.

The data used for this example comes from StatsBomb's free event data.
createPitchETM is modified from FC_Rstats.
Polar pass histograms by Ben Torvaney anteceded my independent development of PassSonars.