A small, python-based library for creating map images with lines and markers.
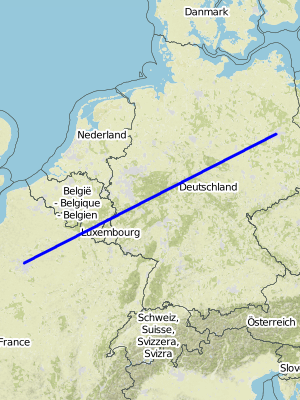
m = StaticMap(300, 400, 10)
m.add_line(Line(((13.4, 52.5), (2.3, 48.9)), 'blue', 3))
image = m.render()
image.save('map.png')
This will create a 300px x 400px map with a blue line drawn from Berlin to Paris.
StaticMap is a small library, all it takes is python and two python packages: Pillow and request. Install staticmap via:
pip install staticmapm = StaticMap(width, height, padding_x, padding_y, url_template, tile_size)| parameter | description |
|---|---|
| width | width of the image in pixels |
| height | height of the image in pixels |
| padding_x | (optional) minimum distance in pixel between map features (lines, markers) and map border |
| padding_y | (optional) minimum distance in pixel between map features (lines, markers) and map border |
| url_template | (optional) the tile server URL for the map base layer, e.g. https://a.tile.osm.org/{z}/{x}/{y}.png |
| tile_size | (optional) tile size in pixel, usually 256 |
line = Line(coordinates, color, width))
m.add_line(line)| parameter | description |
|---|---|
| coordinate | a sequence of lon/lat pairs |
| color | a color definition Pillow supports |
| width | the stroke width of the line in pixel |
| simplify | whether to simplify coordinates, looks less shaky, default is true |
marker = CircleMarker(coordinate, color, width))
m.add_marker(marker)| parameter | description |
|---|---|
| coordinate | a lon/lat pair: e.g. (120.1, 47.3) |
| color | a color definition Pillow supports |
| width | diameter of marker in pixel |
polygon = Polygon(coordinates, fill_color, outline_color, simplify)
m.add_polygon(polygon)| parameter | description |
|---|---|
| coordinate | a lon/lat pair: e.g. [[9.628, 47.144], [9.531, 47.270], [9.468, 47.057], [9.623, 47.050], [9.628, 47.144]] |
| fill_color | a color definition Pillow supports |
| outline_color | a color definition Pillow supports |
| simplify | whether to simplify coordinates, looks less shaky, default is true |
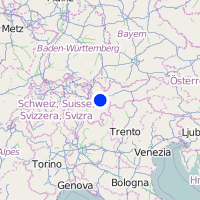
from staticmap import StaticMap, CircleMarker

m = StaticMap(200, 200, url_template='https://a.tile.osm.org/{z}/{x}/{y}.png')

marker_outline = CircleMarker((10, 47), 'white', 18)
marker = CircleMarker((10, 47), '#0036FF', 12)

m.add_marker(marker_outline)
m.add_marker(marker)

image = m.render(zoom=5)
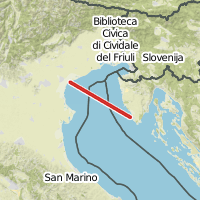
image.save('marker.png')from staticmap import StaticMap, Line
m = StaticMap(200, 200, 80)
coordinates = [[12.422, 45.427], [13.749, 44.885]]
line_outline = Line(coordinates, 'white', 6)
line = Line(coordinates, '#D2322D', 4)
m.add_line(line_outline)
m.add_line(line)
image = m.render()
image.save('ferry.png')from staticmap import StaticMap, IconMarker
m = StaticMap(240, 240, 80)
icon_flag = IconMarker((6.63204, 45.85378), './samples/icon-flag.png', 12, 32)
icon_factory = IconMarker((6.6015, 45.8485), './samples/icon-factory.png', 18, 18)
m.add_marker(icon_flag)
m.add_marker(icon_factory)
image = m.render()
image.save('icons.png')StaticMap is open source and licensed under Apache License, Version 2.0
The map samples on this page are made with OSM data, © OpenStreetMap contributors


