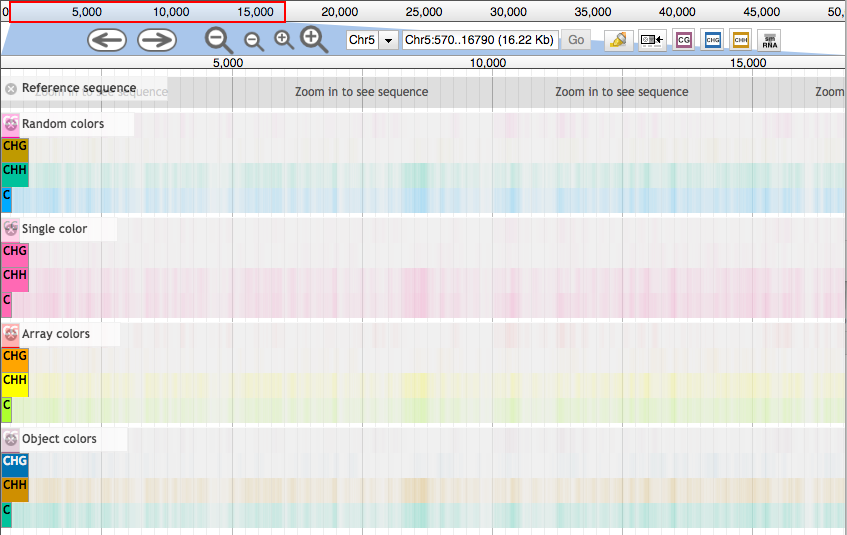
Allows the user to create multi-lined heatmaps for different nucleotide contexts. User can set the color for each context, a single color for all contexts, or "random" colors will be chosen (see below).
Special thanks to Colin Diesh who inspired components of this plugin. Particularly, the GC Content plugin (for the storage class) and Multi BigWig plugin (for multiple density tracks).
"Random" color generation was possible thanks to Chroma.js. A copy downloaded March 16, 2017 is included in this plugin.
For JBrowse 1.11.6+ in the JBrowse/plugins folder, type:
git clone https://github.com/bhofmei/jbplugin-nucdens.git NucleotideDensityPlugin
or
downloaded the latest release version at releases.
Unzip the downloaded folder, place in JBrowse/plugins, and rename the folder NucleotideDensityPlugin
Add this to jbrowse.conf under [GENERAL]:
[plugins.NucleotideDensityPlugin]
location = plugins/NucleotideDensityPlugin
If that doesn't work, add this to jbrowse_conf.json:
"plugins" : {
    "NucleotideDensityPlugin" : {
        "location" : "plugins/NucleotideDensityPlugin"
    }
}Sample data is included in the plugin to test that the plugin is working properly. With URL as the URL path to the JBrowse instance, navigate a web browser to URL/index.html?data=plugins/NucleotideDensityPlugin/test/data.
Note: sometimes the density doesn't fully load the first time. Deselect track and readd.
Loading the track may take awhile for large region and/or many contexts.
{
    "key" : "Nucleotide Density",
    "label" : "nuc_dens",
    "storeClass" : "JBrowse/Store/SeqFeature/SequenceChunks",
    "type": "NucleotideDensityPlugin/View/Track/NucleotideDensity",
    "urlTemplate" : "seq/{refseq_dirpath}/{refseq}-",
    "context" : ["CG", "CHG", "CHH", "C"]
}
Sequence contexts must be specified in an array.
Degenerate/IUPAC nucleotides are supported. Gaps are not. Nucleotides can be lowercase or uppercase.
For all contexts, density is indicated by the intensity of color. Color is computed as a blend between the background color and specified color weighted by the scaled density.
Density is scaled to the track configuration min_score and max_score.
Color can be specified in four ways.
- Random [default]
Equidistant colors are assigned to each context based on the number of contexts specified.
"colors": "random"- Single Color
A single color is used for all contexts. Color can be specified as a string or hexidecimal value
"colors" : "hotpink"- Array
Colors in the array for assigned to each context based on order. If there are more contexts than colors specified, colors are reused in order.
"colors" : ["red", "orange", "yellow", "greenyellow"]- Object
Colors can be specified using a javascript object assigning a color to each context. If a context is not assigned a color, the cooresponding "random" color is used.
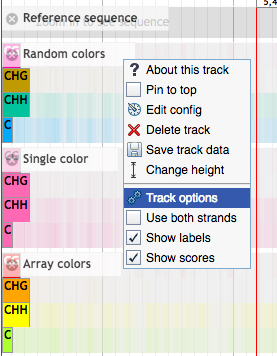
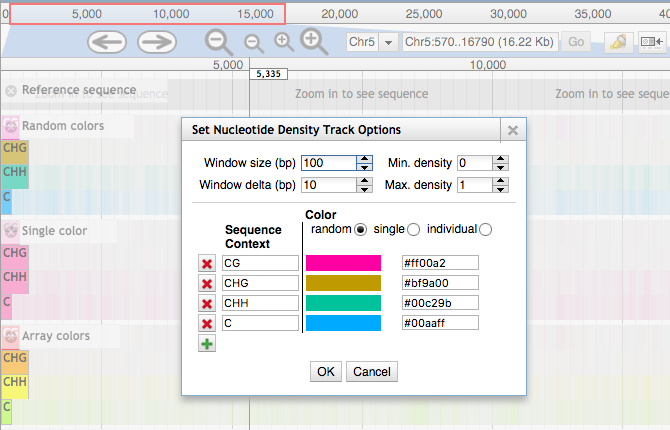
"colors" : { "CG" : "#A36085", "CHG": "#0072B2", "CHH" : "#CF8F00", "C" : "#00c29b" }Many of the parameters and settings can be adjusted using a dialog box in the track menu. Contexts can be added and removed. Colors can be changed to any of the possible color parameter types. The minimum and maximum density can be set to improve visualization. And the window size and window delta can be adjusted.
Additional parameters that can be specified for the track configuration.
"min_score" : 0, minimum density when computing color"max_score" : 1, maximum density when computing color"windowSize" : 100, window size for sliding window when computing density"windowDelta" : 10, window step size for sliding window"showLabels" : true, show context sublabels on track"showScores" : true, show density value when mouse is over the track"bothStrands" : false, use sequence on forward strand only or both strands to compute density"style" : { "height" : 70 }, track height
- "Loading" screen when recomputing after changing a track setting
- Ability to add track locally by adding option to menu bar, "File"
- Possibly improved score view (currently works fine but is not visually appealing)
- SVG-based track (compared to current canvas-based) for improved screenshots


