Ray provides a web-based dashboard for monitoring and debugging Ray applications. The dashboard provides a visual representation of the system state, allowing users to track the performance of their applications and troubleshoot issues.
To use the dashboard, you should use the ray[default] installation:
pip install -U "ray[default]"You can access the dashboard through a URL printed when Ray is initialized (the default URL is http:https://localhost:8265) or via the context object returned from ray.init.
.. testcode::
  :hide:

  import ray
  ray.shutdown()
.. testcode::

    import ray

    context = ray.init()
    print(context.dashboard_url)
.. testoutput::

   127.0.0.1:8265
INFO worker.py:1487 -- Connected to Ray cluster. View the dashboard at 127.0.0.1:8265.
Ray cluster comes with the dashboard. See :ref:`Cluster Monitoring <monitor-cluster-via-dashboard>` for more details.
Note
When using the Ray dashboard, it is highly recommended to also set up Prometheus and Grafana. They are necessary for critical features such as :ref:`Metrics View <dash-metrics-view>`. See :ref:`Ray Metrics <ray-metrics>` to learn how to set up Prometheus and Grafana.
The Jobs View lets you monitor the different jobs that ran on your Ray cluster.
A job is a ray workload that uses Ray APIs (e.g., ray.init). It can be submitted directly (e.g., by executing a Python script within a head node) or via :ref:`Ray job API <jobs-quickstart>`.
The job page displays a list of active, finished, and failed jobs, and clicking on an ID allows users to view detailed information about that job. For more information on Ray jobs, see the Ray Job Overview section.
You can profile Ray jobs by clicking on the “Stack Trace” or “CPU Flame Graph” actions. See the :ref:`Dashboard Profiling <dashboard-profiling>` for more details.
The job page allows you to see tasks and actors broken down by their states. Tasks and actors are grouped and nested by default. You can see the nested entries by clicking the expand button.
Tasks and actors are grouped and nested by the following criteria.
- All tasks and actors are grouped together, and you can view individual entries by expanding the corresponding row.
- Tasks are grouped by their
nameattribute (e.g.,task.options(name="<name_here>").remote()). - Child tasks (nested tasks) are nested under their parent task's row.
- Actors are grouped by their class name.
- Child actors (actors created within an actor) are nested under their parent actor's row.
- Actor tasks (remote methods within an actor) are nested under the actor for the corresponding actor method.
Note
Ray dashboard can only display or retrieve up to 10K tasks at a time. If there are more than 10K tasks from your job, they are unaccounted. The number of unaccounted tasks is available from the task breakdown.
The :ref:`timeline API <ray-core-timeline>` is available from the dashboard.
First, you can download the chrome tracing file by clicking the download button.
Second, you can use tools like chrome:https://tracing or the Perfetto UI and drop the downloaded chrome tracing file. We will use the Perfetto as it is the recommendation way to visualize chrome tracing files.
Now, you can see the timeline visualization of Ray tasks and actors. There are Node rows (hardware) and Worker rows (processes). Each worker rows display a list of events (e.g., task scheduled, task running, input/output deserialization, etc.) happening from that worker over time.
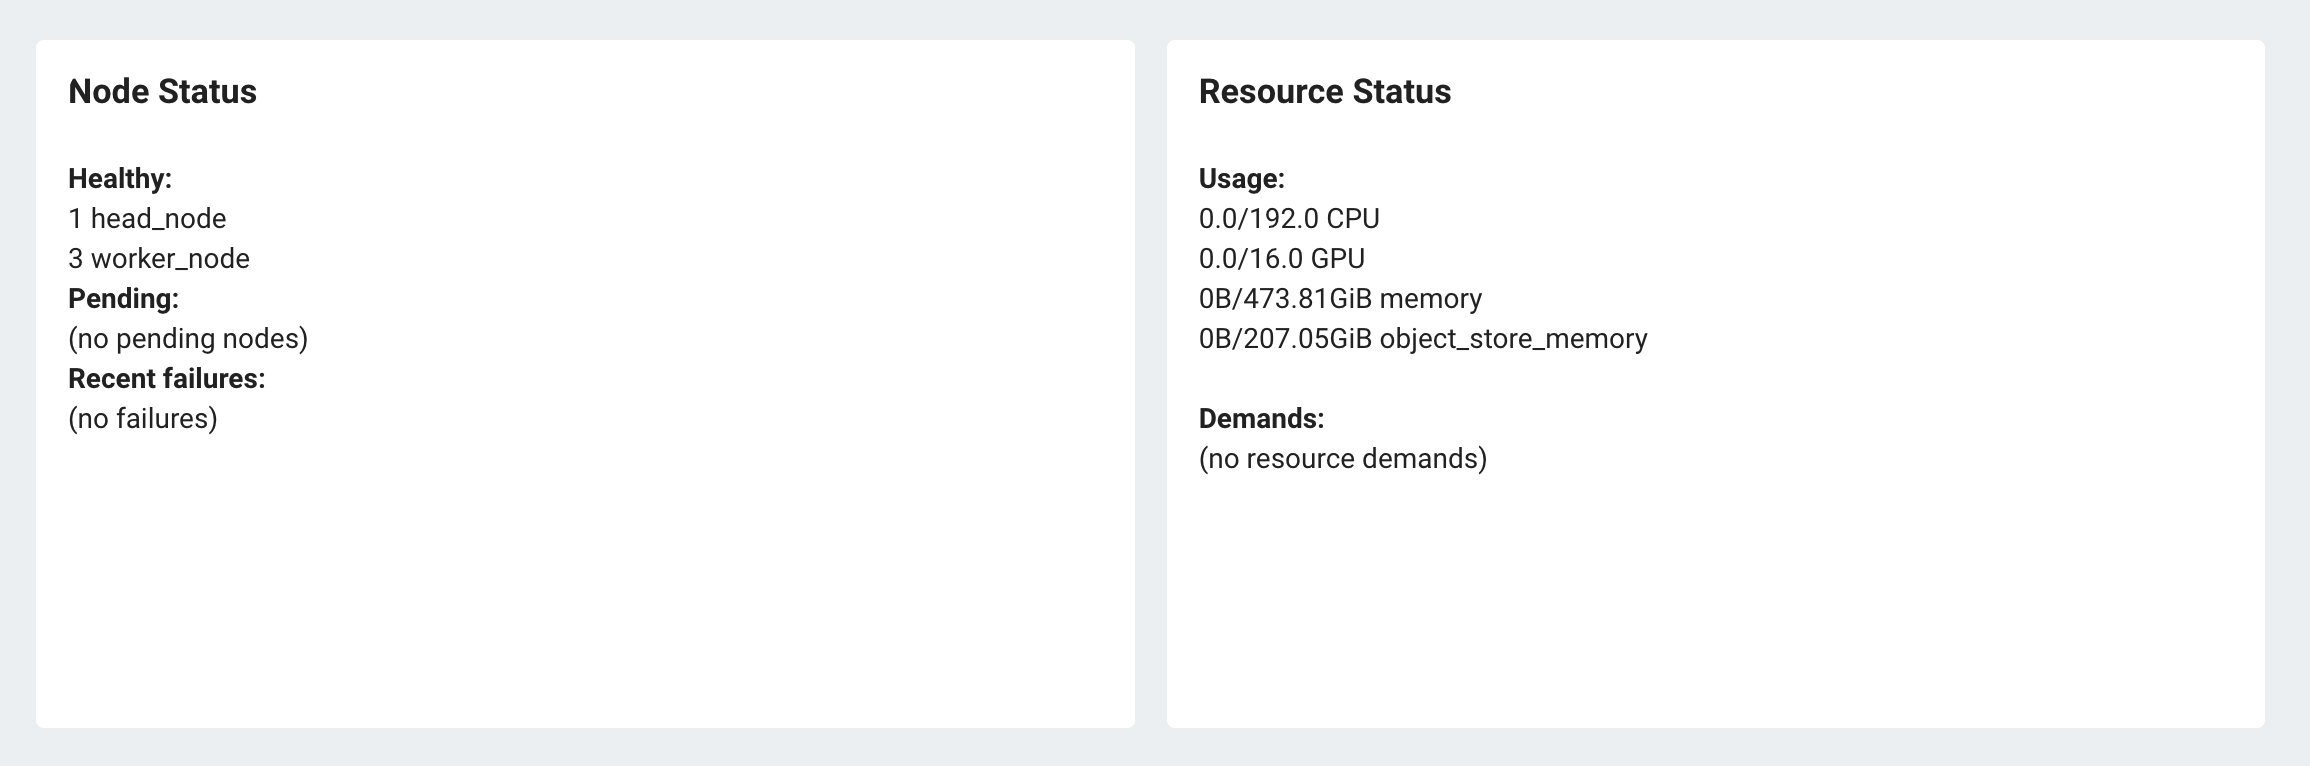
The job page displays the output of the CLI tool ray status, which shows the autoscaler status of the Ray cluster.
The left page shows the autoscaling status, including pending, active, and failed nodes. The right page displays the cluster's demands, which are resources that cannot be scheduled to the cluster at the moment. This page is useful for debugging resource deadlocks or slow scheduling.
Note
The output shows the aggregated information across the cluster (not by job). If you run more than one job, some of the demands may come from other jobs.
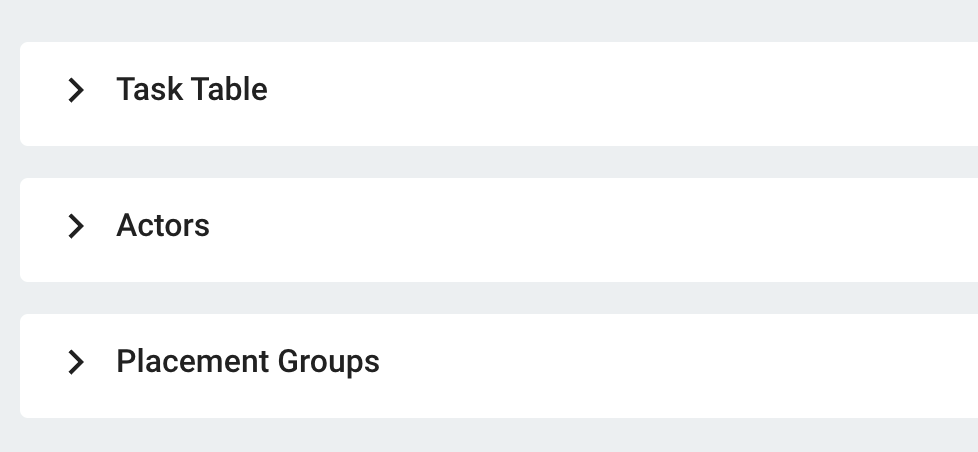
The dashboard shows a table with the status of the job's tasks, actors, and placement groups. You get the same information from the :ref:`Ray state APIs <state-api-overview-ref>`.
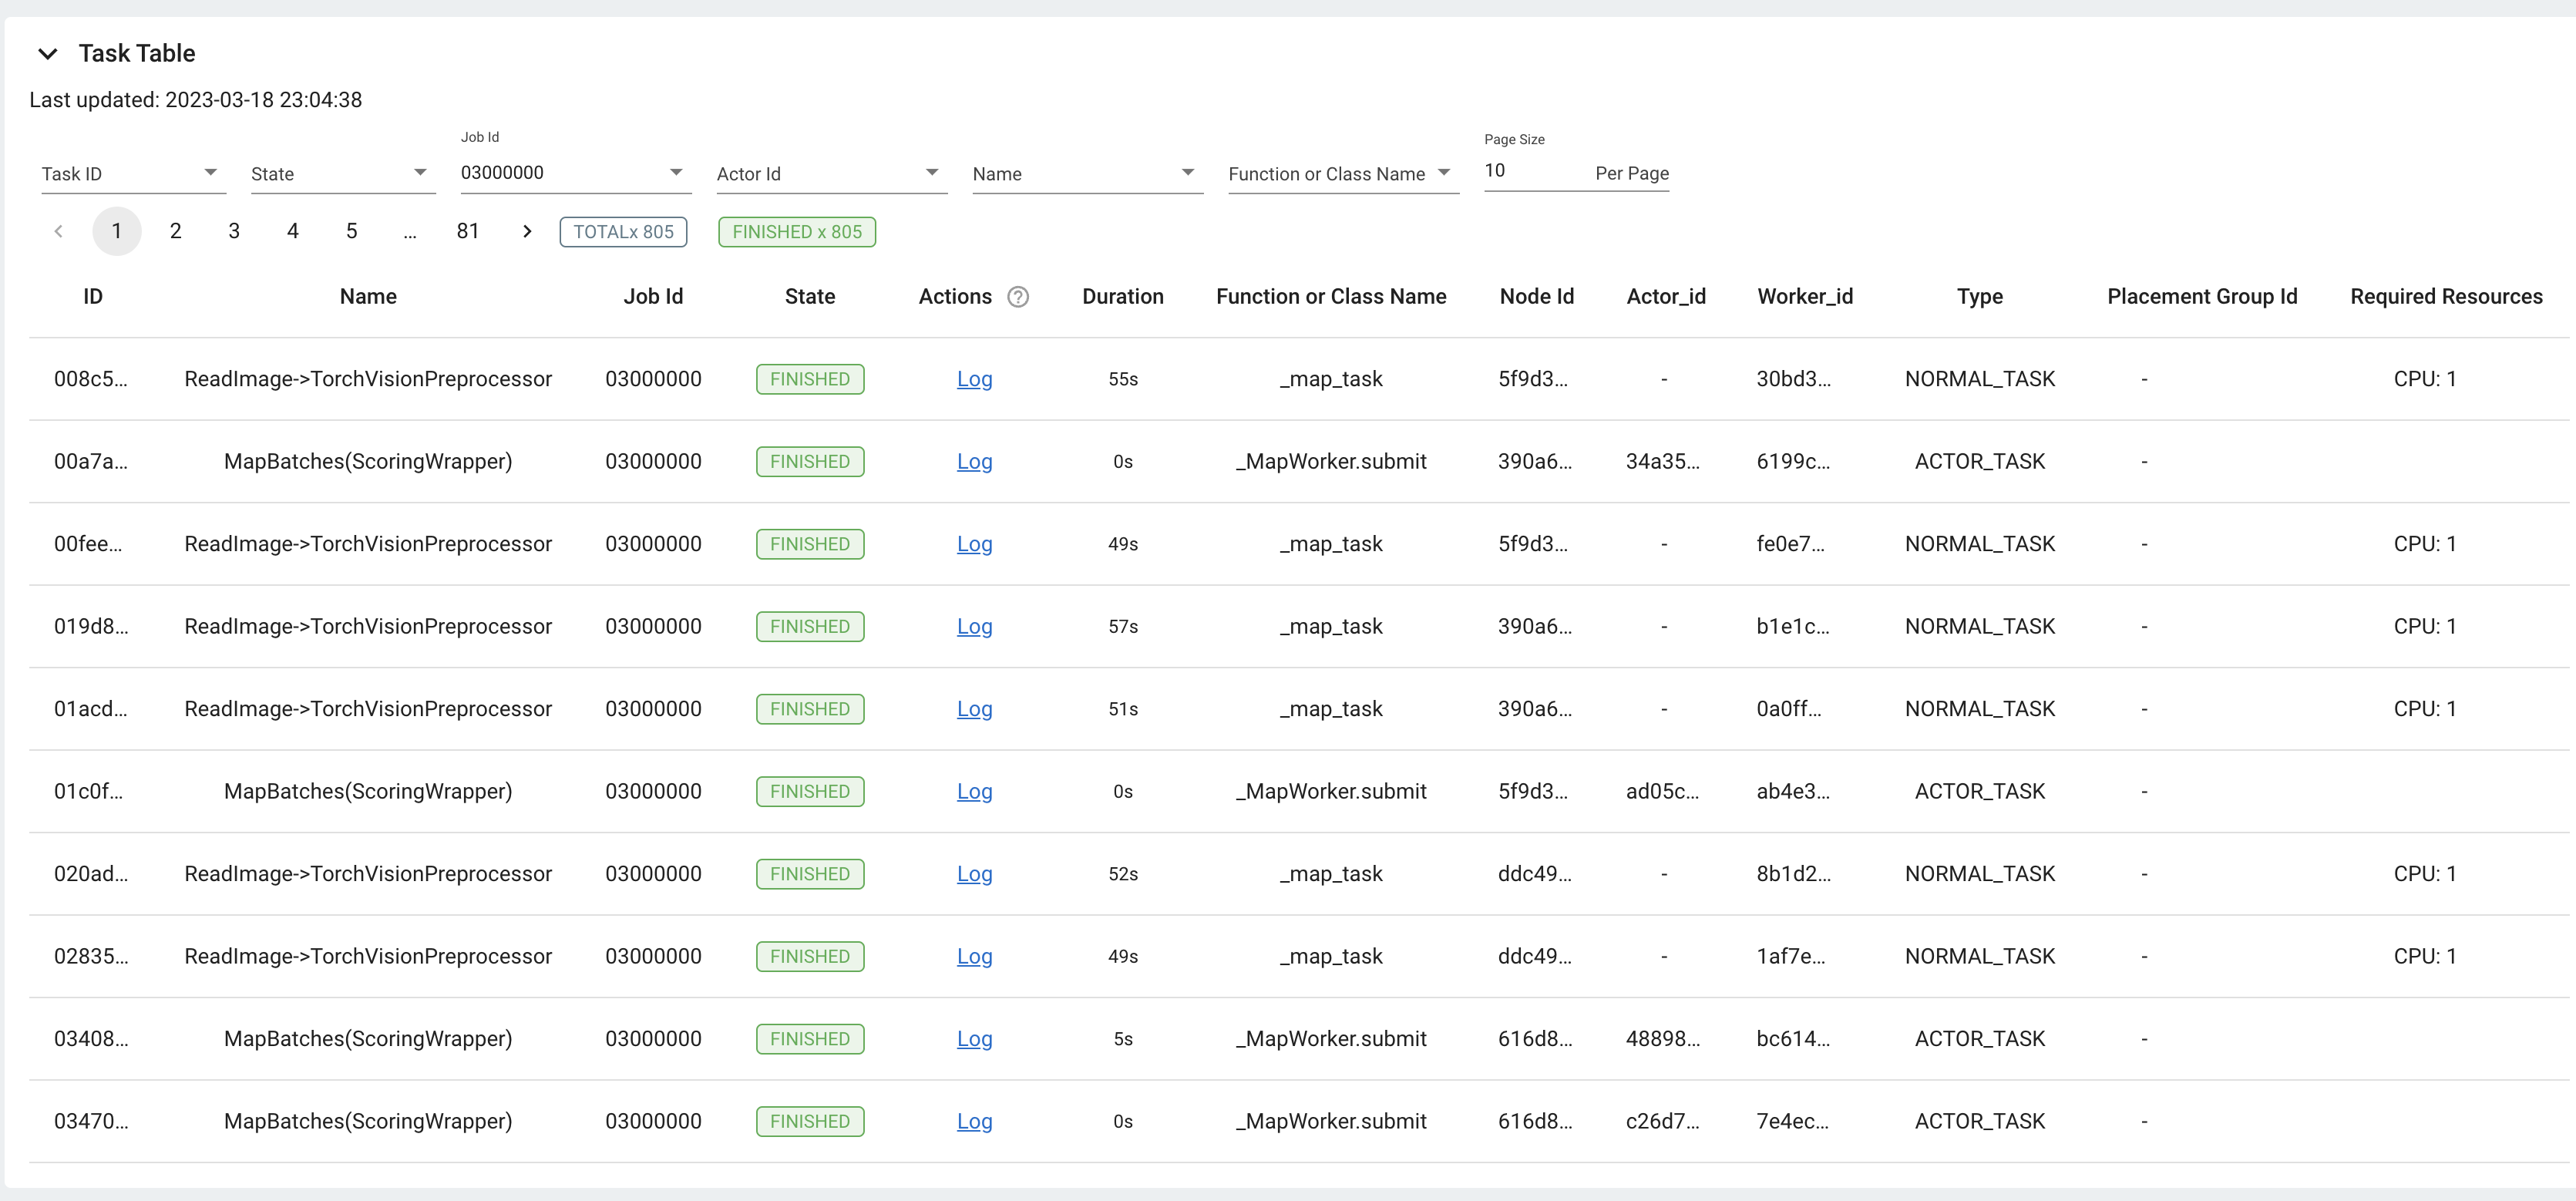
You can expand the table to see a list of each task, actor, and placement group.
The Serve view lets you monitor the status of your :ref:`Ray Serve <rayserve>` applications.
The initial page showcases your general Serve configurations, a list of the Serve applications, and, if you have :ref:`Grafana and Prometheus <ray-metrics>` configured, some high-level metrics of all your Serve applications. Click the name of a Serve application to go to the Serve Application Detail Page.
This page shows the Serve application's configurations and metadata. It also lists the :ref:`Serve deployments and replicas <serve-key-concepts-deployment>`. Click the expand button of a deployment to see all the replicas in that deployment.
For each deployment, there are two available actions. You can view the Deployment config and, if you configured :ref:`Grafana and Prometheus <ray-metrics>`, you can open a Grafana dashboard with detailed metrics about that deployment.
For each replica, there are two available actions. You can see the logs of that replica and, if you configured :ref:`Grafana and Prometheus <ray-metrics>`, you can open a Grafana dashboard with detailed metrics about that replica. Click on the replica name to go to the Serve Replica Detail Page.
This page shows metadata about the Serve replica, high-level metrics about the replica if you configured :ref:`Grafana and Prometheus <ray-metrics>`, and a history of completed :ref:`tasks <core-key-concepts>` of that replica.
Ray serve exports various time-series metrics to understand the status of your Serve application over time. More details of these metrics can be found :ref:`here <serve-production-monitoring-metrics>`. In order to store and visualize these metrics, you must set up Prometheus and Grafana by following the instructions :ref:`here <ray-metrics>`.
These metrics are available in the Ray dashboard in the Serve page and the Serve Replica Detail page. They are also accessible as Grafana dashboards. Within the Grafana dashboard, use the dropdown filters on the top to filter metrics by route, deployment, or replica. Exact descriptions of each graph are available by hovering over the "info" icon on the top left of each graph.
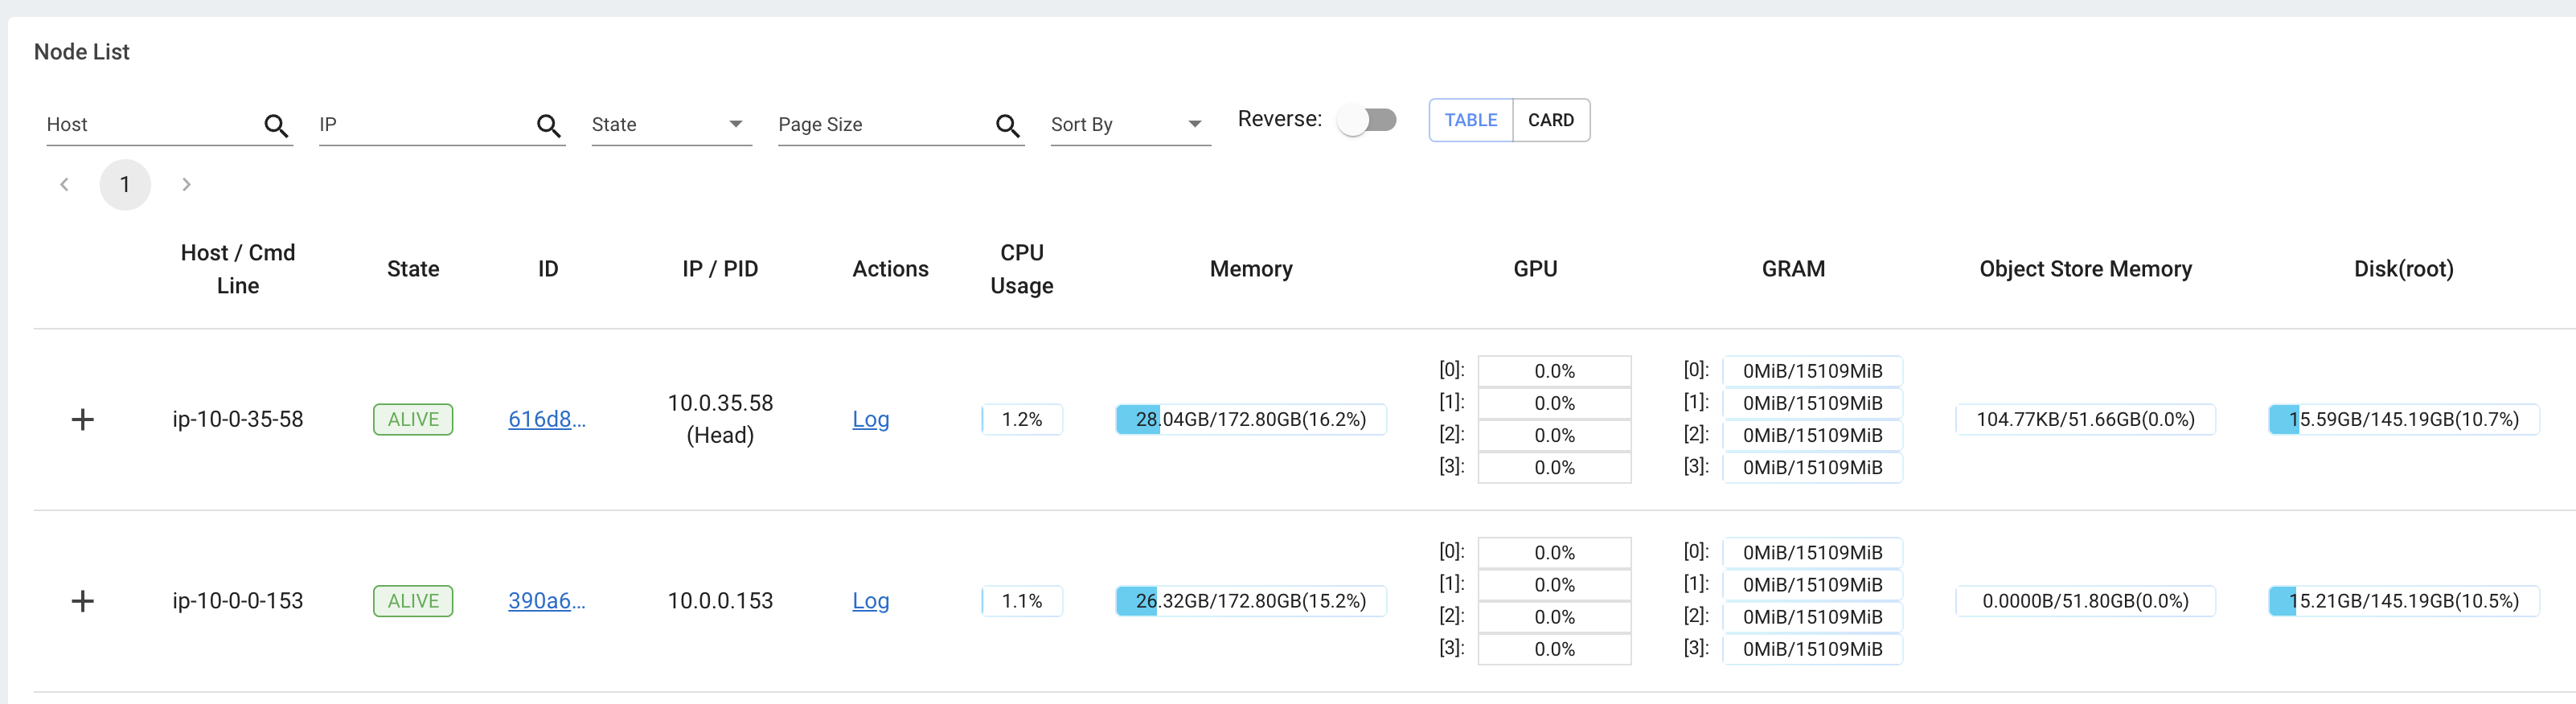
The cluster view visualizes hierarchical relationship of machines (nodes) and workers (processes). Each host consists of many workers, and you can see them by clicking the + button. This also shows the assignment of GPU resources to specific actors or tasks.
You can also click the node id to go into a node detail page where you can see more information.
In addition, the machine view lets you see logs for a node or a worker.
The Actors view lets you see information about the actors that have existed on the ray cluster.
You can view the logs for an actor and you can see which job created the actor. The information of up to 1000 dead actors will be stored. This value can be overridden by using the RAY_DASHBOARD_MAX_ACTORS_TO_CACHE environment variable when starting Ray.
You can also run the profiler on a running actor. See :ref:`Dashboard Profiling <dashboard-profiling>` for more details.
By clicking the ID, you can also see the detail view of the actor.
From the actor detail page, you can see the metadata, state, and the all tasks that have run from this actor.
Ray exports default metrics which are available from the :ref:`Metrics View <dash-metrics-view>`. Here are some available example metrics.
- The tasks, actors, and placement groups broken down by states.
- The :ref:`logical resource usage <logical-resources>` across nodes.
- The hardware resource usage across nodes.
- The autoscaler status.
See :ref:`System Metrics Page <system-metrics>` for available metrics.
Note
The metrics view required the Prometheus and Grafana setup. See :ref:`Ray Metrics <ray-metrics>` to learn how to set up Prometheus and Grafana.
The metrics view lets you view visualizations of the time series metrics emitted by Ray.
You can select the time range of the metrics in the top right corner. The graphs refresh automatically every 15 seconds.
There is also a convenient button to open the grafana UI from the dashboard. The Grafana UI provides additional customizability of the charts.
The logs view lets you view all the Ray logs in your cluster. It is organized by node and log file name. Many log links in the other pages link to this view and filter the list so the relevant logs appear.
To understand the log file structure of Ray, see the :ref:`Logging directory structure page <logging-directory-structure>`.
The logs view provides search functionality to help you find specific log messages.
Driver Logs
If the Ray job is submitted by :ref:`Ray job API <jobs-quickstart>`, the job logs are available from the dashboard. The log file follows the following format; job-driver-<job_submission_id>.log.
Note
If the driver is executed directly on the head node of the Ray cluster (without the job API) or run via :ref:`Ray client <ray-client-ref>`, the driver logs are not accessible from the dashboard. In this case, see the terminal output to view the driver logs.
Task and Actor Logs
Task and actor logs are accessible from the :ref:`task and actor table view <dash-workflow-state-apis>`. Click the log button.
You can see the worker logs (worker-[worker_id]-[job_id]-[pid].[out|err]) that execute the task and actor. .out (stdout) and .err (stderr) logs contain the logs emitted from the tasks and actors.
The core worker logs (python-core-worker-[worker_id]_[pid].log) contain the system-level logs for the corresponding worker.
Task and Actor Errors
You can easily identify failed tasks or actors by looking at the job progress bar, which links to the table.
The table displays the name of the failed tasks or actors and provides access to their corresponding log or error messages.
The :ref:`Metrics View <dash-metrics-view>` in the Ray dashboard provides a "per-component CPU/memory usage graph" that displays CPU and memory usage over time for each task and actor in the application (as well as system components). This allows users to identify tasks and actors that may be consuming more resources than expected and optimize the performance of the application.
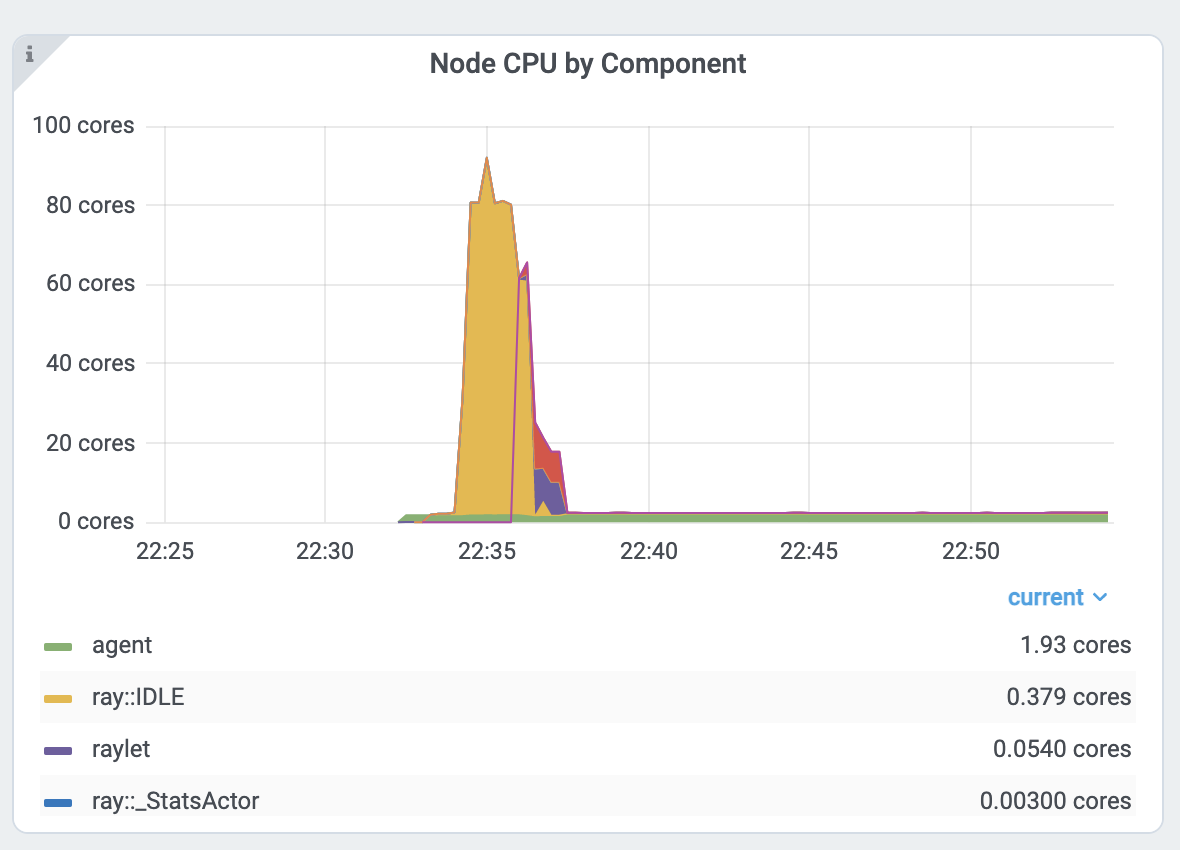
Per component CPU graph. 0.379 cores mean that it uses 40% of a single CPU core. Ray process names start with ray::. raylet, agent, dashboard, or gcs are system components.
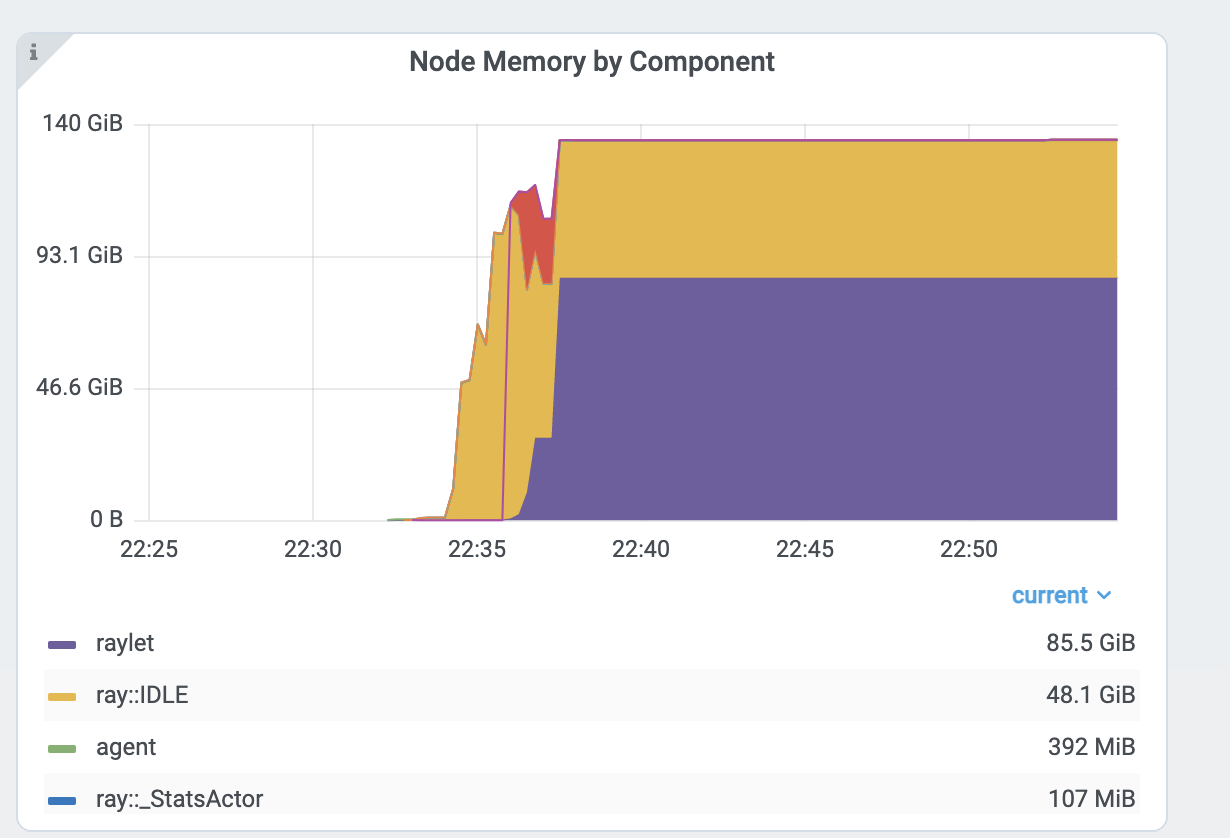
Per component memory graph. Ray process names start with ray::. raylet, agent, dashboard, or gcs are system components.
Additionally, users can see a snapshot of hardware utilization from the :ref:`cluster page <dash-node-view>`, which provides an overview of resource usage across the entire Ray cluster.
Ray requires users to specify the number of :ref:`resources <logical-resources>` their tasks and actors will use through arguments such as num_cpus, num_gpus, memory, and resource.
These values are used for scheduling, but may not always match the actual resource utilization (physical resource utilization).
- You can see the logical and physical resource utilization over time from the :ref:`Metrics View <dash-metrics-view>`.
- The snapshot of physical resource utilization (CPU, GPU, memory, disk, network) is also available from the :ref:`Cluster View <dash-node-view>`.
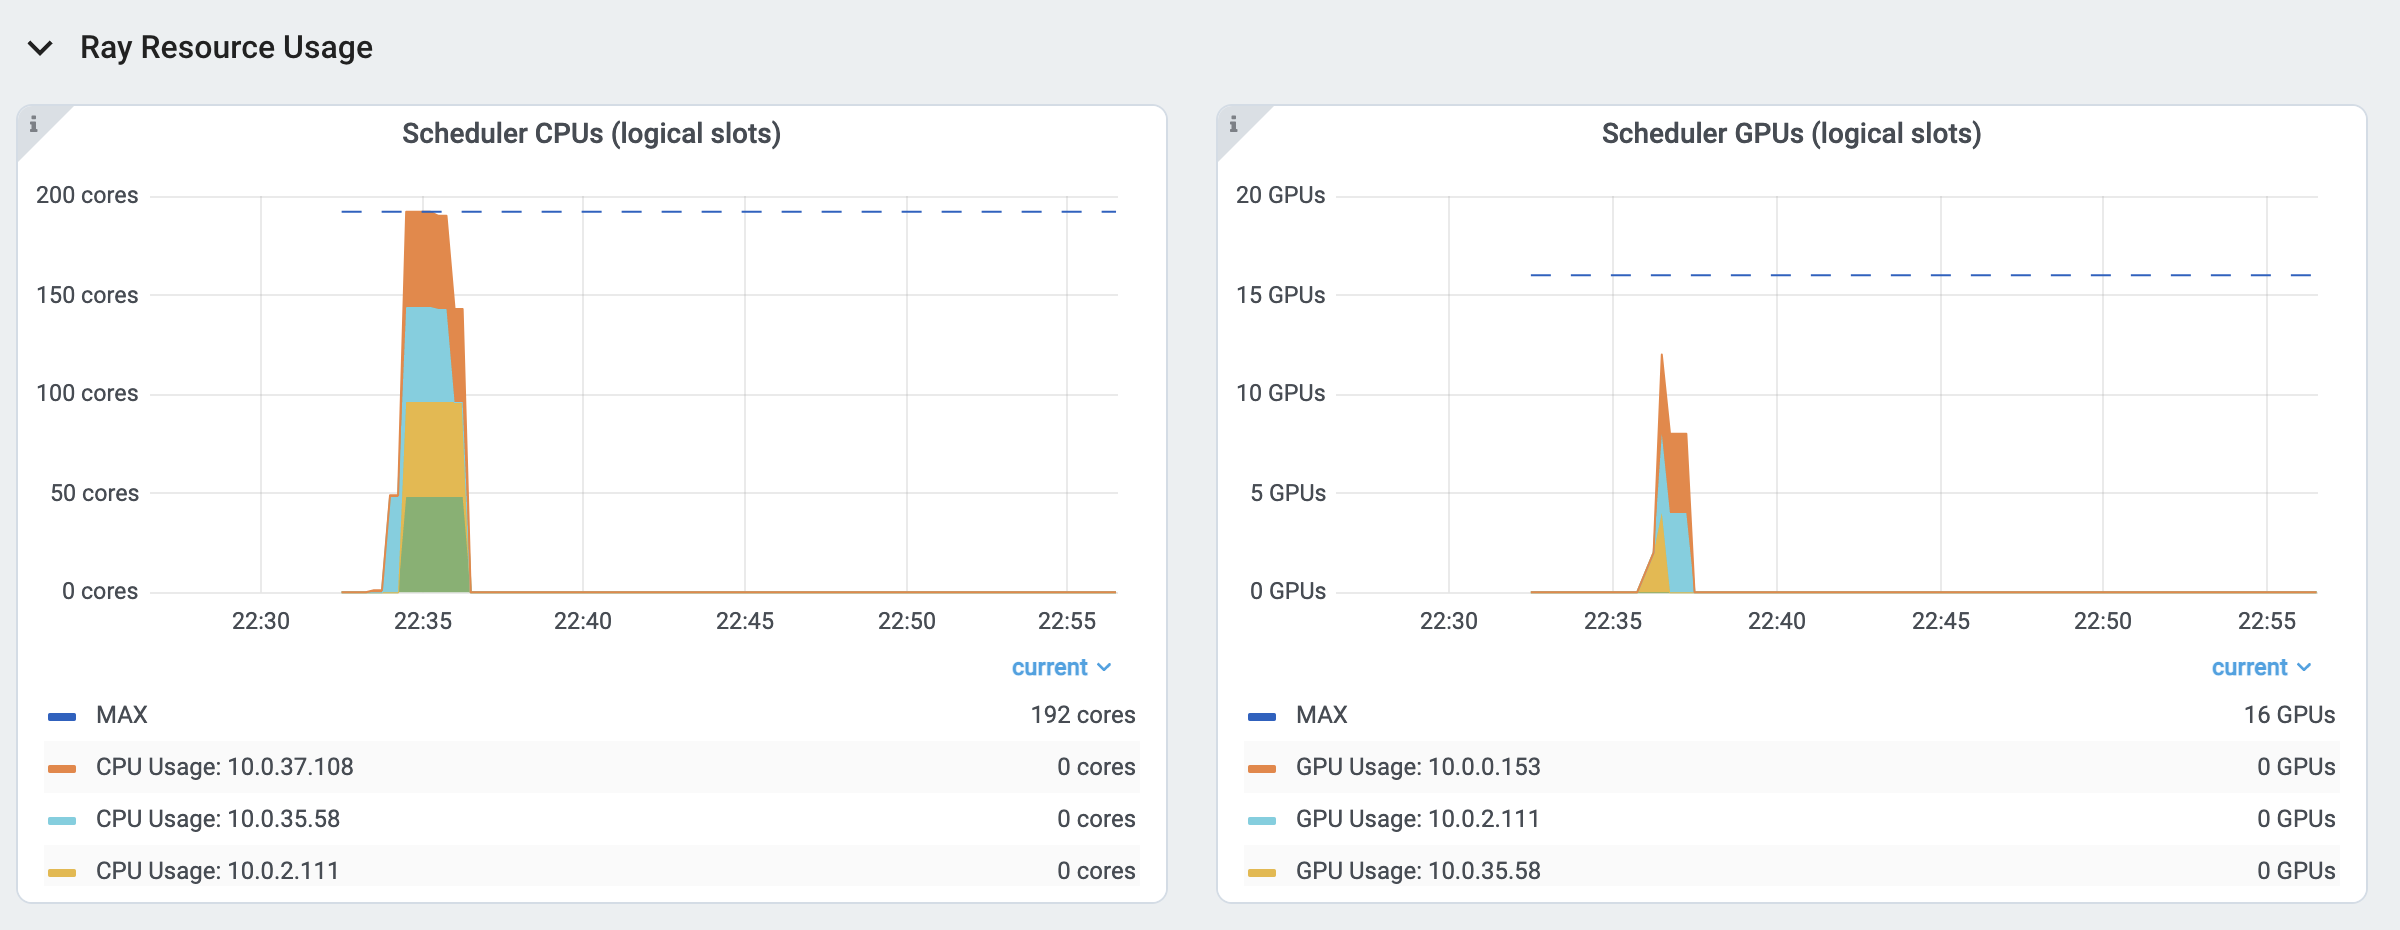
The :ref:`logical resources <logical-resources>` usage.
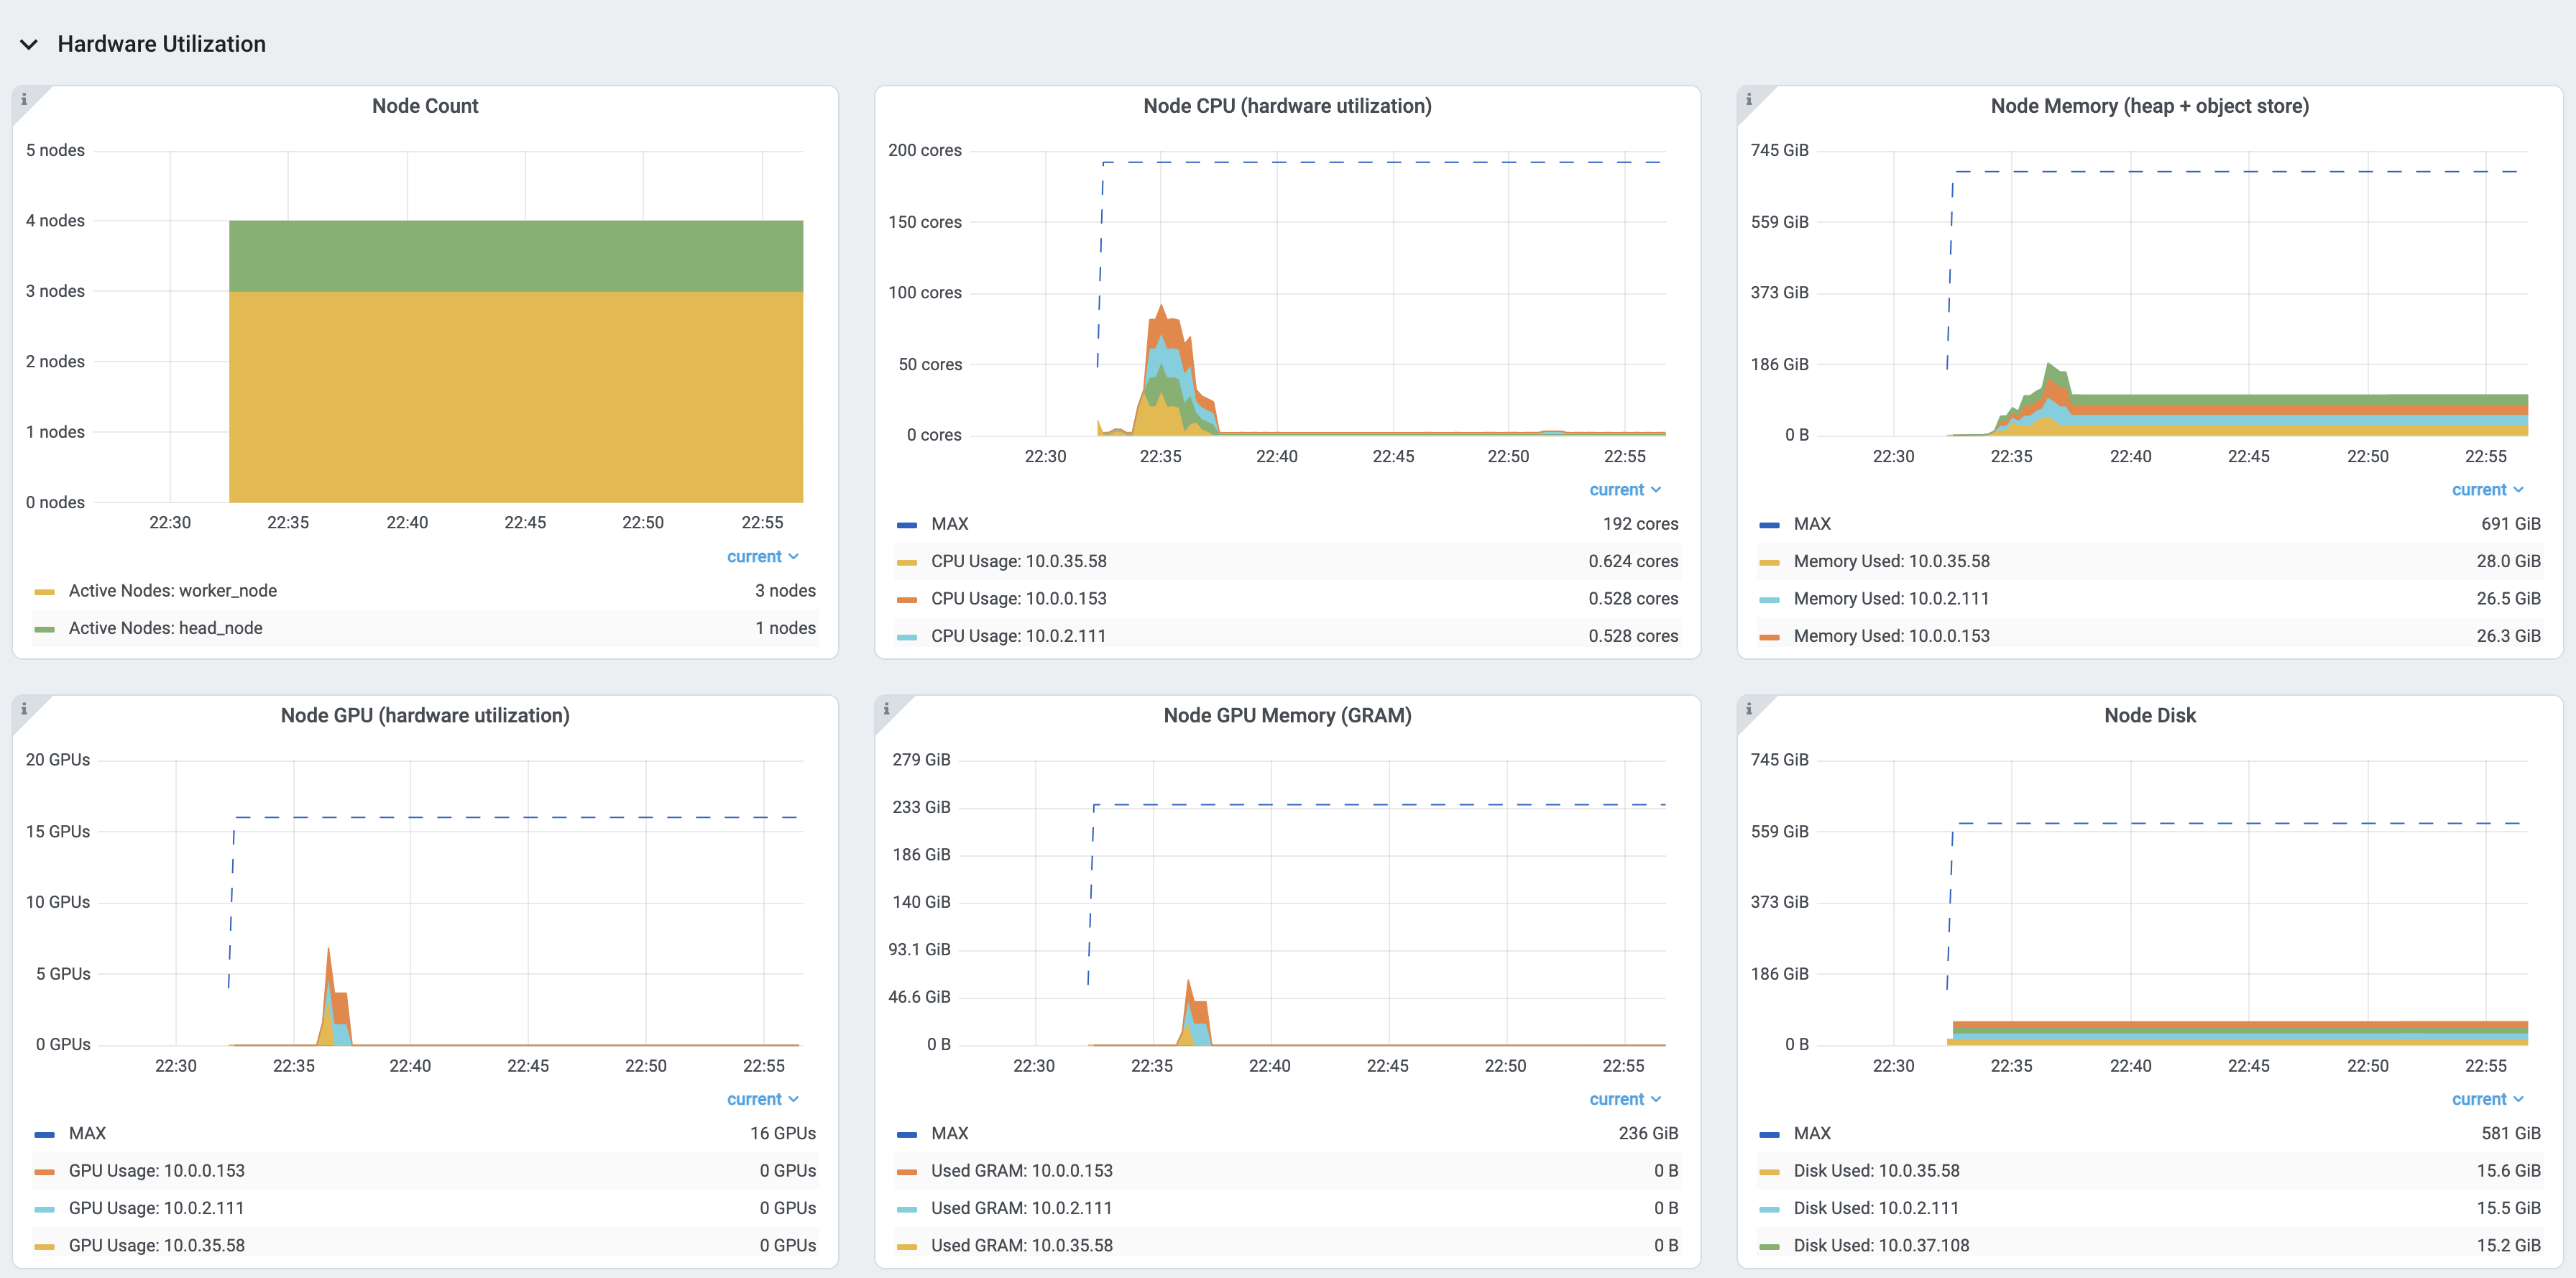
The physical resources (hardware) usage. Ray provides CPU, GPU, Memory, GRAM, disk, and network usage for each machine in a cluster.
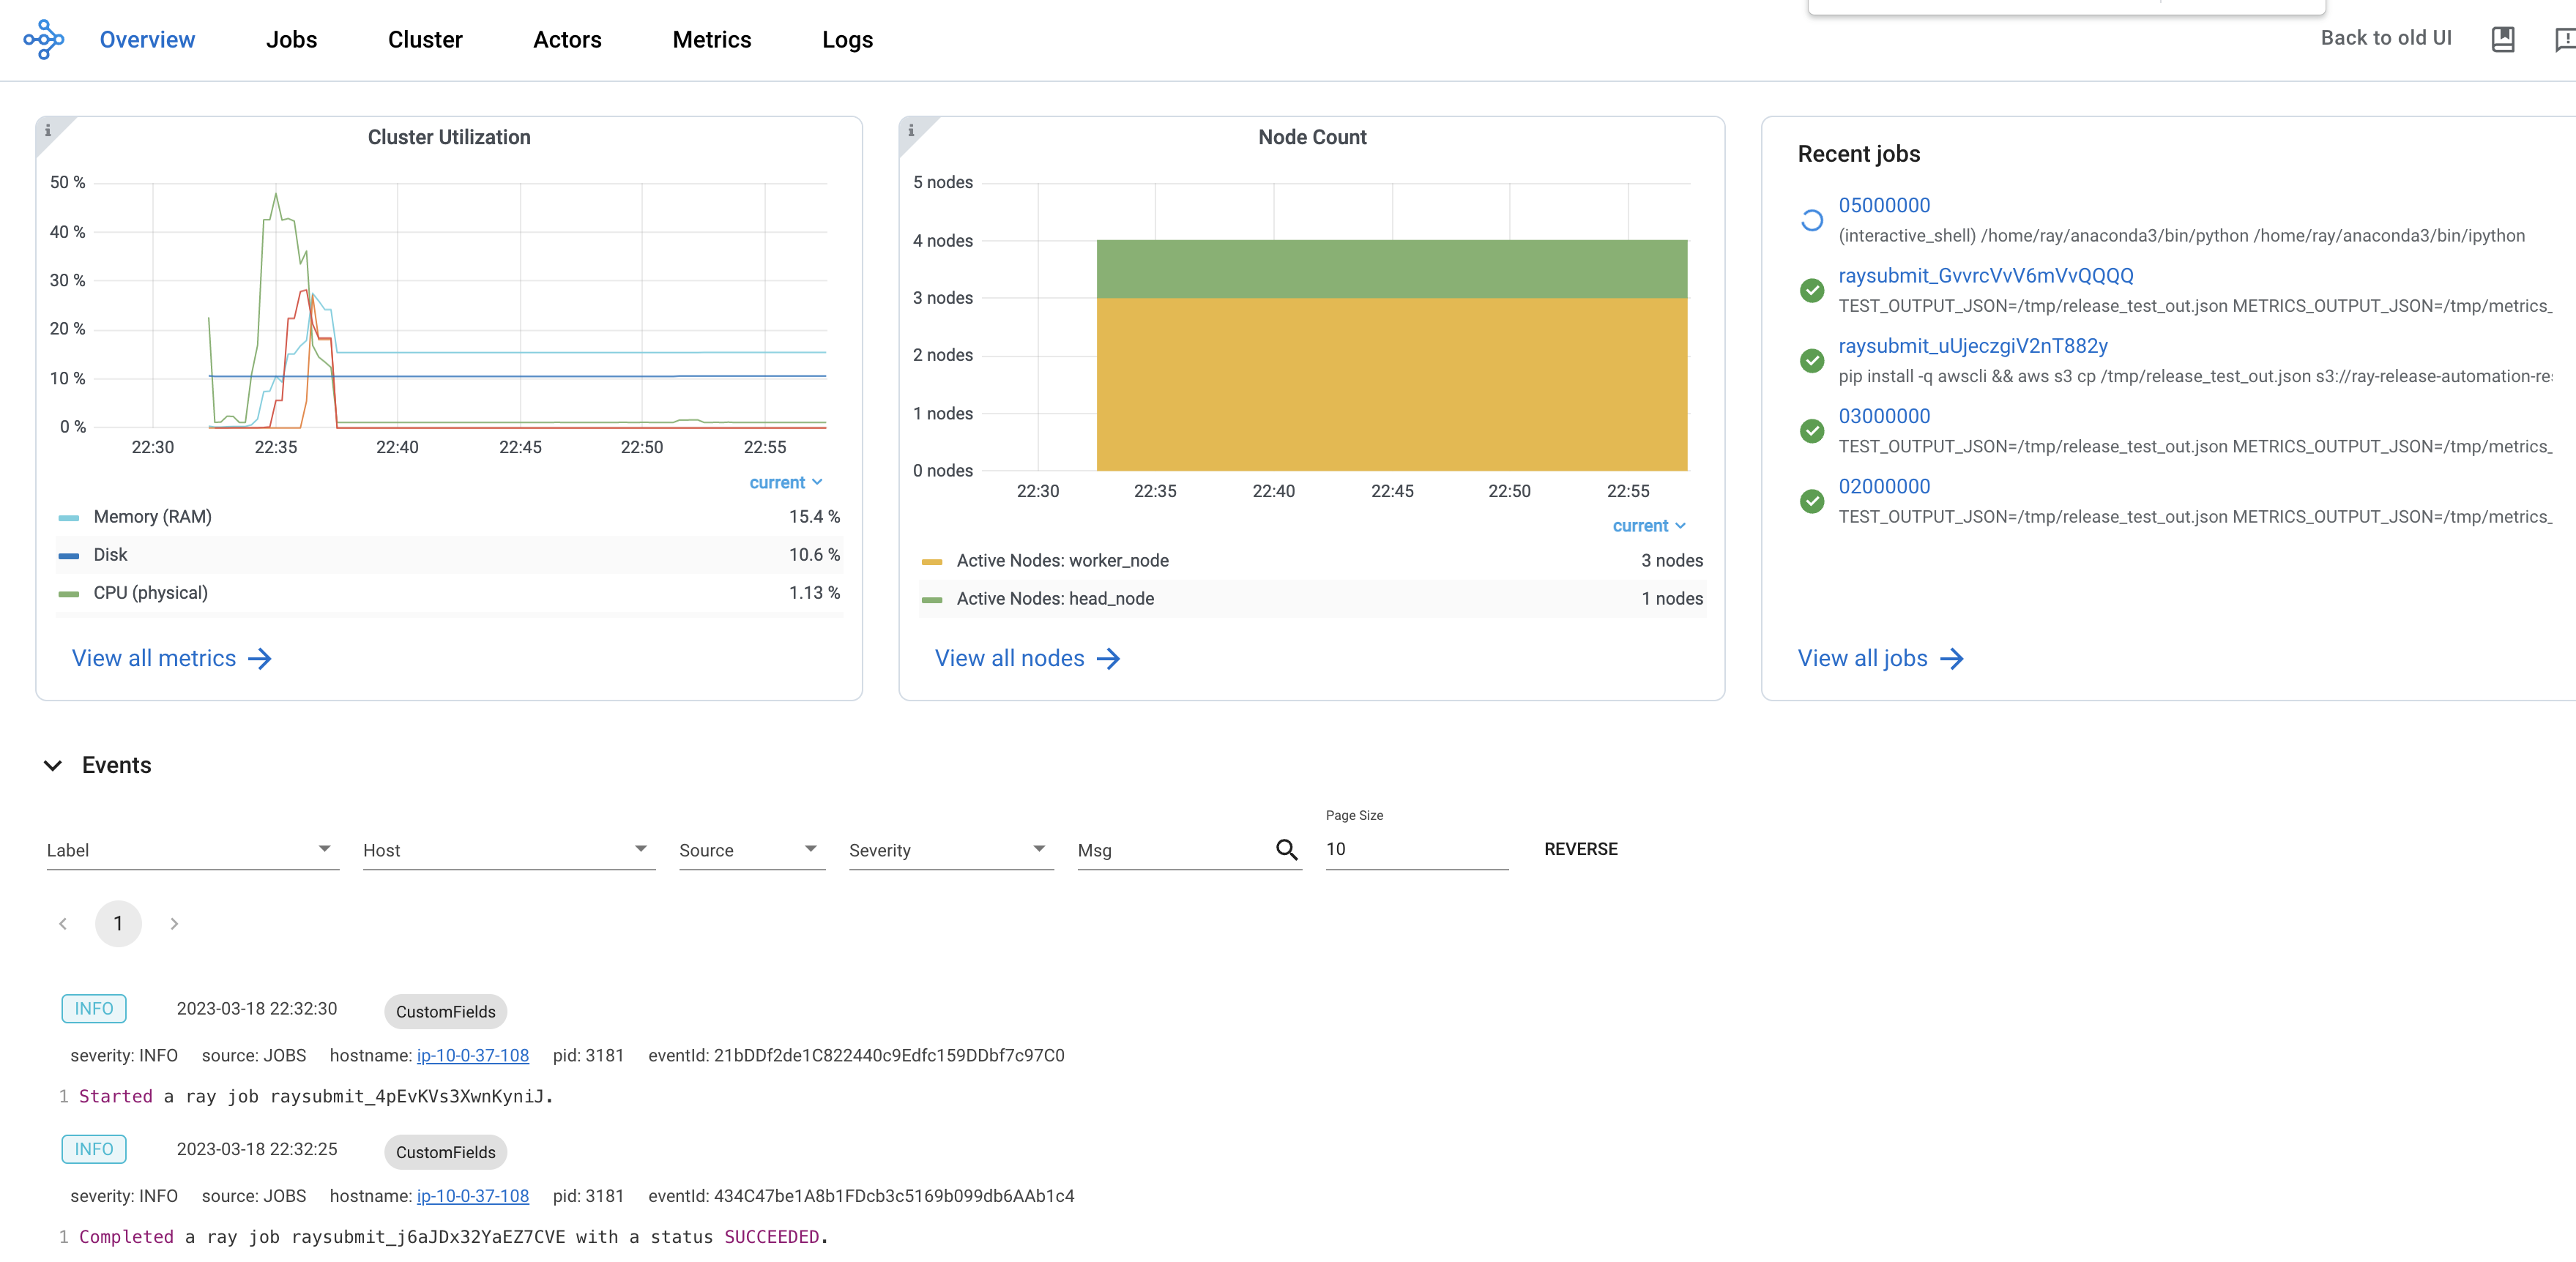
The overview page provides a high-level status of the Ray cluster.
Overview Metrics
The Overview Metrics page provides the cluster-level hardware utilization and autoscaling status (number of pending, active, and failed nodes).
Recent Jobs
The Recent Jobs card provides a list of recently submitted Ray jobs.
Event View
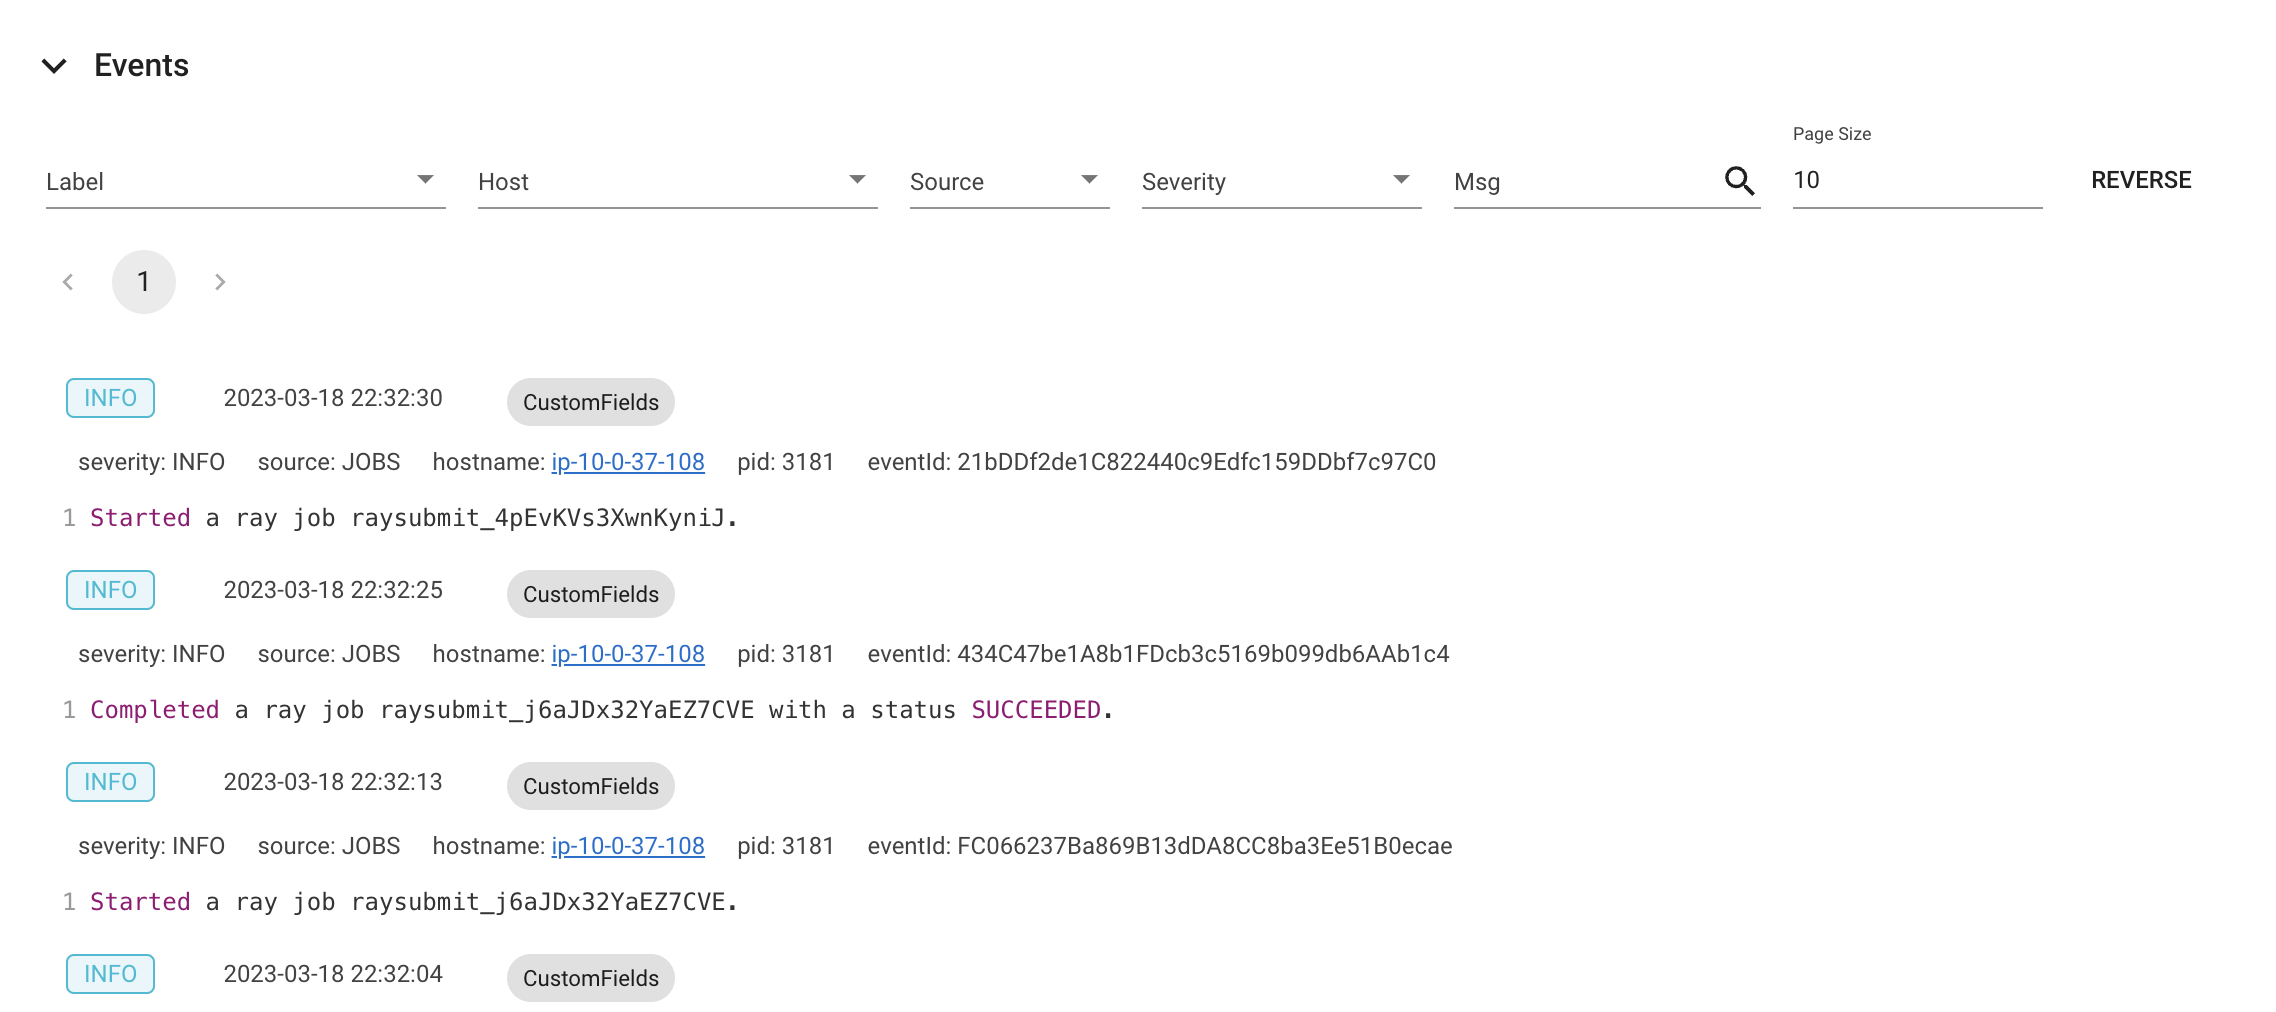
The Event View displays a list of events associated with a specific type (e.g., autoscaler or job) in chronological order. The same information is accessible with the ray list cluster-events :ref:`(Ray state APIs)<state-api-overview-ref>` CLI commands .
Two types of events are available.
- Job: Events related to :ref:`Ray job submission APIs <jobs-quickstart>`.
- Autoscaler: Events related to the :ref:`Ray autoscaler <cluster-autoscaler>`.