Blog post explaining bifurcation diagrams can be found here:
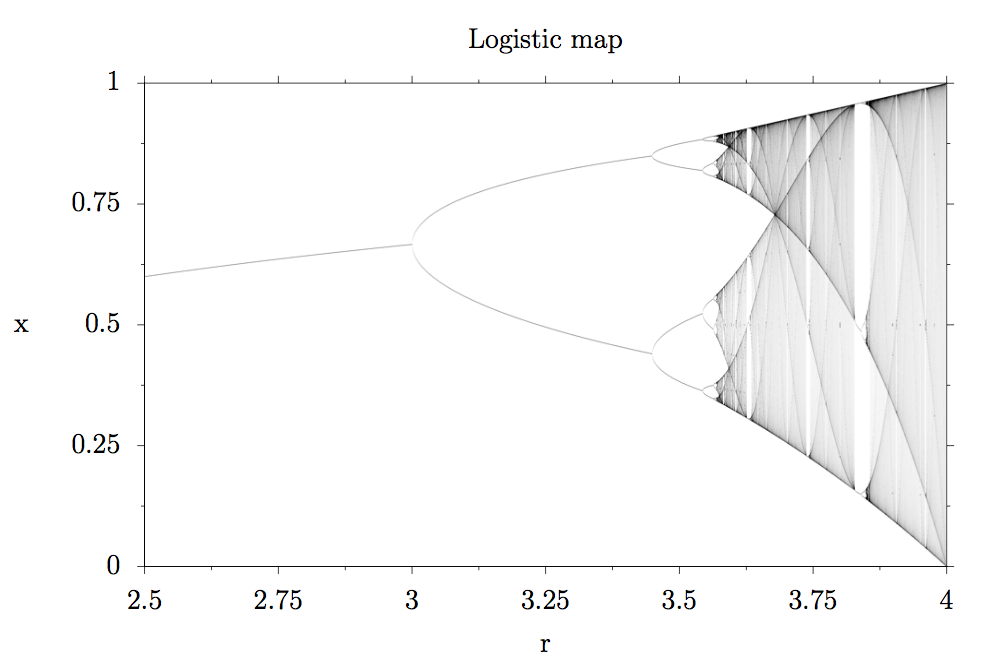
Creates bifurcation diagrams of chaotic maps and animations like these:
main.cpp shows several examples of how to create bifurcation diagrams and animations thereof.
If you notice that the bifurcations are blurry, increase transient, if the chaotic regions are noisy, increase samples.
Runtime is:
O( Num of frames * frame width * ( transient + samples + frame height ))
If your computer currently does not support OpenMP, remove the flag -fopenmp from the makefile.
Convert the created bitmaps to png (install imagemagick):
mogrify -format png bifurcation.bmp
Create a video from individual frames (install ffmpeg):
convert -delay 1 *.bmp video.mp4
To create plots, you can use the gnuplot script provided in the plots folder.


