OpenPose is the multi-person system to jointly detect human body, hand, facial, and foot key-points (in total 135 key-points) on single images.

Input image
")
Heat map (Confidence Maps)
")
Part Affinity Fields (PAFs)

Output image
This project focused on developing an end-to-end MLOps system that integrates OpenPose human pose estimation, facilitating seamless development and production workflows. The project's structure defines two primary phases: development and production.
During the development phase, emphasis is placed on exploratory data analysis (EDA), data versioning, comprehensive model experiment tracking, localized deployment procedures, and continuous integration (CI). These components are orchestrated within an end-to-end pipeline to ensure cohesion and efficiency.
In the production phase, the focus shifts to model deployment, resources monitoring, and orchestration on Kubernetes clusters. This phase ensures the sustained efficacy of the model in operational contexts, leveraging Kubernetes' capabilities to manage deployment, scaling, and monitoring efficiently.

- OpenPose human pose estimation
- Overall architecture
- Table of Contents
- Development stage
- Production stage
IMPORTANT: All the code for the development stage is in the development folder. Remember to navigate to the development directory using the cd command, and checkout branch dev before initiating any subsequent actions.
git clone https://github.com/ToDucThanh/MLOPS-human-pose-estimation.git
cd MLOPS-human-pose-estimation/production
git checkout -b dev-
Update and install neccessary dependencies:
sudo apt-get update
sudo apt-get install --no-install-recommends make build-essential libssl-dev zlib1g-dev libbz2-dev libreadline-dev libsqlite3-dev wget curl llvm libncurses5-dev xz-utils tk-dev libxml2-dev libxmlsec1-dev libffi-dev liblzma-dev
I use the zsh shell. If you use the bash shell, replace ~/.zshrc with ~/.bashrc in the following commands.
-
Install pyenv:
git clone https://github.com/pyenv/pyenv.git ~/.pyenv
echo 'export PYENV_ROOT="$HOME/.pyenv"' >> ~/.zshrc
echo 'export PATH="$PYENV_ROOT/bin:$PATH"' >> ~/.zshrc
-
Next, add pyenv to ~/.zshrc
echo -e 'if command -v pyenv 1>/dev/null 2>&1; then\n eval "$(pyenv init -)"\nfi' >> ~/.zshrc
-
Run:
exec "$SHELL"
-
Now we have installed pyenv. To check if the installation was successful or not, you can use the following command:
pyenv --version
-
Install python 3.9.2
pyenv install 3.9.2
-
Set a global Python version for the entire system
pyenv global 3.9.2
-
Install poetry with curl (RECOMMENDED)
curl -sSL https://install.python-poetry.org | python - -
Configure poetry
poetry config virtualenvs.create false
poetry config virtualenvs.in-project true
python -m venv .venv
poetry install
You can also install and configure pre-commit if you would like to use it:
poetry run pre-commit installInstall docker as instructions: Docker installation
We also push images to Docker Hub. You need to log in to Docker by using the following command:
docker loginYou will be prompted to enter your Docker Hub username, password, and email address (optional). After successful authentication, you can proceed with your Docker tasks, such as pushing or pulling images from Docker Hub.
- Log in to your Google Cloud Console.
- Navigate to the project creation page by clicking on the following link: Create a project
- Enter a name for your project in the designated field.
- (Optional) Customize the project ID if needed. The project ID must be unique across all GCP projects.
- Select your billing account for the project. If you don't have a billing account set up, you'll need to create one.
- (Optional) Choose your organization if you're creating the project within an organization.
- Click on the "Create" button to create your project.
After project creation, your project appears as follows:

Google cloud (Gcloud) CLI can be installed following this document: Gcloud CLI installation. The Gcloud CLI includes the gcloud, gsutil and bq command-line tools.
After completing the installation process, you need to authenticate with GCP in order to access and manage resources. To do this, follow these steps:
-
Run the following command to log in to your Google Cloud account:
gcloud auth login
This command will open a browser window prompting you to log in to your Google account. Follow the instructions to complete the authentication process.
-
Next, run the following command to authenticate your application default credentials:
gcloud auth application-default login
This command will authenticate your application with your Google Cloud account using the default credentials. This is necessary for applications running on your local machine to access Google Cloud services.
Then, you'll need to initialize your Google Cloud configuration using the gcloud init command. This command helps you set up your default project, region, and other configurations for interacting with Google Cloud services from your local environment:
gcloud initYou'll be prompted to select your Google Cloud project, choose a default Compute Engine zone, and configure other settings as needed.
You can check your configuration using gcloud config configurations list command:

- Log in to your Google Cloud account.
- Navigate to bucket creation page: Create a bucket
- Configure the bucket settings:
- Name: Enter a globally unique name for your bucket. Bucket names must be unique across all of Google Cloud Storage. My bucket name is:
human-pose-data-bucket. - Location: Choose the location where you want to store your data. This determines the region where your data will physically reside. In this project, I decided to use Region
asia-southest1. - Storage class: Select the storage class that best fits your use case (e.g., Standard, Nearline, Coldline). In this project, I decided to use
Standard. - Choose additional options: Configure additional options such as access control, object versioning, and logging. In this project, I decided to use
Soft DeleteandObject Versioning.
- Name: Enter a globally unique name for your bucket. Bucket names must be unique across all of Google Cloud Storage. My bucket name is:
- Click Create: Review your settings and click the "Create" button to create your bucket.
The bucket is already created:

The data of this project is the COCO 2014 dataset. You can run the script download_data.sh to download the data.
-
Option 1 (If you have access to a GPU with high computational power and memory bandwidth, unfortunately, it's not available to me. 😢)
bash download_data.sh
The bash script
download_data.shis provided below:#!/bin/bash data_dir="./data/raw" val_data_link="https://images.cocodataset.org/zips/val2014.zip" train_data_link="https://images.cocodataset.org/zips/train2014.zip" target_val_data_path="$data_dir/val2014.zip" target_train_data_path="$data_dir/train2014.zip" label_link="https://www.dropbox.com/s/0sj2q24hipiiq5t/COCO.json?dl=1" target_label_path="$data_dir/label.json" mask_data_link="https://www.dropbox.com/s/bd9ty7b4fqd5ebf/mask.tar.gz?dl=0" mask_data_path="$data_dir/mask.tar.gz" if [ ! -d "$data_dir" ]; then mkdir -p "$data_dir" fi ## Download label file if [ ! -f "$target_label_path" ]; then wget -O "$target_label_path" "$label_link" fi ## Download mask data if [ ! -f "$mask_data_path" ]; then wget -O "$mask_data_path" "$mask_data_link" tar -xzvf "$mask_data_path" -C "$data_dir" fi ## Download and unzip val data if [ ! -f "$target_val_data_path" ]; then wget -O "$target_val_data_path" "$val_data_link" unzip "$target_val_data_path" -d "$data_dir" fi ## Download and unzip train data if [ ! -f "$target_train_data_path" ]; then wget -O "$target_train_data_path" "$train_data_link" unzip "$target_train_data_path" -d "$data_dir" fi
The dataset includes four parts: mask data, labels, training data, and validation data. The training and validation data sets are large, so if your internet connection is slow, you can manually download them via the following links:
- train data: train_data_link (~12.6GB)
- validation data: valid_data_link (~6.2GB)
-
Option 2 (if your resources are limited) (RECOMMENDED)
With this option, we only download the validation COCO 2014 dataset. We will split the data in val2014 dataset into training and validation dataset. You can comment out the code for downloading and unzipping the train data in the bash script
download_data.shabove and then run it, or manually download if your internet connection is slow.
========= This project will continue with option 2 😊 =========
After finishing downloading the data, our data will be organized as the following structure:
├── data/
│   ├── raw/
│   │   ├── mask/
│   │   │
│   │   │
│   │   ├── val2014/
│   │
│   │
│ ├── label.jsonWe generate a subset of the data for faster experimentation.
Example: Generating subset label data using only first 100 images.
poetry run python generate_subset_label_data.py --num_samples 100Now our data structure will be:
├── data/
│   ├── raw/
│   │   ├── mask/
│   │   │
│   │   │
│   │   ├── val2014/
│   │
│   │
│   ├── label.json
│ ├── label_subset.jsonWe will use DVC to version data. DVC pushs the metadata files and references (such as checksums or hash values) that represent the data to a remote. In this project the remote is Google Cloud Storage bucket we created in Create Google Cloud Storage bucket. Additionally, we also tag each data version with a release tag.
Remember to replace the dvc_remote_url inside config.yaml with your GCS bucket

If this is the first time you are executing this data versioning process, simply run the following command in your terminal:
make version-data-firstIf this is the first time running the data versioning process, you will observe the following outcomes:

Release tag on github:

Data pushed to Google Cloud Storage bucket:

After your first time, whenever you need to version new changes to your data, execute the following command:
make version-dataRun the following command to open jupyter lab at localhost:8888
make jupyterYou can refer to this notebook explore_data.ipynb notebook to explore the data and perform EDA, possibly to gain a better understanding of the dataset's structure, contents, and any potential insights it may offer.
To track the training experiments, we'll spin up the MLflow server. The backend storage of this tracking server is Postgres and the artifact storage is MinIO. Before start up the server, we first need to generate MINIO_ACCESS_KEY and MINIO_SECRET_ACCESS_KEY.
Run the following command to access the MinIO UI at localhost:9001:
make minio
The username and password are stored in the .env file

Steps to generate the MINIO_ACCESS_KEY and MINIO_SECRET_ACCESS_KEY:
- Access
localhost:9001. - Navigate to Access Keys page.
- Click Create access key and create.
- Replace your
MINIO_ACCESS_KEYandMINIO_SECRET_ACCESS_KEYwith the ones in .env file.

Run the following command to access the Mlflow UI at localhost:5001:
make mlflowNow is the moment we've all been waiting for: (TRAINING!!!!!🔥). First, let's delve into some configurations for the training experiment.

As discussed above, we proceed with option 2 in Download data and use only subset of data generated in Generate subset of data (the first 100 images from val2014/ dataset) for faster experimentation.
Run the following command to start training:
make trainNOTE: Since I've enabled system metric logging for Mlflow (by setting MLFLOW_ENABLE_SYSTEM_METRICS_LOGGING=true in the .env file) to measure GPU metrics, the training process will take some time to start. If you don't need to measure GPU metrics, you can turn it off by uncommenting this line in the task_train.py script:
os.environ["MLFLOW_ENABLE_SYSTEM_METRICS_LOGGING"] = "false"
We can see all runs of the experiment at localhost:5001:
![]()
Model metrics:

System metrics:

We can also view the artifacts saved in MinIO storage:

Run the following command to download the weight from MinIO and save it to the folder src/weights. This weight will be used by FastAPI to make predictions.
make download-weightThe mechanism of how the download process works:
-
Identification of Finished Runs: Initially, the script scans through all runs marked as 'FINISHED' within the designated experiment,
openpose-human-pose-trainingfrom mlflow. You can adjust the experiment name via the config/config.yaml file. Note that this experiment is automatically created during the training phase. -
Download and Storage: Upon identification, the system retrieves the weight associated with the minimum validation loss (val_loss) and stores it in the src/weights directory.
-
Validation Check for Download: Additionally, the download process is triggered only if the val_loss of the current weight in the src/weights directory (if it already exists) is equal to or greater than that of the new model weight from MinIO. For further insights and implementation details, refer to the script development/task_download_best_weight_from_minio.py.
Run the followling command to start the FastAPI server at localhost:8000:
make app-localNavigate to https://localhost:8000 in your web browser to access your FastAPI app locally. You can send an image and get the predictions:

You can also use a Docker container to deploy the FastAPI application. Run the following command and open localhost:8000 to perform inference:
make app-dockerNOTE: If you do not see any predictions on the response image, it is understandable because we only trained on a small subset of the data. You can download the weight from the following link and put it in the src/weights directory to obtain the result.
Link download: weight
The pipeline include several tasks metioned above: data versioning, model training, weight validation and image pushing to Docker Hub. All these tasks run sequentially.
- Data versioning (Part 3. Data version): This task ensures that the data used for model training is appropriately versioned. If there is a new data version, it will push hashed data to Google Cloud Storage and release a tag on GitHub.
- Model training (Part 5. Train): This task trains the OpenPose model with tracking from the MLflow server.
- Weight validation: This task checks the model metrics and downloads weights from MinIO if they meet certain conditions.
- Image pushing to Docker Hub: This task receives the status from the Weight Validation task to determine whether to push a new image to Docker Hub.
Run the followling command to start the whole pipeline:
make pipeline- Follow the link to install Ngrok: install ngrok
- Sign up for the account: https://dashboard.ngrok.com/signup
- Follow the instructions to add your authtoken.
Run the following command to spin up Jenkins:
make jenkinsNext steps:
-
Open your web browser and navigate to
https://localhost:8081. You'll be prompted to unlock Jenkins by providing an initial admin password. -
Get initial admin password: To retrieve the initial admin password, run the following command in your terminal:
docker exec jenkins-container cat /var/jenkins_home/secrets/initialAdminPassword -
Complete setup: Follow the on-screen instructions to complete the setup wizard. You can install recommended plugins or choose to install plugins later.
-
Create an admin user: After plugin installation, create an admin user for Jenkins.
-
Once the setup is complete, you can start using Jenkins.
We will use Docker to run CI in Jenkins. Follow the steps below to install these plugins.
- Navigate to Jenkins Dashboard and go to Manage Jenkins.
- In the Manage Jenkins section, click on Manage Plugins.
- Navigate to the Available tab, which lists all available plugins that can be installed.
- Search for Docker Pipeline and Docker plugin and install them.
- Click on the "Install without restart" button. This will download and install the selected plugin(s) without requiring a Jenkins restart.


Run the following command:
ngrok http https://localhost:8081Once you've made your Jenkins instance accessible via Ngrok, you can configure GitHub webhooks to trigger Jenkins builds automatically whenever there are new commits or pull requests pushed to your repository.
- Payload URL:
Ngrok url+github-webhook/. Example:https://ac53-2405-4803-ed32-c86b-f737-d778.ngrok-free.app/github-webhook/ - Content type: application/json
- Let me select individual events: pull requests, pushes


-
Create the Multibranch Pipeline
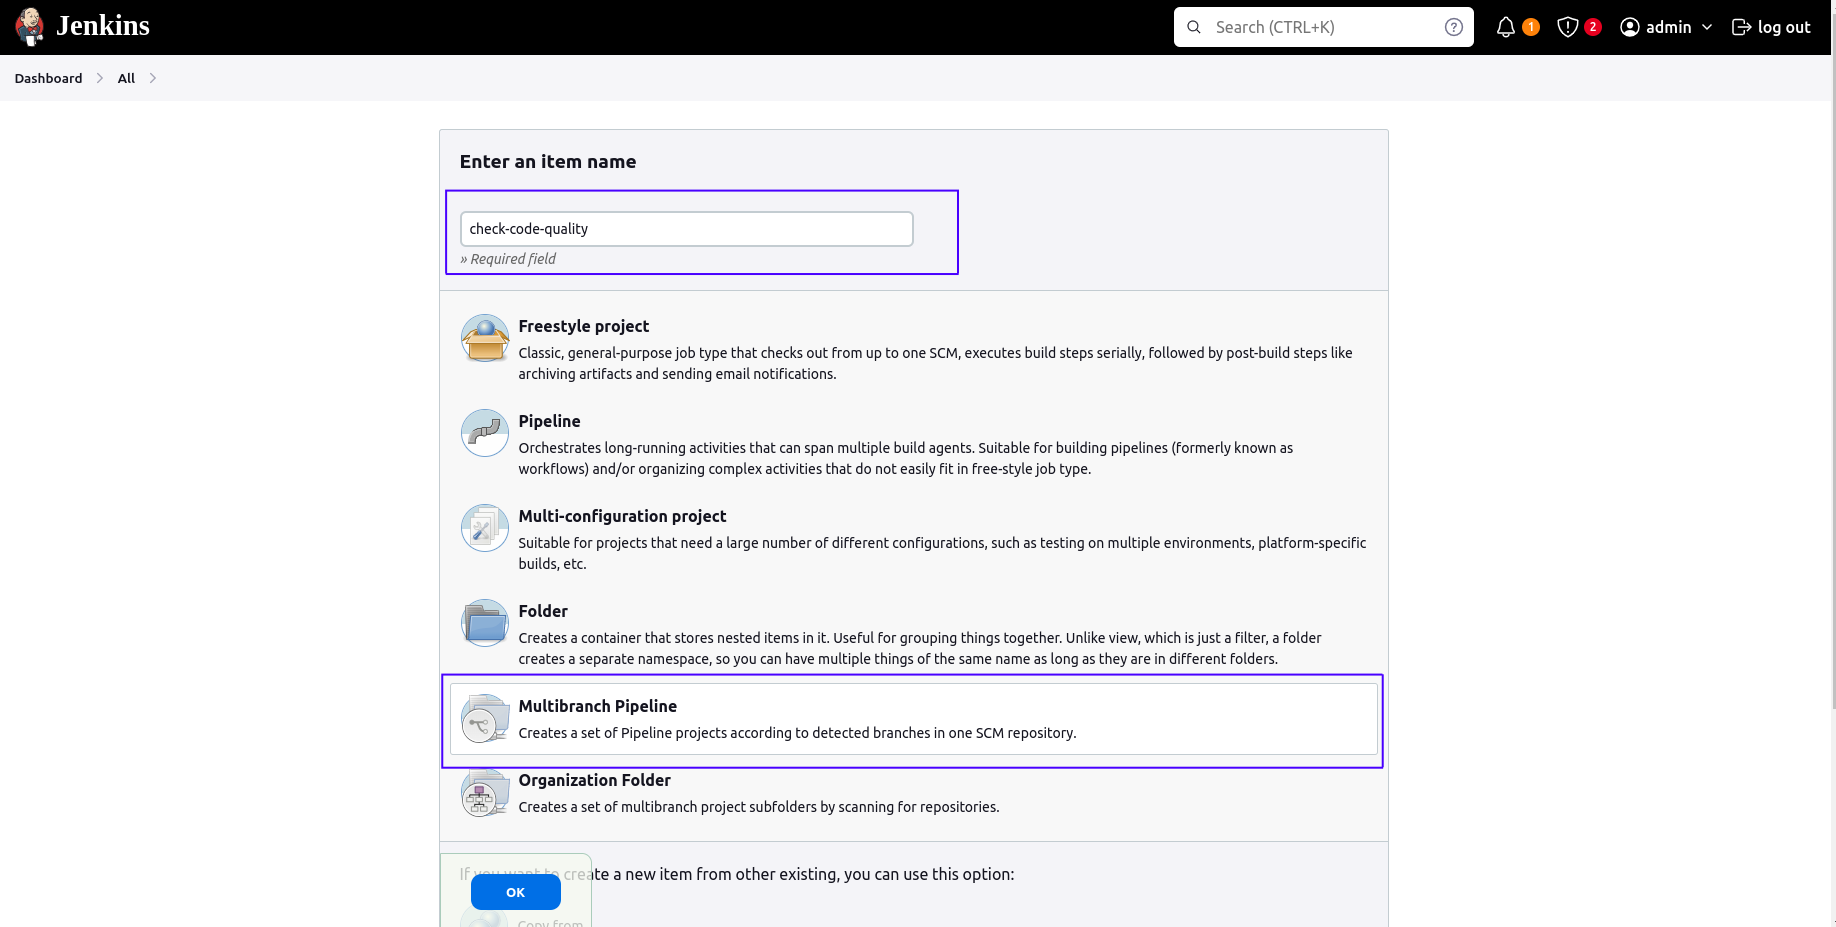
-
Configure the Multibranch Pipeline
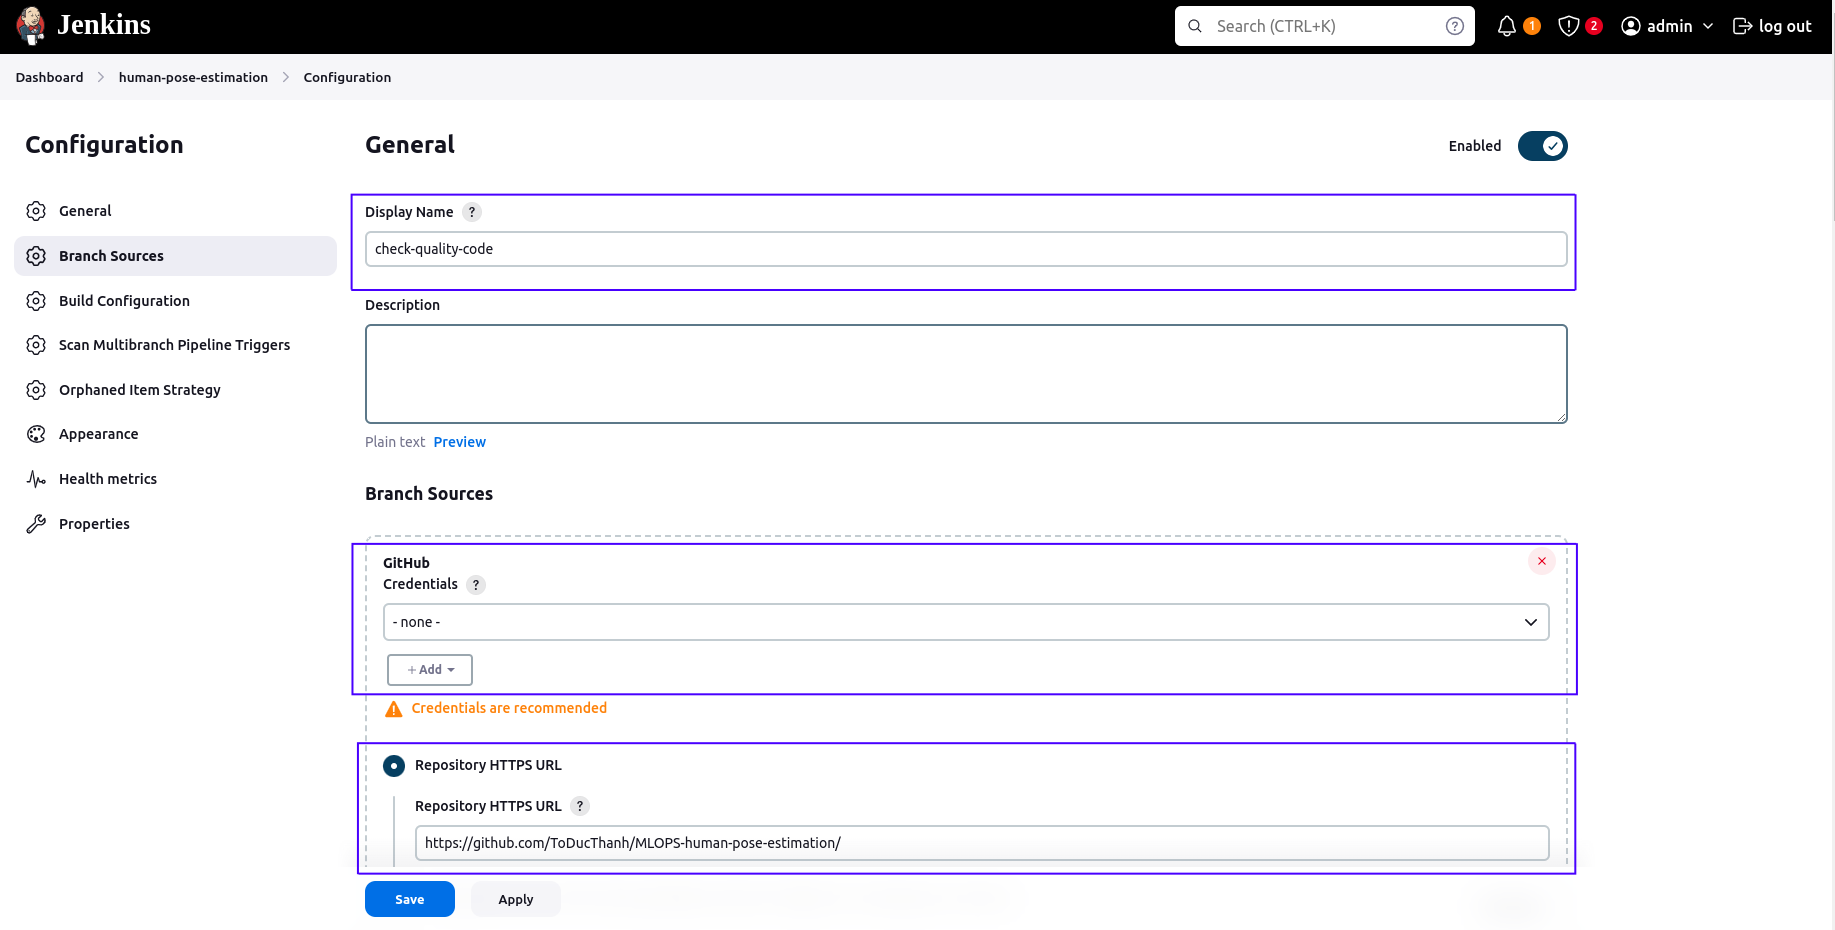
-
Add credential (personal access token) created at Generate personal access tokens (classic) to Password.
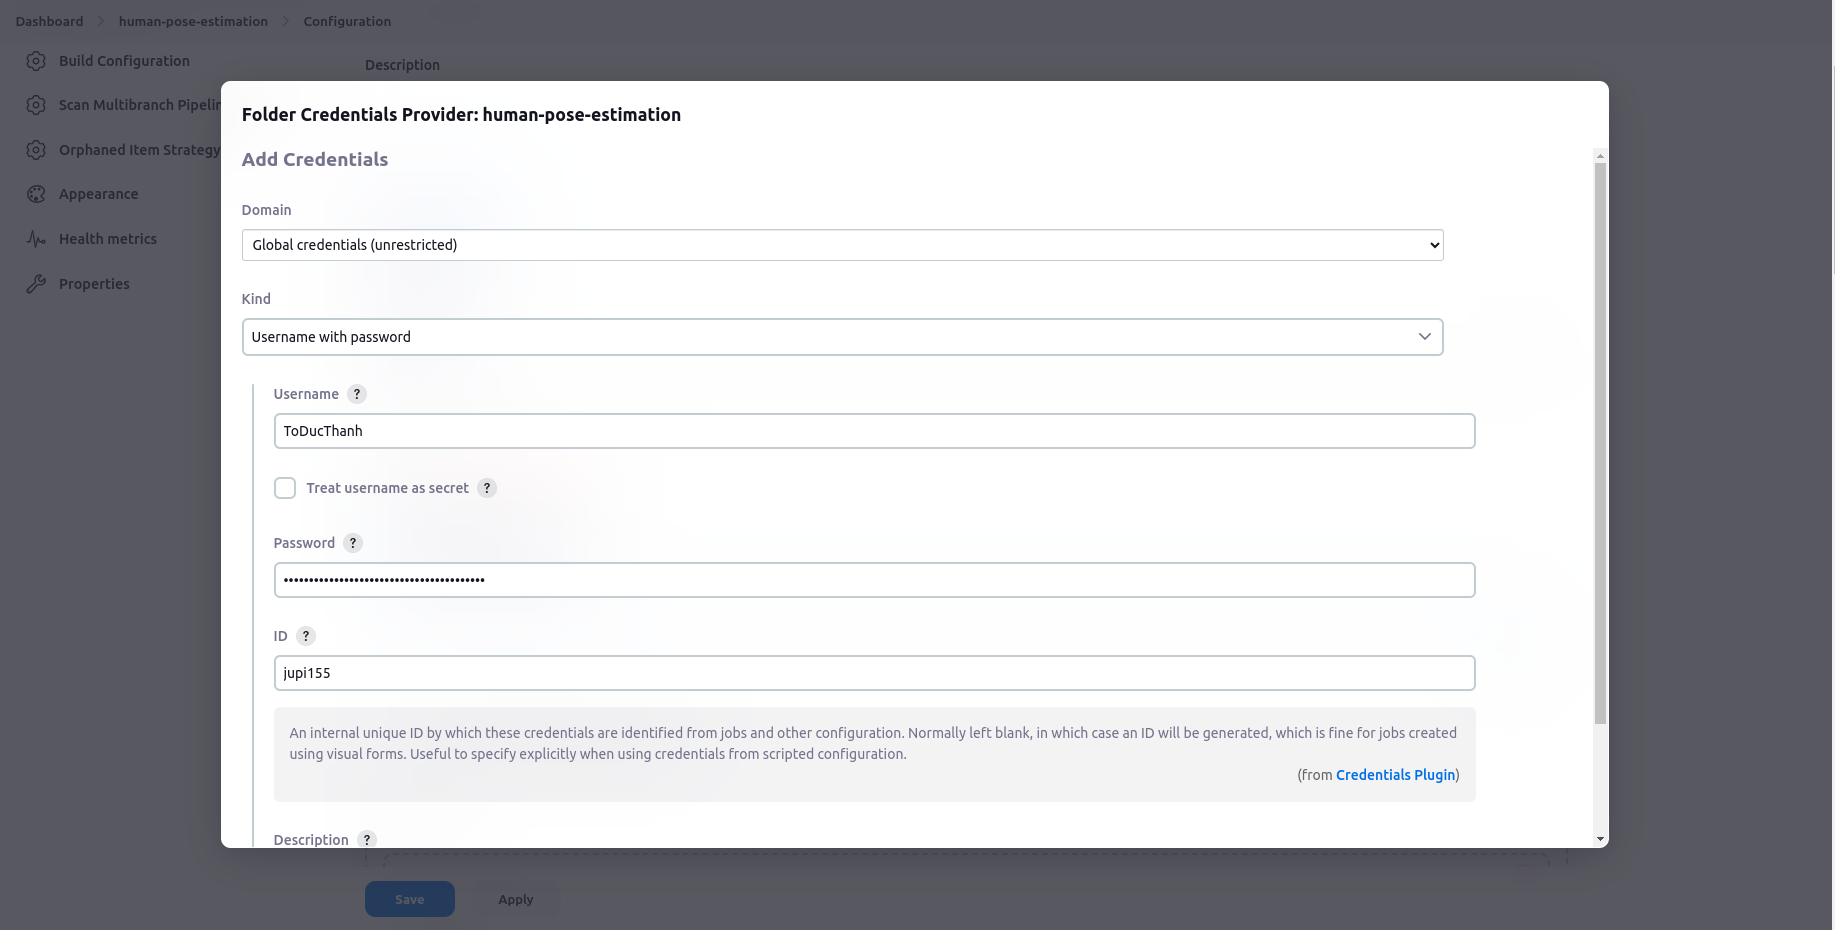
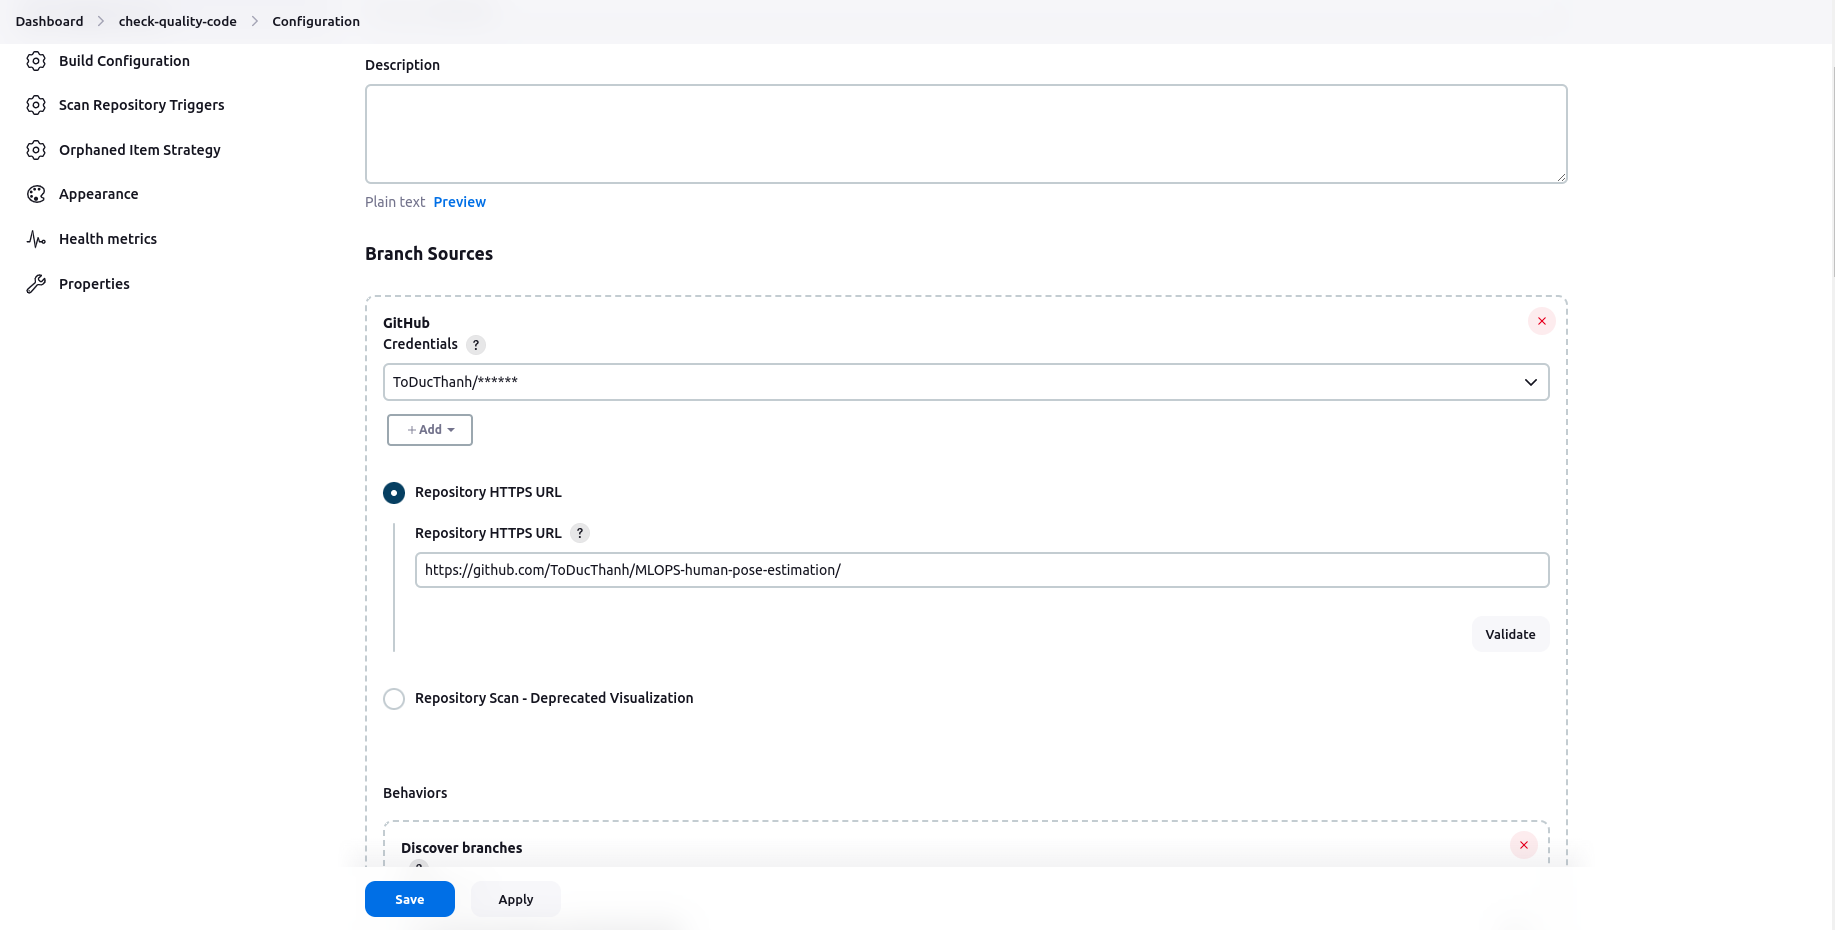
-
Modify Github API usage rate limit


After completing the setup, every time you push or create a pull request, Jenkins will trigger and check your code quality (based on the rules in the Jenkinsfile). If all checks pass, your push or pull request will proceed.
Follow below steps to install aws-cli:
curl "https://awscli.amazonaws.com/awscli-exe-linux-x86_64.zip" -o "awscliv2.zip"
unzip awscliv2.zip
sudo ./aws/installaws ec2 create-key-pair -key-name terraform-key --key-type rsa --key-format --query "KeyMaterial" --output text > jupiter-ec2.pemFollow steps in Install terraform, then do the following commands:
cd terraform_dev
terraform init
terraform plan
terraform apply
Wait until the EC2 is set up.

Ssh to ec2 instance above and run the following commands to install Jenkins:
sudo apt update
sudo apt-get install apt-transport-https ca-certificates curl software-properties-common

curl -fsSL https://download.docker.com/linux/ubuntu/gpg | sudo apt-key add -
sudo add-apt-repository "deb [arch=amd64] https://download.docker.com/linux/ubuntu  $(lsb_release -cs)  stable"
sudo apt update
sudo apt-get install docker-ce
sudo systemctl start docker
sudo systemctl enable docker
sudo groupadd docker
sudo usermod -aG docker ubuntu

docker run -u root -d --name jenkins-contaner -p 8080:8080 -v jenkins-data:/var/jenkins_home -v /var/run/docker.sock:/var/run/docker.sock -v "$HOME":/home jupi15docker/jenkins
Then, follow steps in Set up Jenkins in part A
Results:

IMPORTANT: All the code for the development stage is in the production folder. Remember to navigate to the production directory using the cd command before initiating any subsequent actions.
# Clone git if you have not done it.
git clone https://github.com/ToDucThanh/MLOPS-human-pose-estimation.git
cd MLOPS-human-pose-estimation/productionRefer to Create a project in Google Cloud Platform (GCP) in development stage.
Navigate to the following link to enable Kubernetes Engine API: Kubernetes Engine API

Refer to Install and setup Google Cloud CLI in development stage.
Run the following command in your terminal:
sudo apt-get install google-cloud-cli-gke-gcloud-auth-plugin- Navigate to Service acounts and click "CREATE SERVICE ACCOUNT".
- Select
Kubernetes Engine Adminrole. - Create new key as json type for your service account. Download this json file and save it in terraform/.credentials directory. Update credentials in terraform/main.tf with your json directory.
- Navigate to IAM and click on "GRANT ACCESS". Then, add new principals; this principal should be your service account. Finally, select the
Ownerrole.
After completion, this is the result:

-
Download terraform as instructions via this link: Download terraform
-
Get terraform version and update required_version in terraform/main.tf


Kubectl, kubectx, and kubens are tools that can help with navigating clusters and namespaces in Kubernetes. Kubectl is a command-line tool that can be used to deploy applications, inspect resources, and view logs. Kubectx and kubens can help with faster context switching, which can reduce the need for manual command modifications.
- Install kubectl: kubectl
- Install kubectx and kubens: kubectx and kubens
Helm helps you manage Kubernetes applications — Helm Charts help you define, install, and upgrade even the most complex Kubernetes application.
- Install helm: helm
Update your project_id in terraform/variables.tf and then, run the following command:
cd terraform
terraform init
terraform plan
terraform apply
The GKE cluster I configured has 1 node and its machine is "e2-standard-4" (4 CPU and 16 GB Memory)

-
Navigate to GKE UI
-
Click on the vertical ellipsis icon and choose "Connect". A popup window will appear, displaying options to connect to the cluster as follow:

-
Copy and run the command in the terminal:
gcloud container clusters get-credentials [YOUR CLUSTER] --zone [YOUR REGION] --project [YOUR PROJECT ID]
-
Check the connection from local using
kubectx


TIP: I set an alias 'k' for 'kubectl' for faster typing. 😆
alias k='kubectl'NGINX Ingress Controller is a popular solution used in Kubernetes environments to manage incoming traffic to applications running in the cluster. It serves as a load balancer, routing external traffic to the appropriate services within the Kubernetes cluster based on defined rules and configurations.
Run the following command to deploy it:
cd helm_charts/nginx_ingress
k create ns nginx-ingress # Create the namespace nginx-ingress
kubens nginx-ingress # Switch to namespace nginx-ingress
helm upgrade --install nginx-ingress-controller .
Verify if the pod is running in the namespace nginx-ingress:

IMPORTANT: Our application receives images through Nginx Ingress routing. Typically, these images are in MB (e.g., 10 MB). To accommodate large image sizes without encountering a '413 Entity Too Large' error, we must configure Nginx Ingress accordingly.
We can configure the size in production/helm_charts/nginx_ingress/values.yaml:

We will deploy the FastAPI app to GKE in the namespace model-serving. It will be deployed with a NodePort type (nginx ingress will route requests to this service) and maintained by a Deployment with 2 replica pods.
cd helm_charts/app
k create ns model-serving
kubens model-serving
helm upgrade --install pose-estimation-app .
Wait several minutes until it deployed sucessfully.
Now, we will test the app, do the following steps:
-
Obtain the IP address of nginx-ingress
k get ing
-
Add the domain name
human-pose-estimation.comof this IP to /etc/hosts where the hostnames are mapped to IP addresses.sudo nano /etc/hosts [YOUR_INGRESS_IP_ADDRESS] human-pose-estimation.com
Example:
35.240.217.148 human-pose-estimation.com -
Open a web browser and navigate to
human-pose-estimation.com/docsto access the FastAPI app. Now we can test the app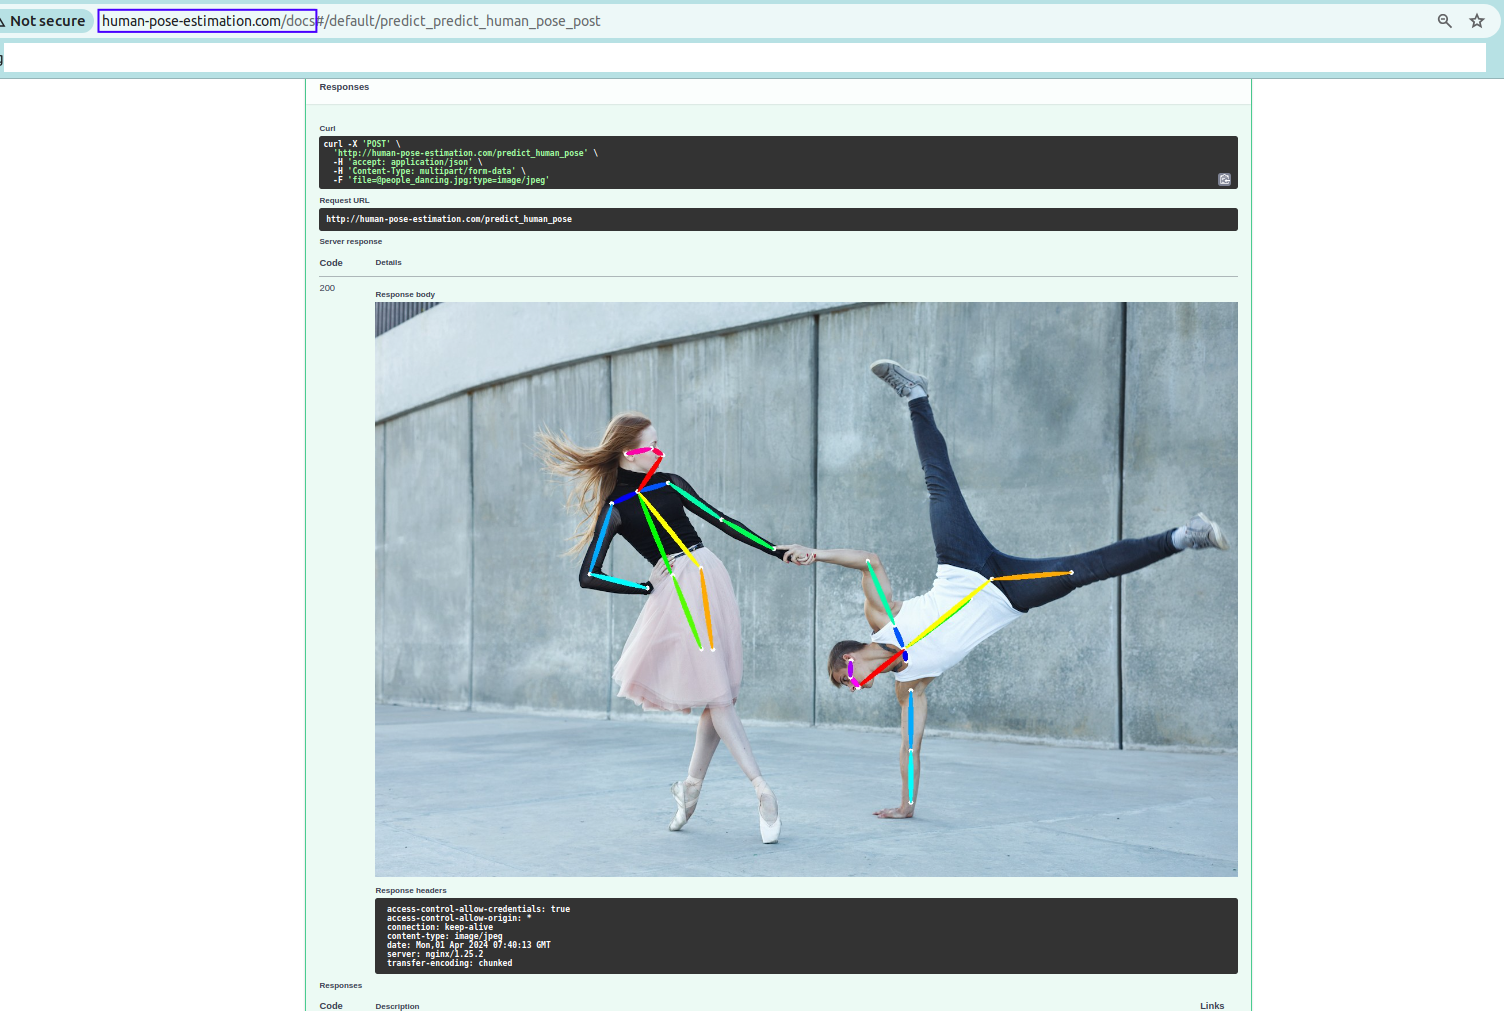

We use kube-prometheus-stack to deploy a monitoring solution for the Kubernetes cluster. This stack, provided by the Prometheus community, includes various components such as Prometheus, Grafana, Alertmanager, and other Prometheus ecosystem tools configured to monitor the health and performance of your cluster's resources.
Run these commands to deploy;
helm repo add prometheus-community https://prometheus-community.github.io/helm-charts
helm repo update
cd helm_charts/prometheus/kube-prometheus-stack
k create ns monitoring
kubens monitoring
helm upgrade --install kube-grafana-prometheus .Add all the services of the IP to /etc/hosts
sudo nano /etc/hosts
[YOUR_INGRESS_IP_ADDRESS] human-pose-estimation.com
[YOUR_INGRESS_IP_ADDRESS] grafana.monitor.com
[YOUR_INGRESS_IP_ADDRESS] prometheus.monitor.com
[YOUR_INGRESS_IP_ADDRESS] alertmanager.monitor.comExample:
35.240.217.148 human-pose-estimation.com
35.240.217.148 grafana.monitor.com
35.240.217.148 prometheus.monitor.com
35.240.217.148 alertmanager.monitor.com
Access the corresponding domain names to reach the service. The default username and password is admin and prom-operator.
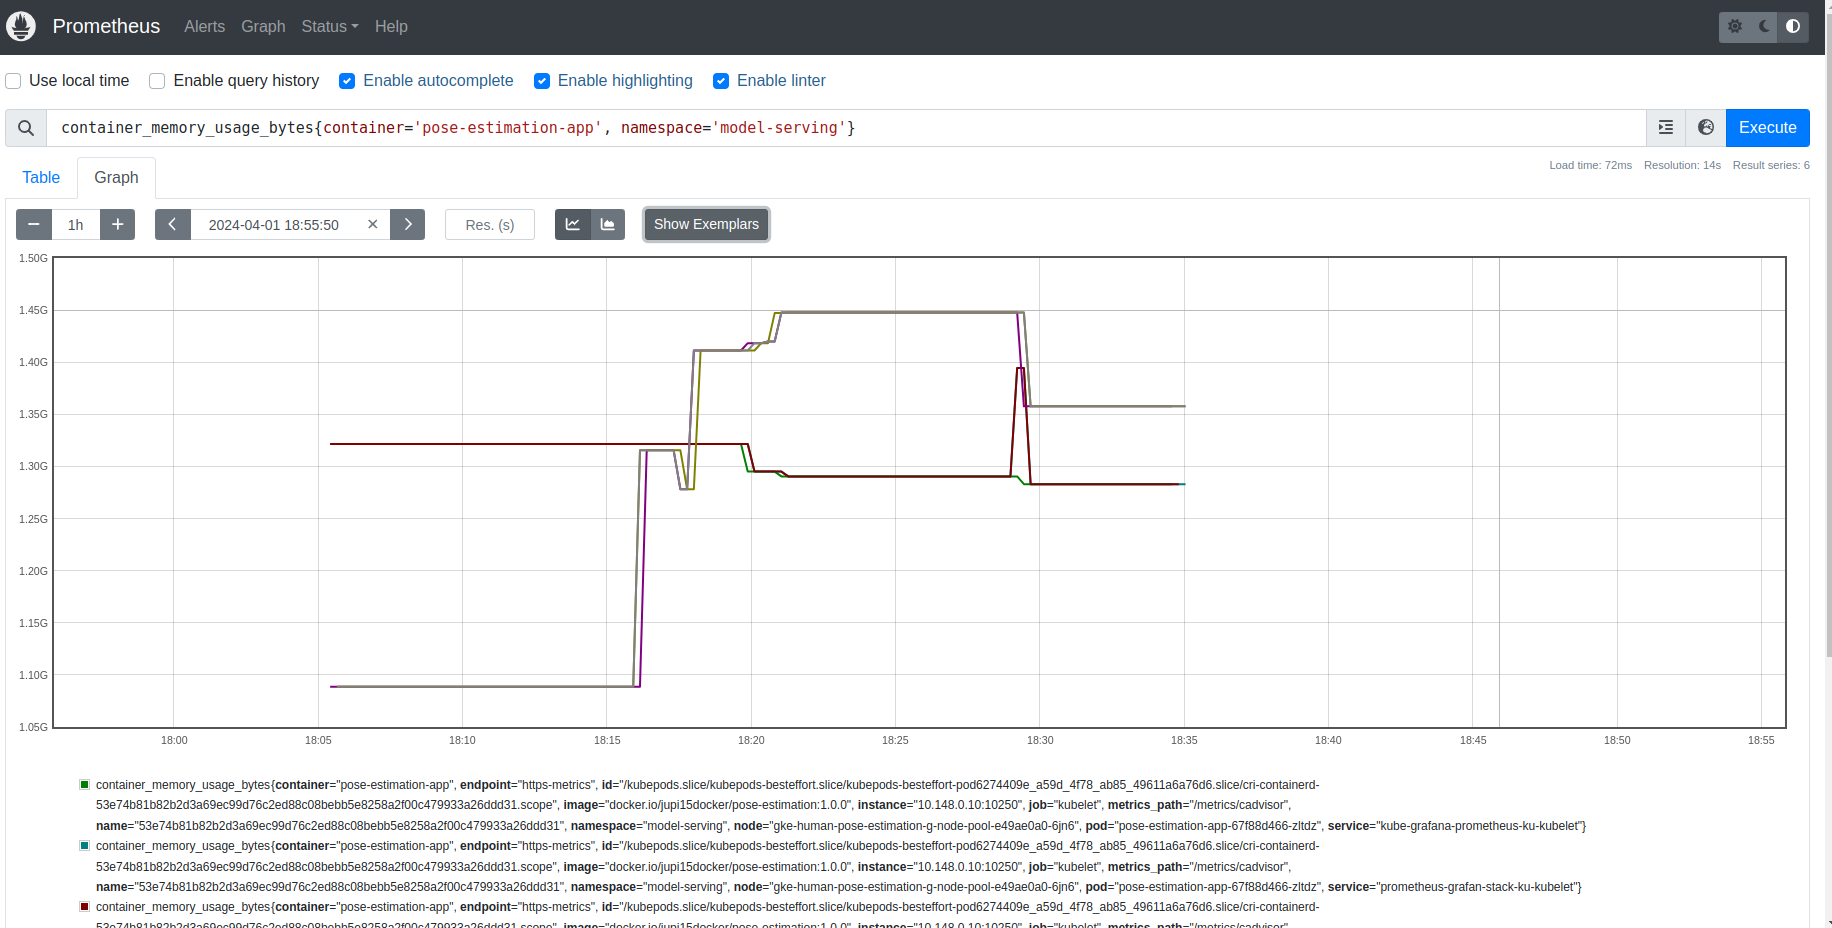
How monitoring works: Prometheus will scape metrics from both nodes and pods within the GKE cluster. Grafana will then visualize this data, presenting metrics such as CPU and RAM usage for system health monitoring. Alerts regarding system health will be forwarded to Slack.
To send alert information to Slack, we need a Slack Webhook URL. You can follow the steps via this link to create one.
Replace your slack api url in production/helm_charts/prometheus/kube-prometheus-stack/values.yaml

Grafana dashboard:

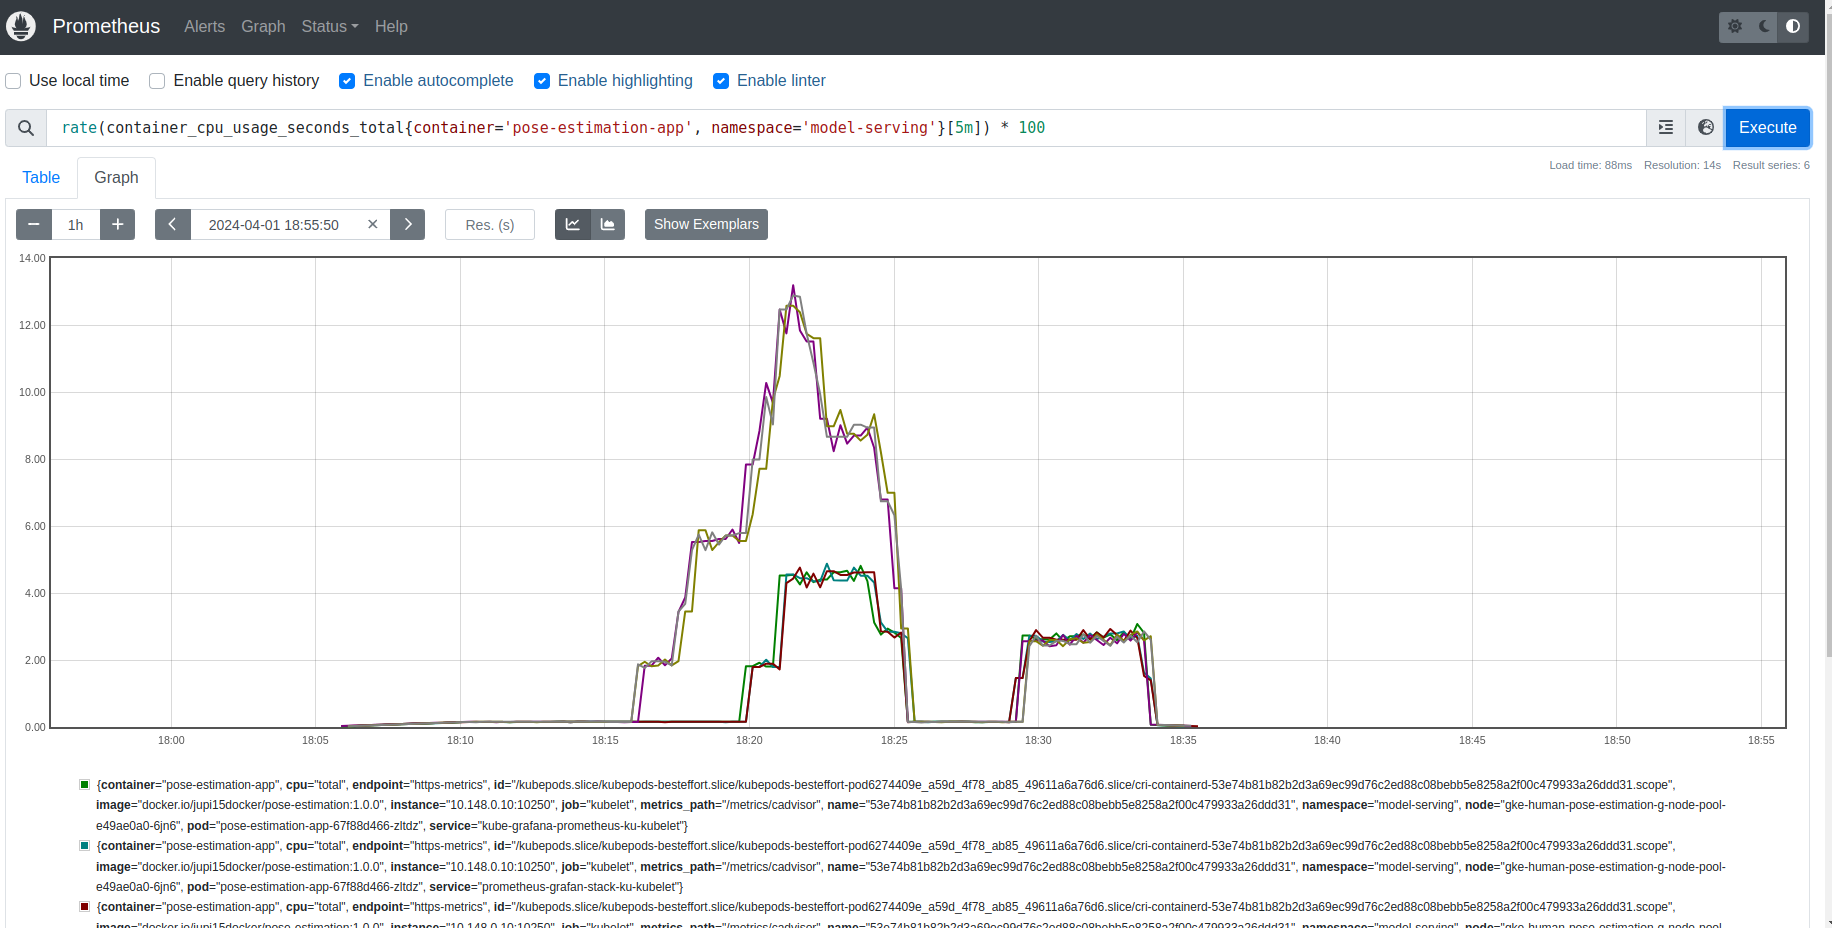
Prometheus dashboard:
-
RAM usage:
-
CPU usage: