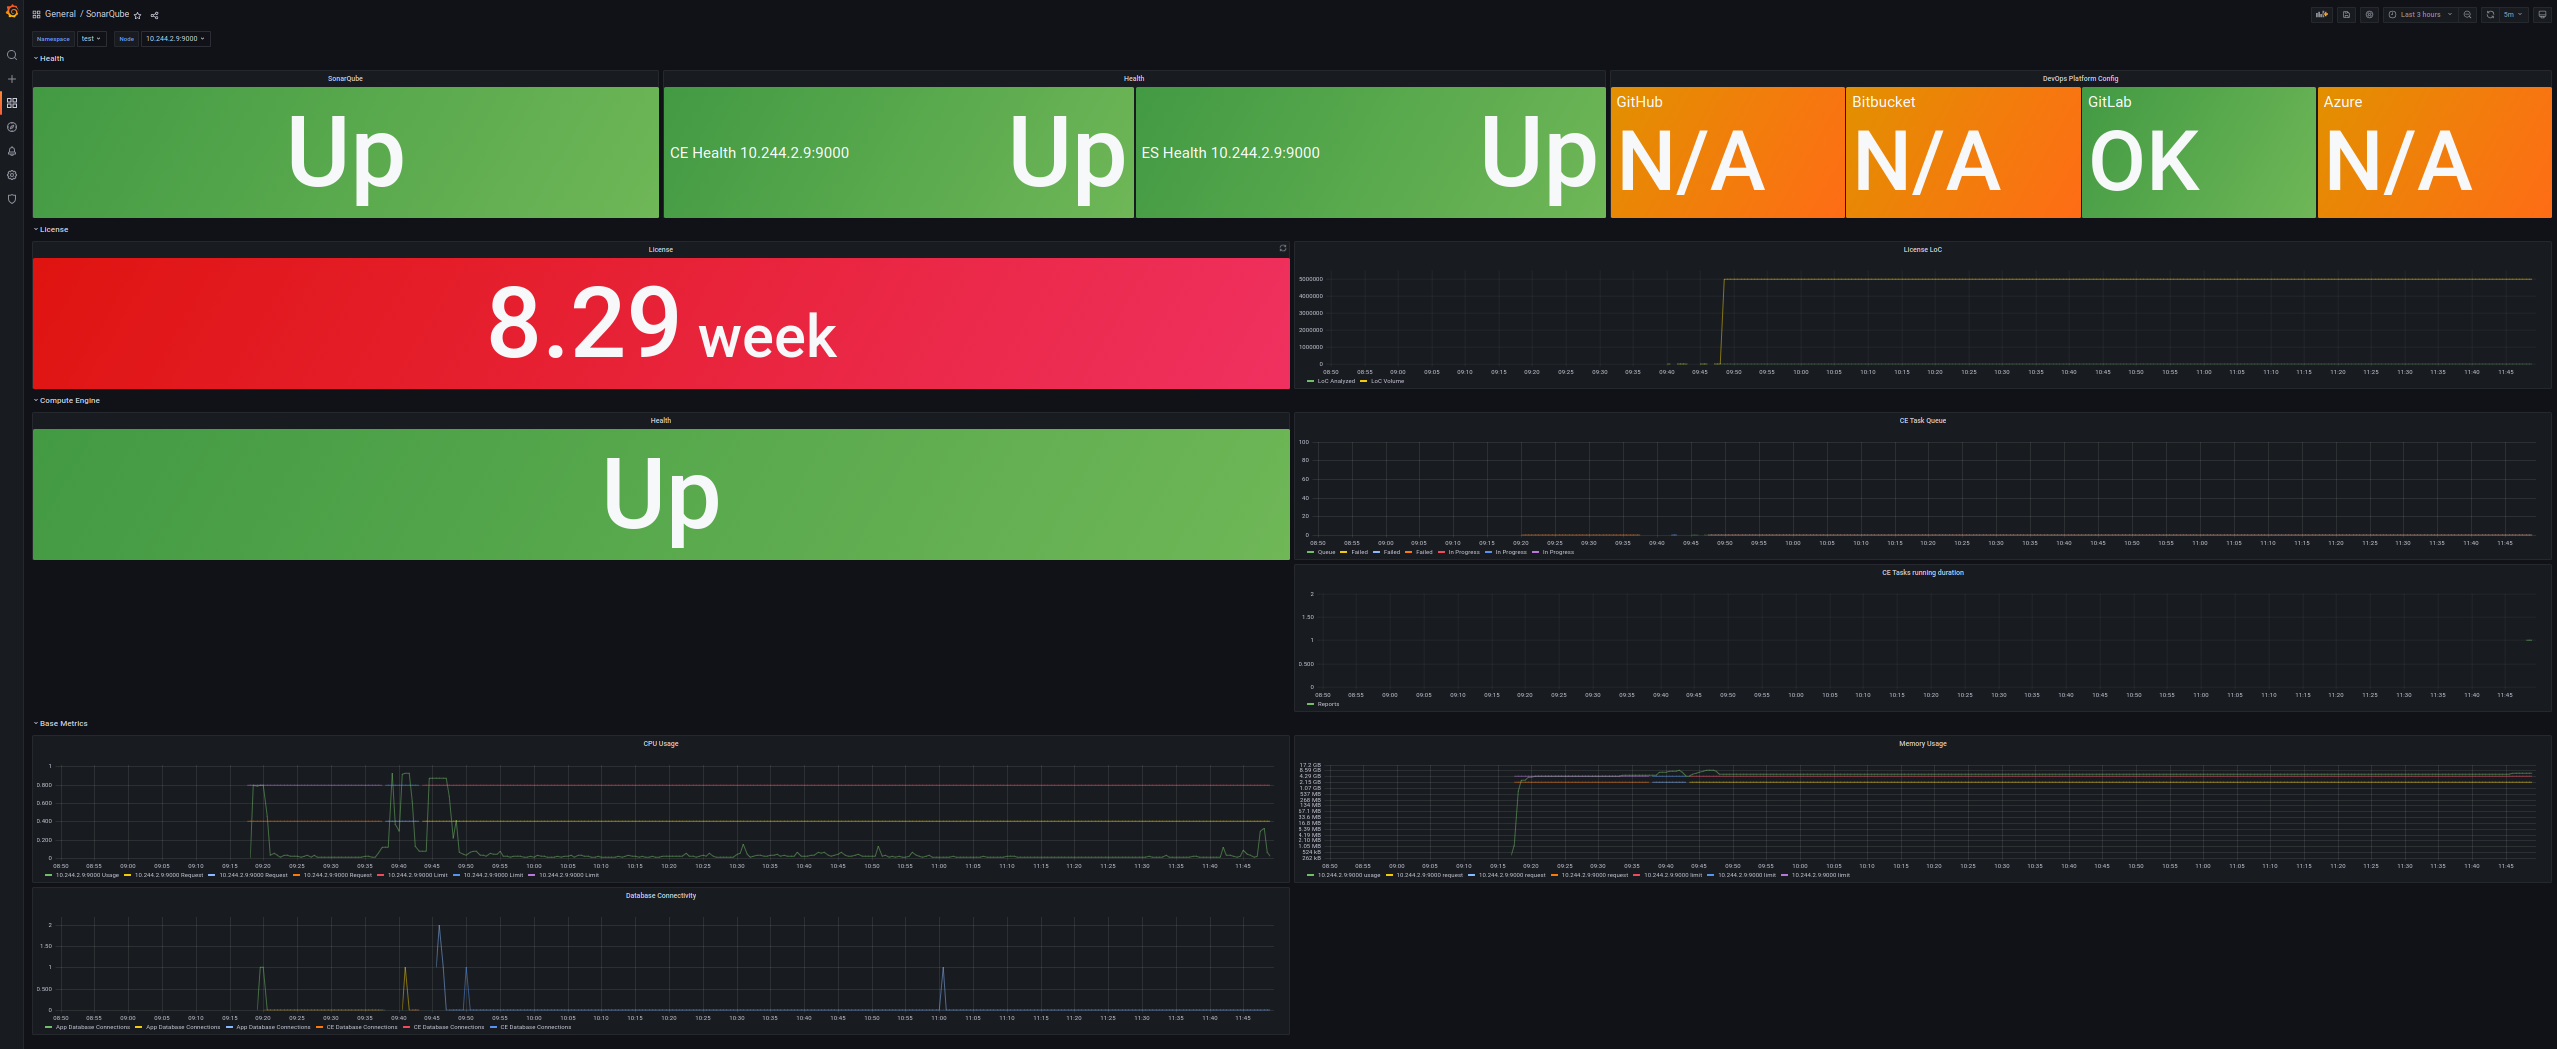
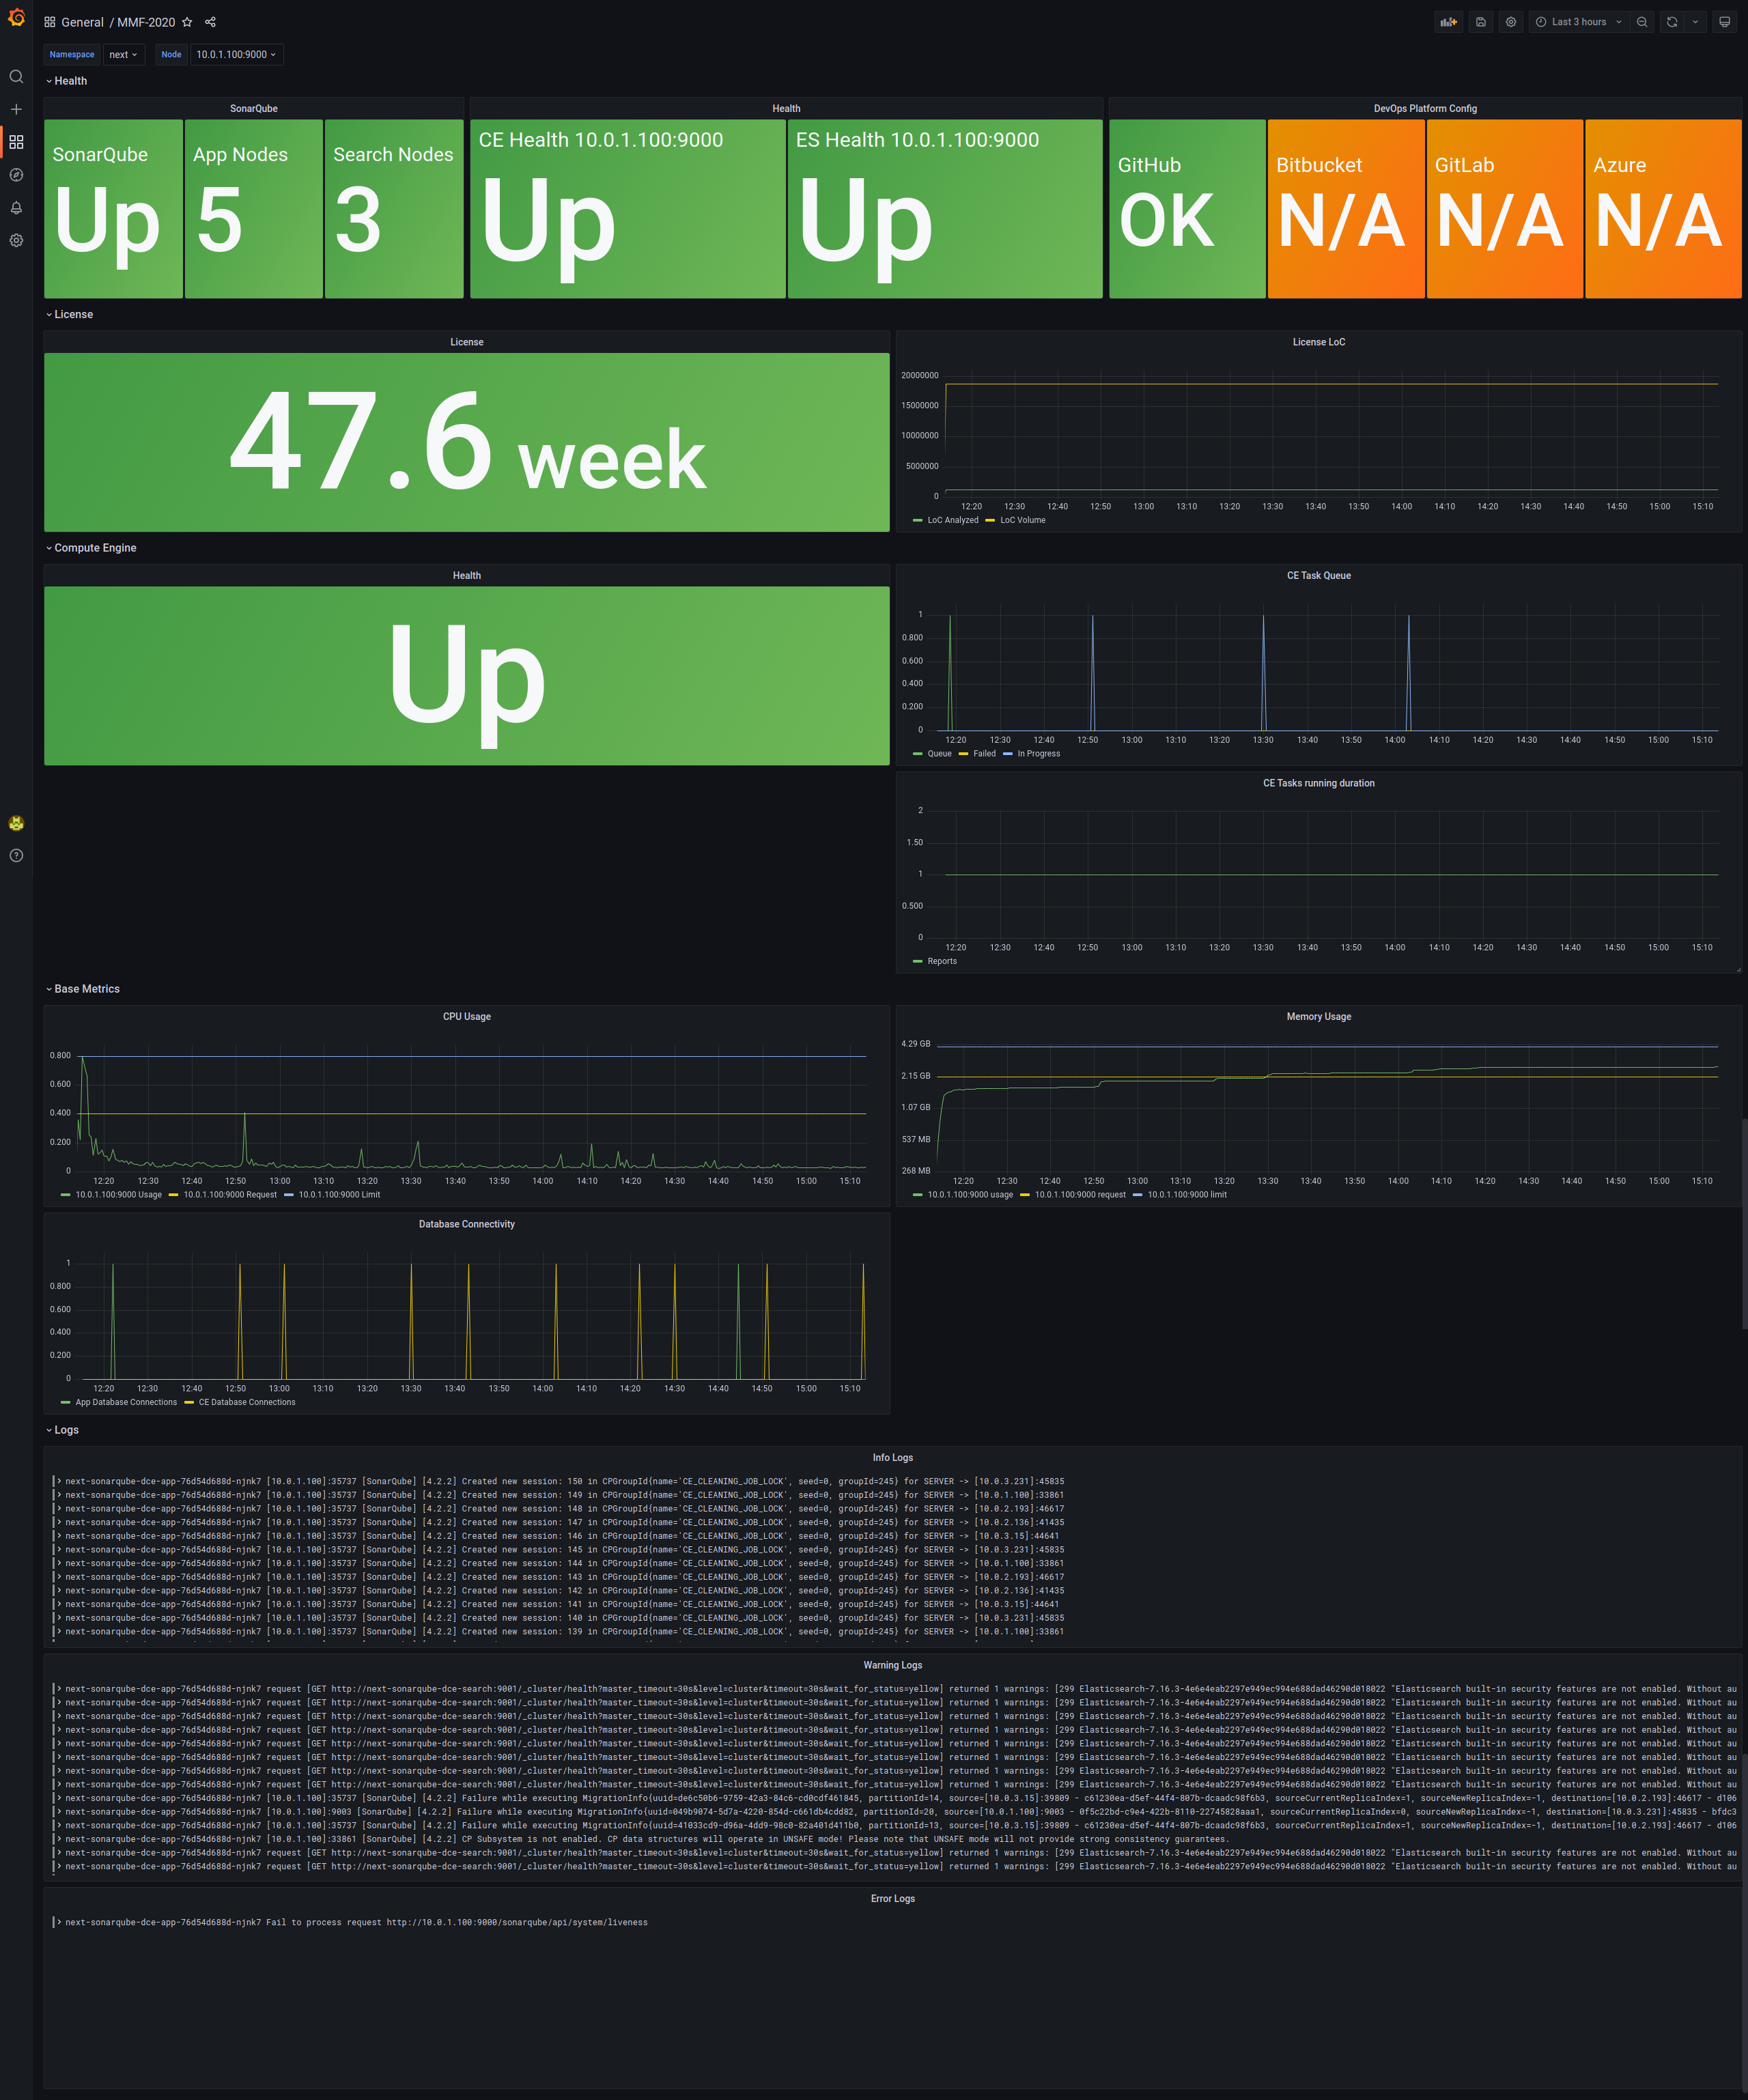
These two dashboards should get you started with monitoring SonarQube with Prometheus.
The first Dashboard focuses only on metrics. While this will already allow to get an overview about what's going on in your instance there is a second dashboard adds Logs to the dashboard if json logging is enabled for SonarQube and Loki is connected to the Grafana instance to access them.
in order to access the metrics on /api/monitoring/metrics you need to provide a bearer token in the same namespace as your prometheus instance. This token should hold the same value as the value for monitoringPasscode.
apiVersion: monitoring.coreos.com/v1
kind: PodMonitor
metadata:
  name: sonarqube
  namespace: monitoring
spec:
  namespaceSelector:
    matchNames:
    - sonarqube
  podMetricsEndpoints:
  - interval: 30s
    path: /
    scheme: http
    targetPort: monitoring-ce
  - interval: 30s
    path: /
    scheme: http
    targetPort: monitoring-web
  - targetPort: "http"
    interval: "30s"
    path: "/api/monitoring/metrics"
    scheme: "http"
    bearerTokenSecret:
      name: "bearer-token"
      key: "token"
  selector:
    matchLabels:
      app: sonarqube
For the Datacenter Edition a dedicated dashboard can be used. The main difference here is the separation in between the Application and Search Nodes to be displayed. The PodMonitor remains the same for all editions.

