NOTE: This package is in active development (beta), updates regularly, and may have bugs. Please report any bugs to the package maintainer.
This package allows for modeling of chaotic systems as intermittently
forced linear systems through the use of Hankel Alternative View of
Koopman (HAVOK) analysis (Brunton, Brunton, Proctor, Kaiser, & Kutz,
2017). This package has additional functionality for the SINDy algorithm
(Brunton, Proctor, & Kutz, 2016), as well as other nonlinear analysis
methods. This package also contains functionality for model optimization
through parallel processing via the phavok() function.
You can install the development version from GitHub with:
# install.packages("devtools")
devtools::install_github("RobertGM111/havok")Simulate data from a Lorenz attractor.
library(havok)
library(deSolve)


#Generate Data
##Set Lorenz Parameters
parameters <- c(s = 10, r = 28, b = 8/3)
n <- 3
state <- c(X=-8, Y=8, Z=27) ##Inital Values

dt<-0.001
tspan<-seq(dt,200,dt)
N<-length(tspan)

Lorenz <- function(t, state, parameters) {
  with(as.list(c(state, parameters)), {
    dX <- s * (Y - X)
    dY <- X * (r - Z) - Y
    dZ <- X * Y - b * Z
    list(c(dX, dY, dZ))
  })
}

out <- ode(y = state, times = tspan, func = Lorenz, parms = parameters, rtol = 1e-12, atol = 1e-12)
xdat <- out[,"X"]
t <- out[,"time"]

# Run HAVOK Analysis
hav <- havok(xdat = xdat, dt = dt)
#> Warning in havok(xdat = xdat, dt = dt): Agument "devMethod" not selected.
#> Defaulting to devMethod = "FOCD"
To plot the resulting time series and forcing term use plot(hav)
plot(hav, what = "both")Load internet trolls data (Full data available at www.fivethirtyeight.com. The original data file for this example contains data from June 19, 2015, to Dec. 31, 2017.
data("Internet_Trolls")Conduct parameter optimization via phavok()
# troll activity extracted 4 times per day during the US presidential  election year 2016 on 11 different topics
right <- results.all.truncated[results.all.truncated$Type=="Right",] # only right-wing trolls
xdat <- right$Topic3  # Russian Twitter troll posting activity on the topic of Racial Justice/Black Lives Matter
dt <- 0.25   # 4 measurements per day

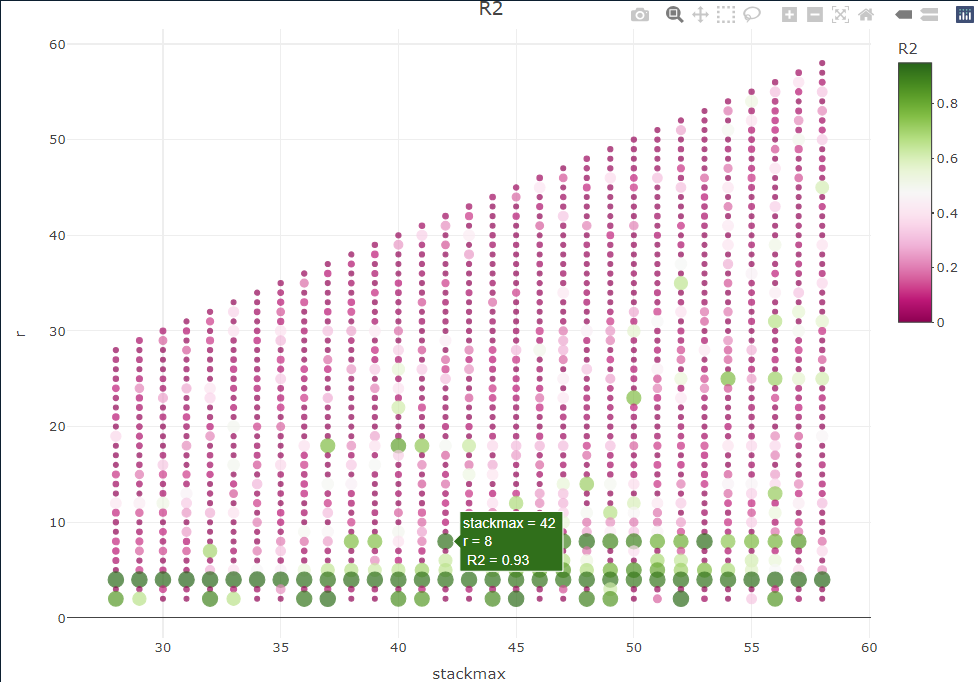
# All possible rs within specified stackmax range, no sparsification dimension

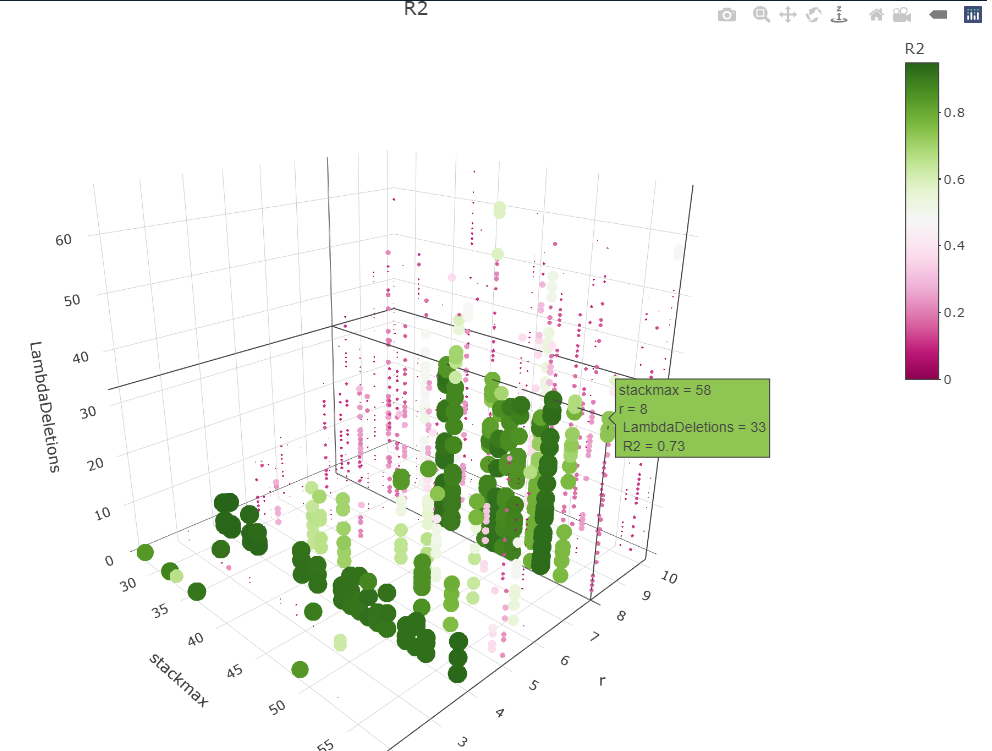
results <- phavok(xdat = xdat, dt = dt, stackmaxes = 28:58)phav <- phavok(xdat = xdat, dt = dt, stackmaxes = 28:58, rs = 2:10, random = 0.5, sparsify = T, sparserandom = 0.4)-
Brunton, S. L., Brunton, B. W., Proctor, J. L., Kaiser, E., & Kutz, J. N. (2017). Chaos as an intermittently forced linear system. Nature communications, 8(1), 19.
-
Brunton, S. L., Proctor, J. L., & Kutz, J. N. (2016). Discovering governing equations from data by sparse identification of nonlinear dynamical systems. Proceedings of the National Academy of Sciences, 113(15), 3932-3937.
-
Moulder, R. G., Martynova, E., & Boker, S. M. (2021). Extracting nonlinear dynamics from psychological and behavioral time series through HAVOK analysis. Multivariate Behavioral Research, 1-25.


