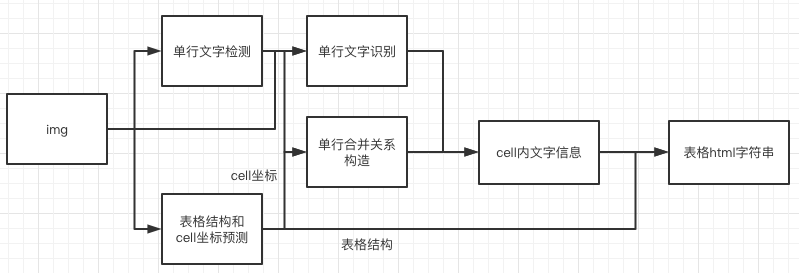
The ocr of the table mainly contains three models
- Single line text detection-DB
- Single line text recognition-CRNN
- Table structure and cell coordinate prediction-RARE
The table ocr flow chart is as follows
- The coordinates of single-line text is detected by DB model, and then sends it to the recognition model to get the recognition result.
- The table structure and cell coordinates is predicted by RARE model.
- The recognition result of the cell is combined by the coordinates, recognition result of the single line and the coordinates of the cell.
- The cell recognition result and the table structure together construct the html string of the table.
TBD
First cd to the PaddleOCR/ppstructure directory
The table uses TEDS (Tree-Edit-Distance-based Similarity) as the evaluation metric of the model. Before the model evaluation, the three models in the pipeline need to be exported as inference models (we have provided them), and the gt for evaluation needs to be prepared. Examples of gt are as follows:
{"PMC4289340_004_00.png": [["<html>", "<body>", "<table>", "<thead>", "<tr>", "<td>", "</td>", "<td>", "</td>", "<td>", "</td>", "</tr>", "</thead>", "<tbody>", "<tr>", "<td>", "</td>", "<td>", "</td>", "<td>", "</td>", "</tr>", "</tbody>", "</table>", "</body>", "</html>"], [[1, 4, 29, 13], [137, 4, 161, 13], [215, 4, 236, 13], [1, 17, 30, 27], [137, 17, 147, 27], [215, 17, 225, 27]], [["<b>", "F", "e", "a", "t", "u", "r", "e", "</b>"], ["<b>", "G", "b", "3", " ", "+", "</b>"], ["<b>", "G", "b", "3", " ", "-", "</b>"], ["<b>", "P", "a", "t", "i", "e", "n", "t", "s", "</b>"], ["6", "2"], ["4", "5"]]]}In gt json, the key is the image name, the value is the corresponding gt, and gt is a list composed of four items, and each item is
- HTML string list of table structure
- The coordinates of each cell (not including the empty text in the cell)
- The text information in each cell (not including the empty text in the cell)
- The text information in each cell (including the empty text in the cell)
Use the following command to evaluate. After the evaluation is completed, the teds indicator will be output.
python3 table/eval_table.py --det_model_dir=path/to/det_model_dir --rec_model_dir=path/to/rec_model_dir --structure_model_dir=path/to/structure_model_dir --image_dir=../doc/table/1.png --rec_char_dict_path=../ppocr/utils/dict/table_dict.txt --structure_char_dict_path=../ppocr/utils/dict/table_structure_dict.txt --rec_char_type=EN --det_limit_side_len=736 --det_limit_type=min --gt_path=path/to/gt.jsonFirst cd to the PaddleOCR/ppstructure directory
python3 table/predict_table.py --det_model_dir=path/to/det_model_dir --rec_model_dir=path/to/rec_model_dir --structure_model_dir=path/to/structure_model_dir --image_dir=../doc/table/1.png --rec_char_dict_path=../ppocr/utils/dict/table_dict.txt --structure_char_dict_path=../ppocr/utils/dict/table_structure_dict.txt --rec_char_type=EN --det_limit_side_len=736 --det_limit_type=min --output ../output/tableAfter running, the excel sheet of each picture will be saved in the directory specified by the table_output field
