Realizing ISBI Challenge medical image cell segmentation task based on OneFlow and U-NET.
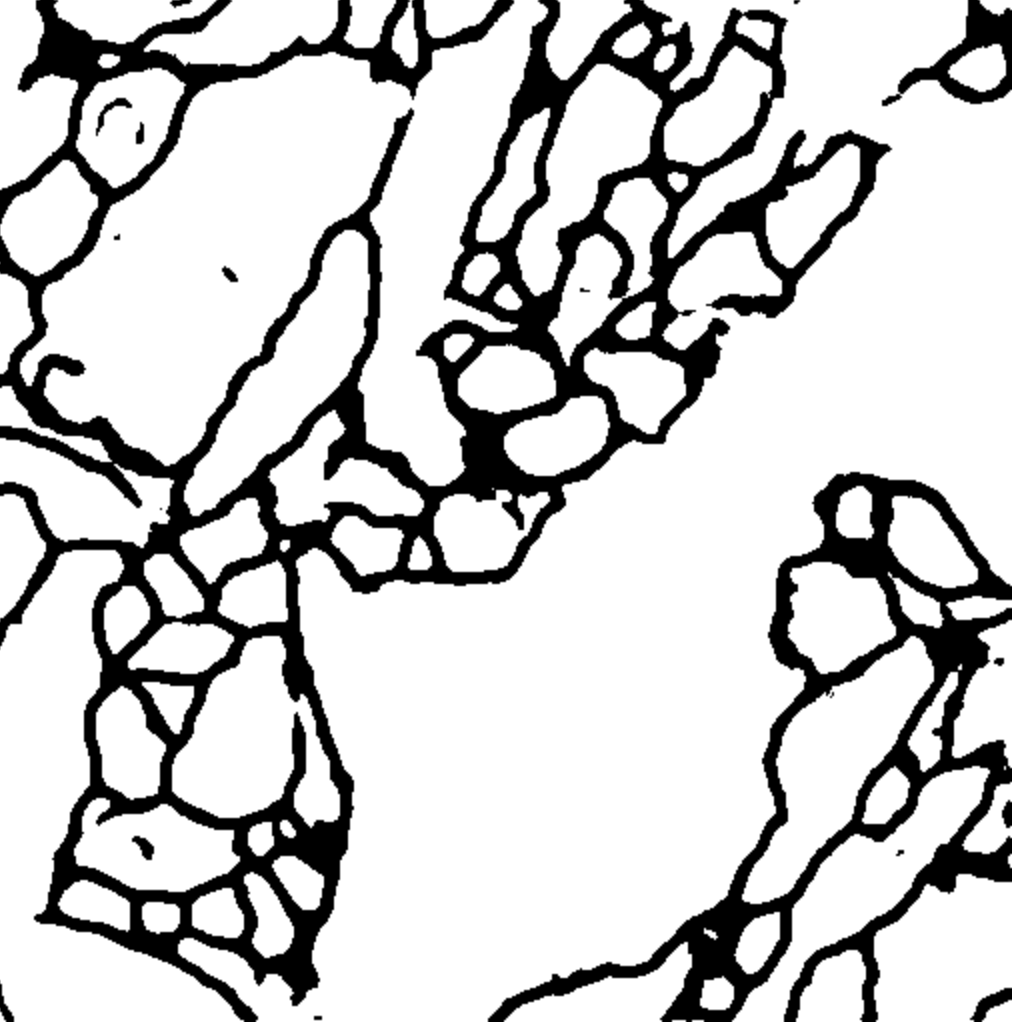
Take a look at the following GIF to get an idea of what the task is: Given a cell structure diagram, we are going to divide it up from each other.

The training data consisted of 30 images with a resolution of 512x512. These images were electron microscopic images of drosophila.
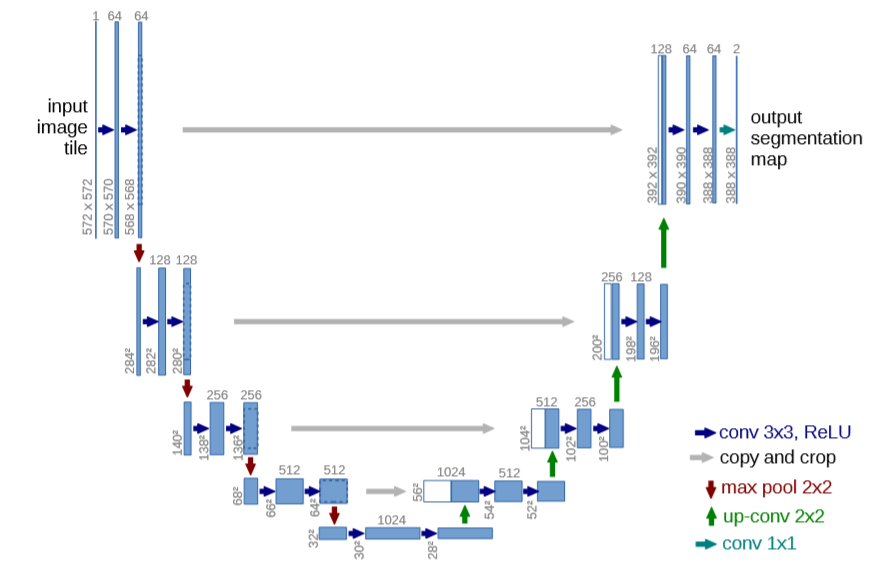
The network architecture is shown in the following figure. It consists of a shrink path (left) and an expand path (right). The contraction path follows the typical architecture of convolutional networks. It involves the repeated use of two 3x3 convolution (no fill convolution), each convolution followed by a linear correction unit (ReLU) and a 2x2 maximum pooling operation with a downsample of step 2. In each downsampling step, we double the number of feature channels. Each step in the extended path involves up-sampling of the feature map, followed by a 2x2 convolution (" up-convolution ") that halves the number of feature channels, concatenated with the corresponding trimmed feature map from the contracted path, followed by two 3x3 convolutions, each followed by ReLU. Since boundary pixels are lost at each convolution, clipping is necessary. At the last layer, each 64-component feature vector is mapped to the desired number of categories using 1x1 convolution. There are 23 convolutional layers in the network.
Raw data: Prepare the data first, with reference data from the ISBI challenge dataset. The data can be downloaded from this warehouse, including 30 training charts and 30 corresponding labels. 30 test images.
The enhanced data: Google cloud disk(https://drive.google.com/drive/folders/0BzWLLyI3R0pLclMzMzRxUm1qZmc)
Choose one of the above.
Download pretrained model from the following link: https://oneflow-static.oss-cn-beijing.aliyuncs.com/Dataset/Seg/ISBI_Challenge_cell_segmentation/checkpoints.tar.gz
dataloader.py  Load the data
plot.py  Draw loss curve
test_image  Test Dataset
TrainUnetDataSet.py  Training documents
predict_image  Test result
unet.py  The network structure
predict_unet_test.py  Test documents
train_image	 Train Dataset
train_label GroundTruthLoading data(not must):
python3 dataloader.py Train:
bash train.shTest:
bash test.shOnly 40 epochs were trained in this experiment, and increasing the number of epochs could significantly improve the model accuracy.
The original:

Predict result:
Code for drawing Loss curve in this project:
import os
import sys

class Logger():
    def __init__(self, filename='log.txt'):
        self.terminal = sys.stdout
        self.log = open(filename, 'w')

    def write(self,message):
        #self.terminal.write(message)
        self.log.write(message)

    def flush(self):
        pass
    def close(self):
        self.log.close()