

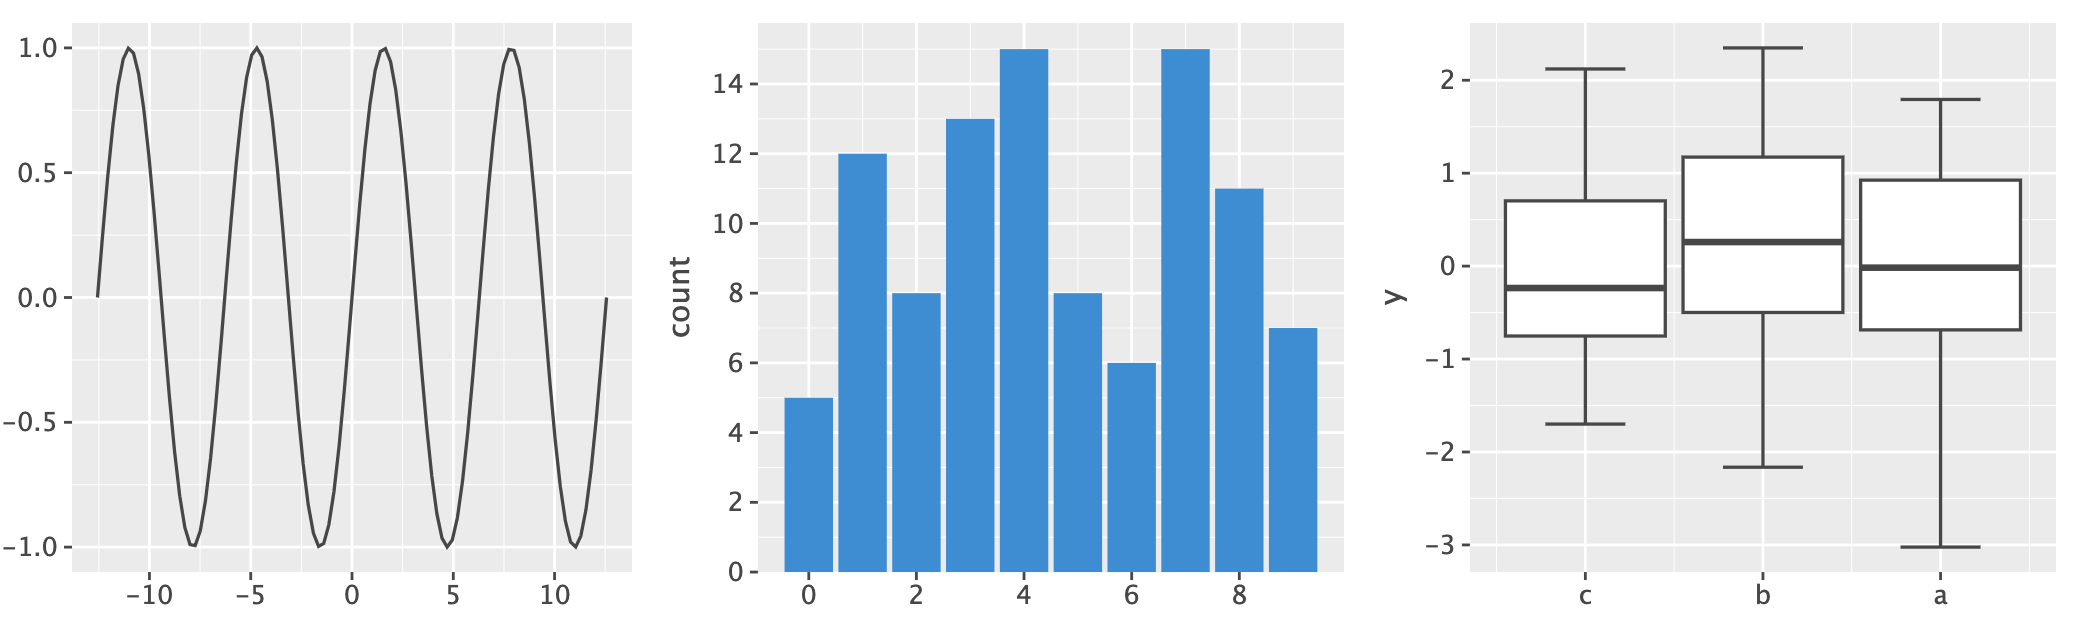
Lets-Plot is a multiplatform plotting library based on the Grammar of Graphics.
The library' design is heavily influenced by Leland Wilkinson work The Grammar of Graphics describing the deep features that underlie all statistical graphics.
This grammar [...] is made up of a set of independent components that can be composed in many different ways. This makes [it] very powerful because you are not limited to a set of pre-specified graphics, but you can create new graphics that are precisely tailored for your problem.
- Hadley Wickham, "ggplot2: Elegant Graphics for Data Analysis"
We provide ggplot2-like plotting API for Python and Kotlin users.
A bridge between R (ggplot2) and Python data visualization.
To learn more see the documentation site at lets-plot.org.

Create plots in Kotlin Notebook,
Datalore, Jupyter with Kotlin Kernel
or any other notebook that supports Kotlin Kernel.
To learn more see the Lets-Plot Kotlin API project at GitHub.
Embed Lets-Plot charts in Compose Multiplatform applications.
To learn more see the Lets-Plot Skia Frontend project at GitHub.
Embed Lets-Plot charts in JVM (Swing, JavaFX) and Kotlin/JS applications. \ To learn more see the Lets-Plot Kotlin API project at GitHub.


Scientific mode in PyCharm and in IntelliJ IDEA provides support for interactive scientific computing and data visualization.
Lets-Plot in SciView plugin adds support for interactive plotting to IntelliJ-based IDEs with the Scientific mode enabled.
Note: The Scientific mode is NOT available in communinty editions of JetBrains IDEs.
Also read:
The major version was bumped to 4 due to a major package refactoring that the project has undergone.
This refactoring doesn't affect the Python API, however, as a result of package names changed,
Lets-Plot v4.0.0 is partially incompatible with Lets-Plot Kotlin API versions 4.4.1 and earlier.
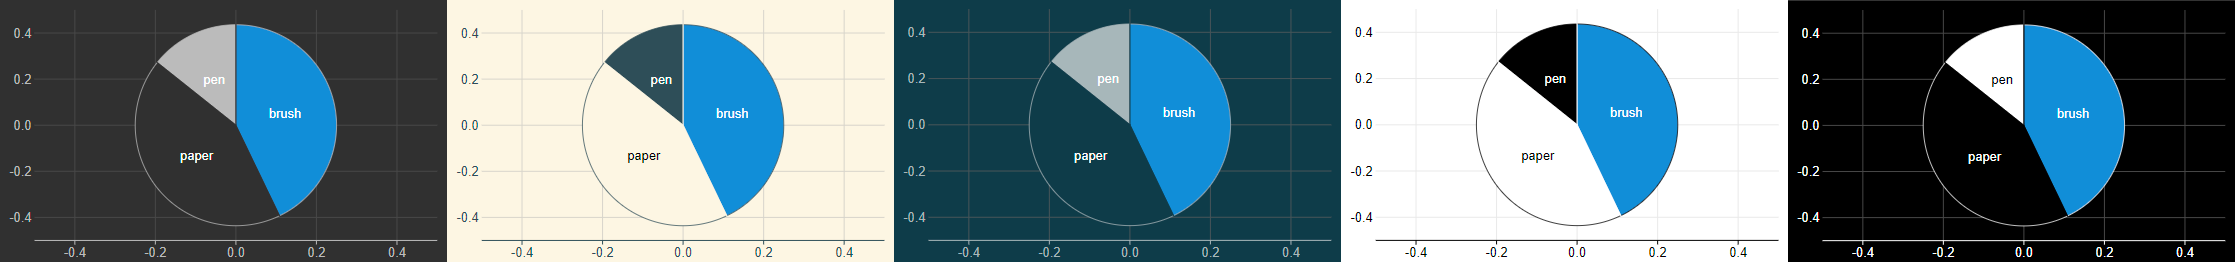
- The default qualitative color palette is now Color Brewer "Set1" (was "Set2").
- Slightly bigger default size of points and width of lines.
- Flavor-aware default colors for points, lines etc.
See: example notebook.
- Size of points is slightly adjusted to match the width of a line of the same "size".
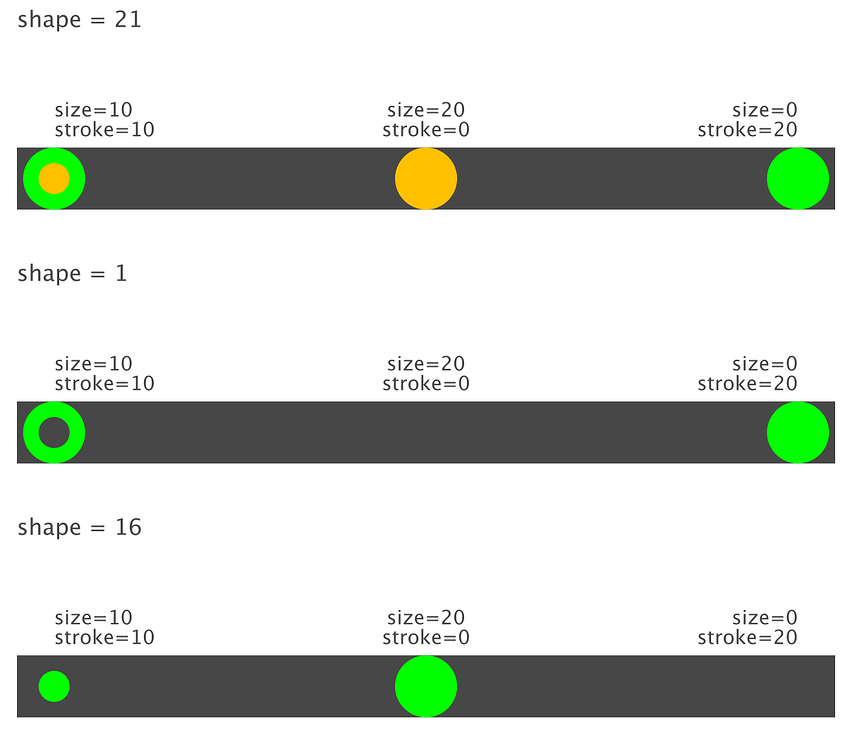
See: example notebook.
A way to specify size of the pie in units relative to the plot size.
See: example notebook.
See: example notebook.
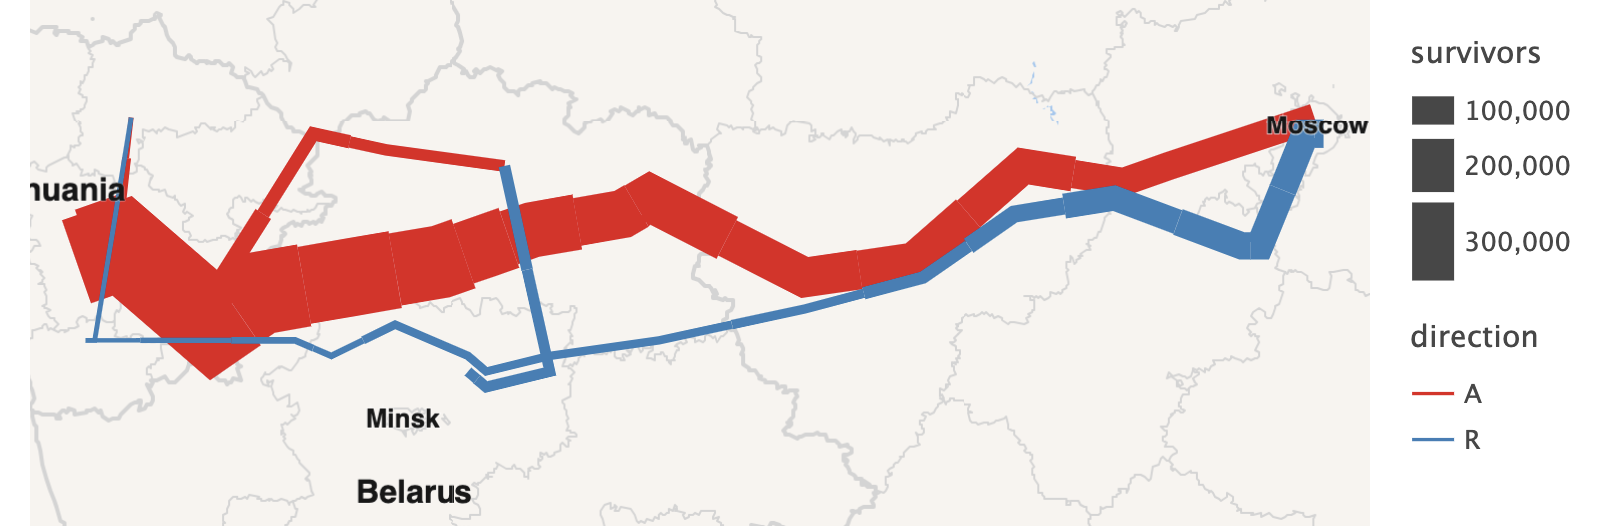
theme_void(): example.geom_function(): example.stat_ecdf(): example.stat_summary(): example.stat_summary_bin(): example."sum"statistic: example."boxplot_outlier"statistic: example.
See CHANGELOG.md for other changes and fixes.
This project and the corresponding community are governed by the JetBrains Open Source and Community Code of Conduct. Please make sure you read it.
Code and documentation released under the MIT license. Copyright © 2019-2023, JetBrains s.r.o.