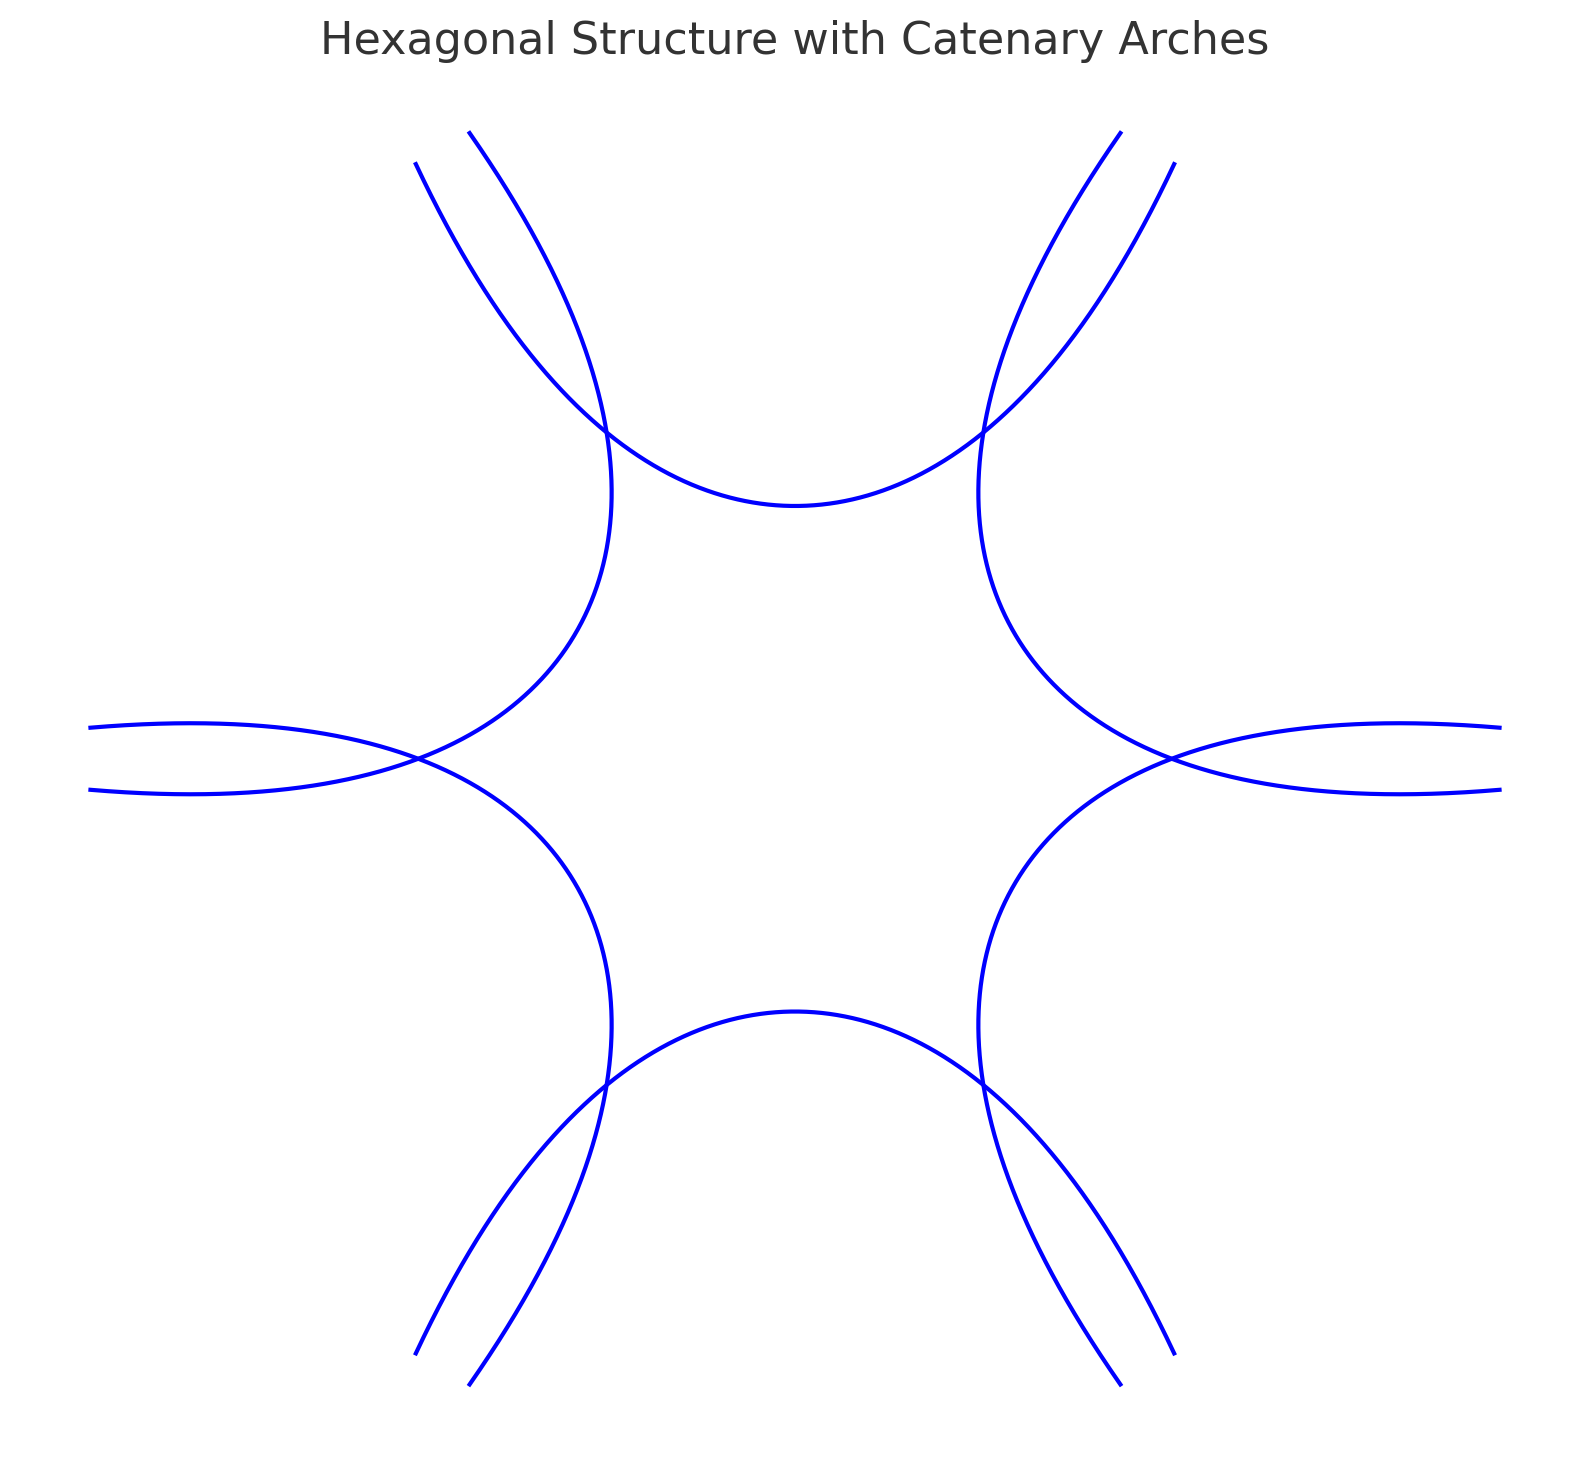
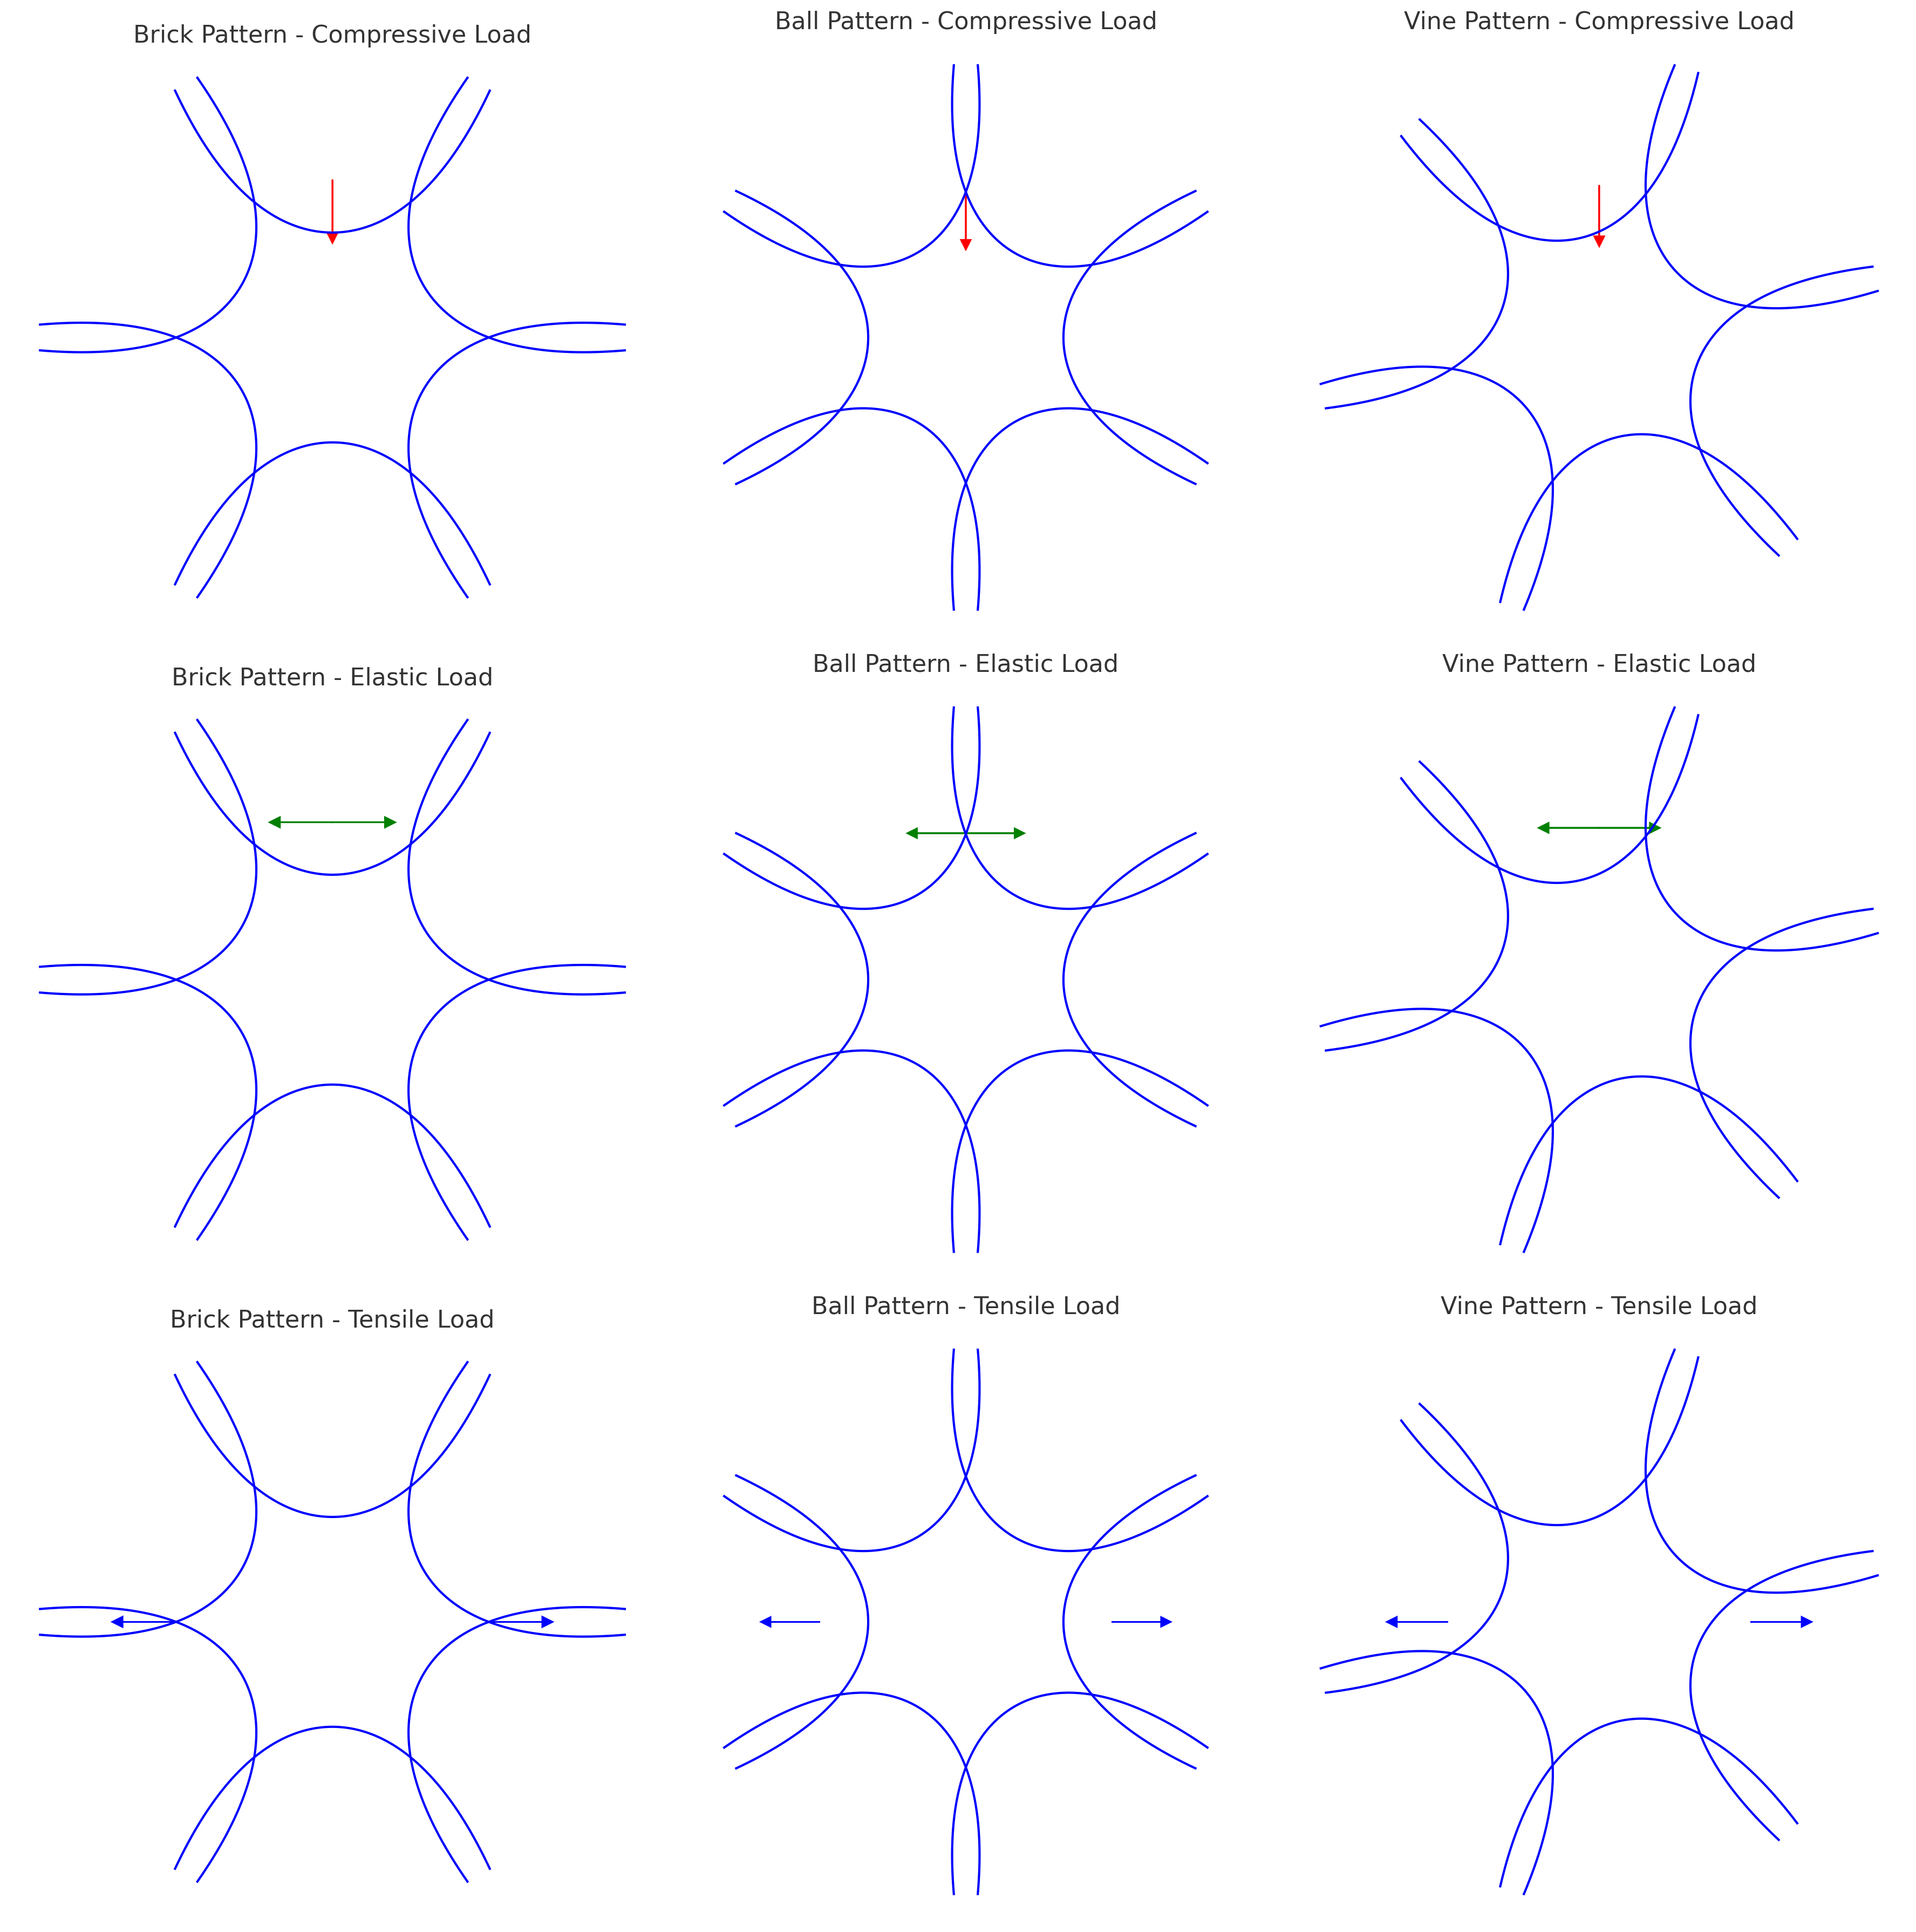
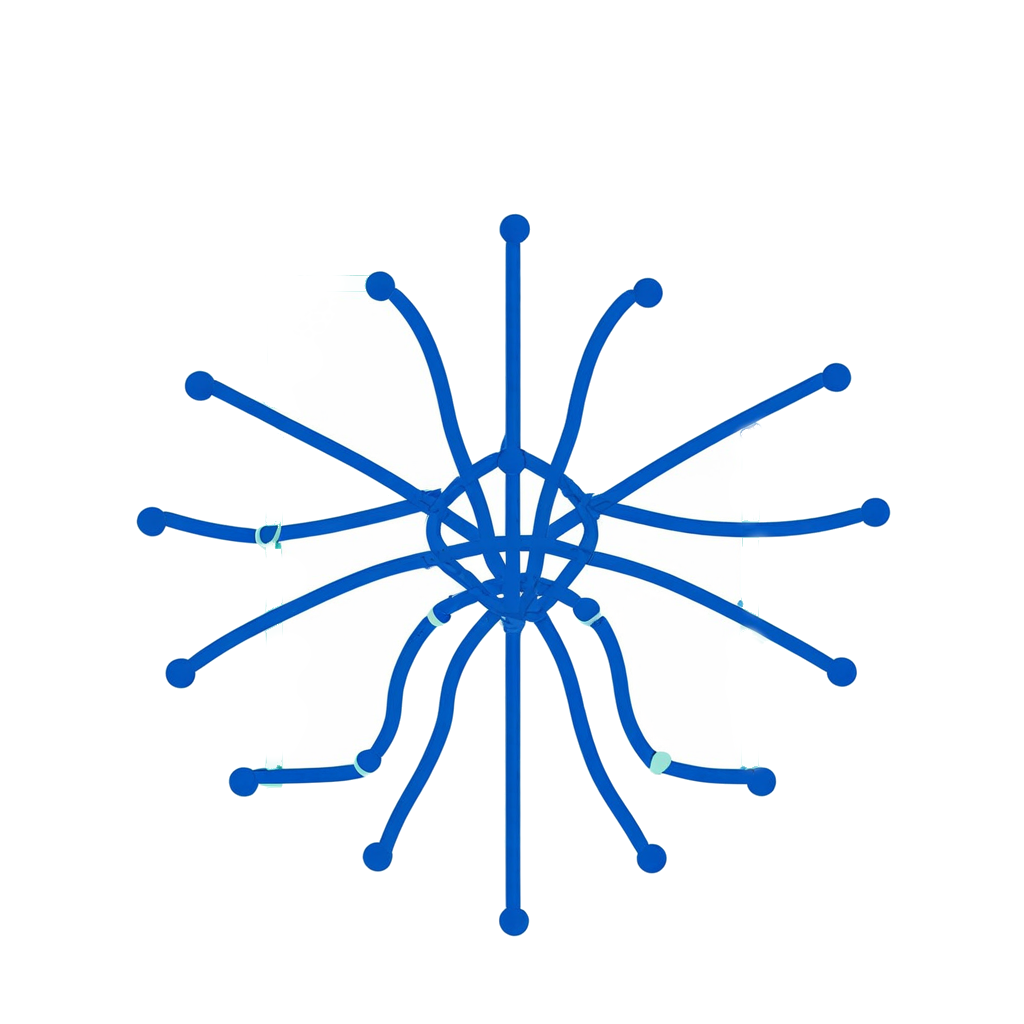
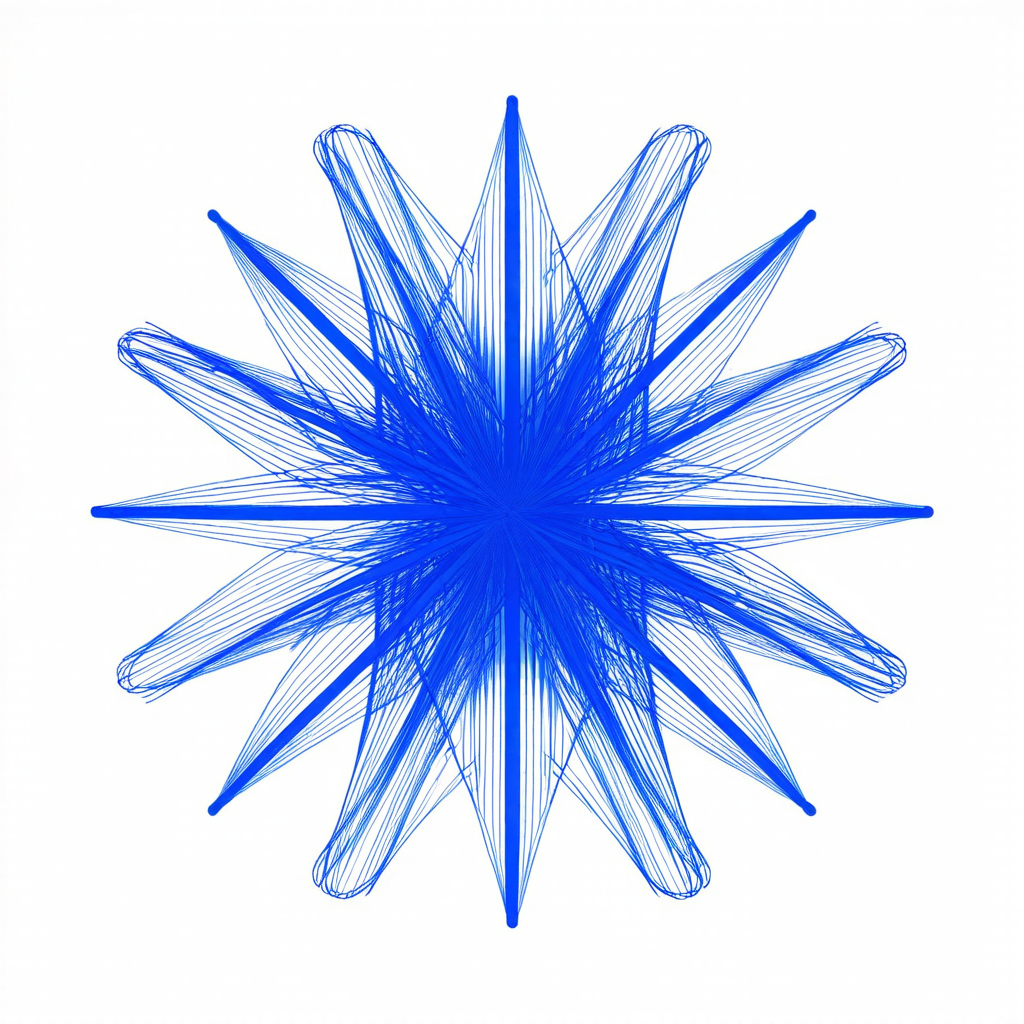
Just an assortment of shape and lattic generators made from Catenary Curves.
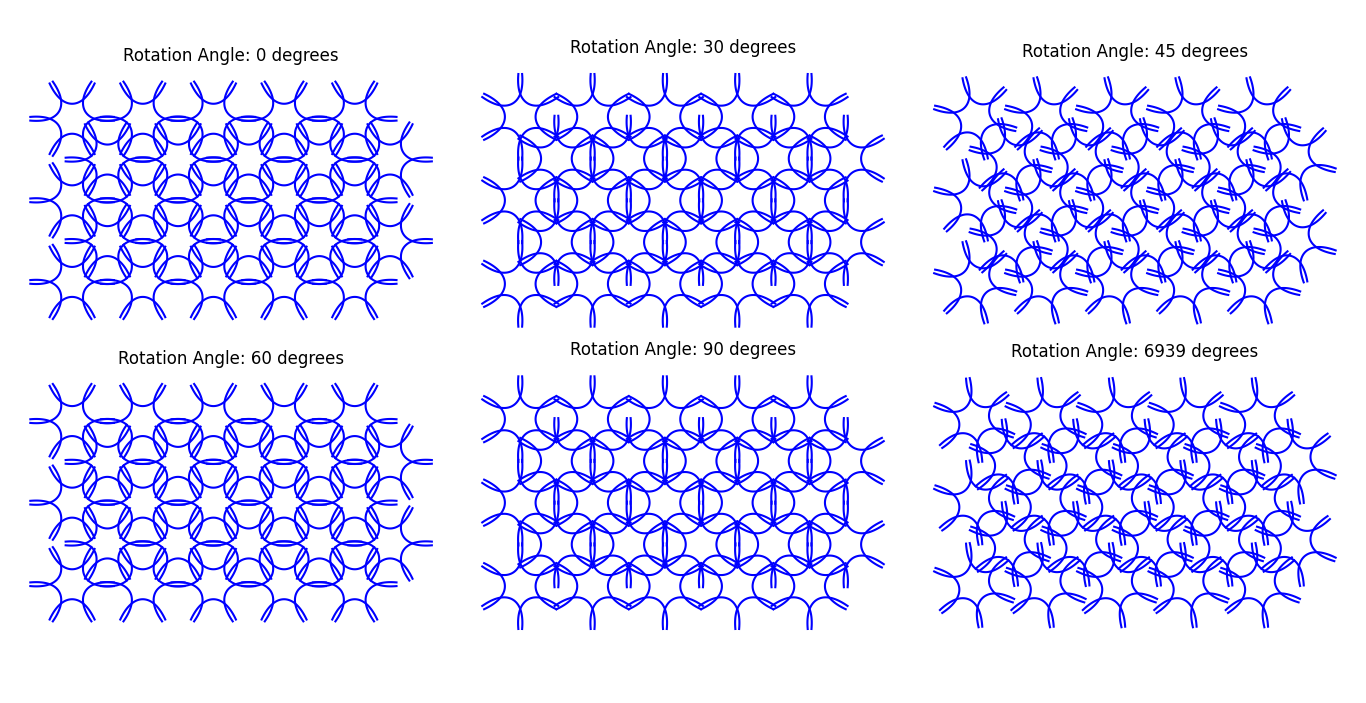
Sample code:
import numpy as np import matplotlib.pyplot as plt from ipywidgets import interact, FloatSlider, IntSlider
def catenary_2d(x, a): return a * np.cosh(x / a)
…
interact( plot_grid_of_rotated_hexagons, rotation_angle=FloatSlider(min=0, max=2*np.pi, step=0.1, value=0, description='Rotation Angle'), spacing=FloatSlider(min=0.5, max=5, step=0.1, value=np.pi, description='Spacing'), grid_size=IntSlider(min=1, max=5, step=1, value=2, description='Grid Size') );

