201 add visualizations using arviz to tutorials #211
Conversation
Codecov ReportAll modified and coverable lines are covered by tests ✅
Additional details and impacted files@@ Coverage Diff @@
## main #211 +/- ##
=======================================
Coverage 92.47% 92.47%
=======================================
Files 40 40
Lines 877 877
=======================================
Hits 811 811
Misses 66 66
Flags with carried forward coverage won't be shown. Click here to find out more. ☔ View full report in Codecov by Sentry. |
|
Thanks, @sbidari! One quick fix to start. The website build in CI is failing: ---------------------------------------------------------------------------
ModuleNotFoundError Traceback (most recent call last)
Cell In[8], line 1
----> 1 import arviz as az
2 idata = az.from_numpyro(model1.mcmc)
3 az.plot_trace(idata.posterior["Rt"],compact=True);
ModuleNotFoundError: No module named 'arviz'Adding poetry add -C docs arvizmultisignal-epi-inference/docs/pyproject.toml Lines 9 to 19 in 99cdf42 |
|
My mistake; I should've looked more closely at the source poetry add -C model --group dev arvizCan remove it from the poetry remove -C docs arviz |
This command is not changing any dependencies in the model
|

|
what's the output of |
…s-using-arviz-to-tutorials
|
My bad, the command did work as expected. |
There was a problem hiding this comment.
Nice!
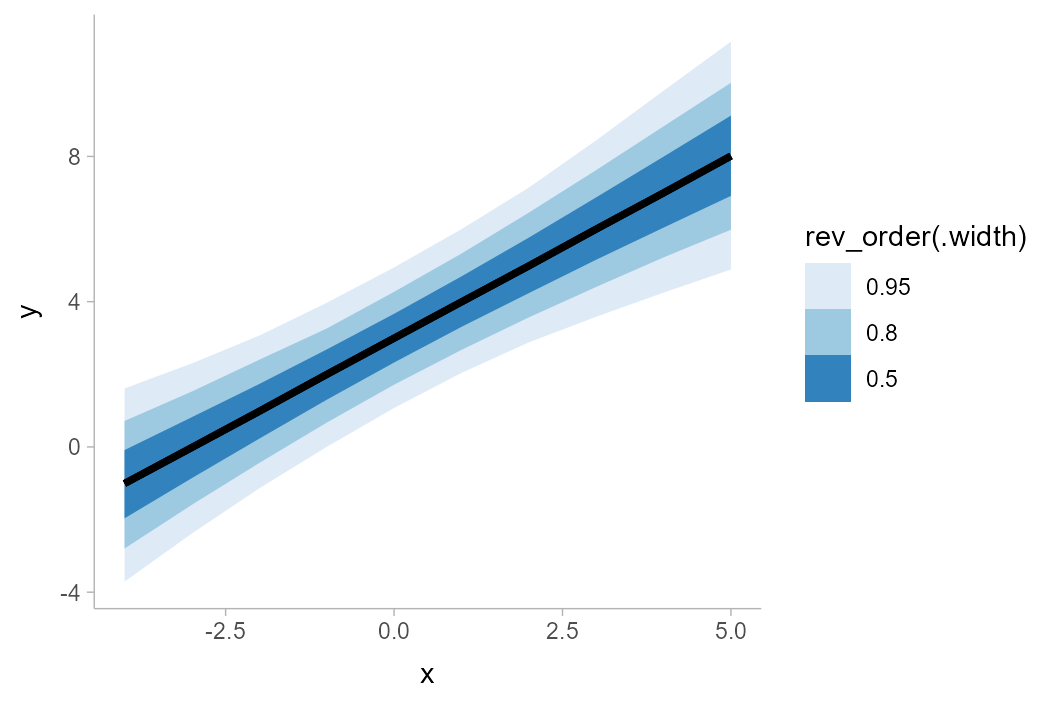
Can we try to make something with plot_hdi? Or at a minimum swap the x and y axes in these plots so they are more readable as a time series?
My aspiration for these types of plots is to look like the lineribbon plots from ggdist.
Co-authored-by: Dylan H. Morris <[email protected]>
Yep! Working on it |
|
I created hdi plots that are more readable to replace the forest plots. Let me know what you think and if there are any other type of plots you'd like to be added @damonbayer |
There was a problem hiding this comment.
hdi plots look great! Nice!
Two requests:
- I don't think it makes sense to plot all of the Rt traces on top of each other because you cannot tell them apart or tell if any of them are problematic. Consider just plotting a single variable.
- Please also revisit the axis labels and titles of figures. Make sure each figure has axis labels and use words like "posterior distribution" and "credible interval" to accurately indicate what is shown in the figures.
|
This is looking great, @sbidari! Quarto and rst format are picky. I noticed sometimes figures wouldn't render or be added to the website if some conditions were unmet:
You have to:
In your case, the code chunk labelled |

|
Thanks for catching this @gvegayon |
Co-authored-by: Damon Bayer <[email protected]>
Co-authored-by: Damon Bayer <[email protected]>
|
ready for review @damonbayer |
Added arviz plots to two tutorials