
changed
CHANGELOG.md
|
|
@@ -1,3 +1,8 @@
|
|
1
|
+ ## 1.0.1 (2019-04-09)
|
|
2
|
+
|
|
3
|
+ ### Bugfixes (User Facing)
|
|
4
|
+ * When memory measurements were actually different extended statistics was displayed although the option was not provided. Now correctly only displayed if the option is provided and values actually had variance.
|
|
5
|
+
|
|
1
6
|
## 1.0.0 (2019-03-28)
|
|
2
7
|
|
|
3
8
|
It's 0.99.0 without the deprecation warnings. Specifically:
|
changed
README.md
|
|
@@ -59,7 +59,7 @@ map.flatten 781.25 KB - 1.25x memory usage +156.28 KB
|
|
59
59
|
**All measurements for memory usage were the same**
|
|
60
60
|
```
|
|
61
61
|
|
|
62
|
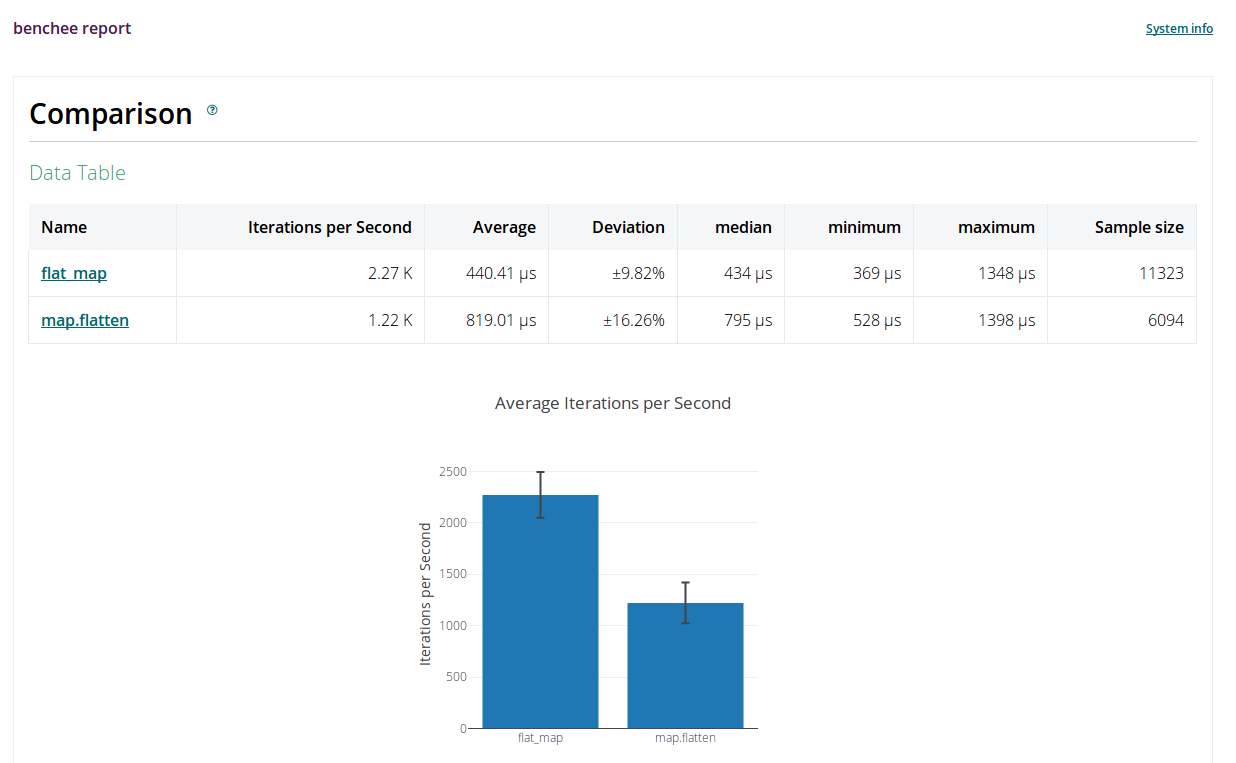
- The aforementioned [plugins](#plugins) like [benchee_html](https://github.com/bencheeorg/benchee_html) make it possible to generate nice looking [html reports](https://www.pragtob.info/benchee/flat_map.html), where individual graphs can also be exported as PNG images:
|
|
62
|
+ The aforementioned [plugins](#plugins) like [benchee_html](https://github.com/bencheeorg/benchee_html) make it possible to generate nice looking [html reports](https://www.pragtob.info/benchee/README/results.html), where individual graphs can also be exported as PNG images:
|
|
63
63
|
|
|
64
64
|
|
|
65
65
|
|
|
|
@@ -80,7 +80,7 @@ Provides you with the following **statistical data**:
|
|
80
80
|
* **average** - average execution time/memory usage (the lower the better)
|
|
81
81
|
* **ips** - iterations per second, aka how often can the given function be executed within one second (the higher the better - good for graphing), only for run times
|
|
82
82
|
* **deviation** - standard deviation (how much do the results vary), given as a percentage of the average (raw absolute values also available)
|
|
83
|
- * **median** - when all measured values are sorted, this is the middle value. More stable than the average and somewhat more likely to be a typical value you see, for the msot typical value see mode. (the lower the better)
|
|
83
|
+ * **median** - when all measured values are sorted, this is the middle value. More stable than the average and somewhat more likely to be a typical value you see, for the most typical value see mode. (the lower the better)
|
|
84
84
|
* **99th %** - 99th percentile, 99% of all measured values are less than this - worst case performance-ish
|
|
85
85
|
|
|
86
86
|
In addition, you can optionally output an extended set of statistics:
|
changed
hex_metadata.config
|
|
@@ -52,4 +52,4 @@
|
|
52
52
|
{<<"optional">>,false},
|
|
53
53
|
{<<"repository">>,<<"hexpm">>},
|
|
54
54
|
{<<"requirement">>,<<"~> 1.0">>}]]}.
|
|
55
|
- {<<"version">>,<<"1.0.0">>}.
|
|
55
|
+ {<<"version">>,<<"1.0.1">>}.
|
changed
lib/benchee/formatters/console/memory.ex
|
|
@@ -254,10 +254,10 @@ defmodule Benchee.Formatters.Console.Memory do
|
|
254
254
|
Memory.format({Memory.scale(memory, unit), unit})
|
|
255
255
|
end
|
|
256
256
|
|
|
257
|
- defp extended_statistics_report(_, _, _, %{extended_statistics: false}, _), do: []
|
|
257
|
+ defp extended_statistics_report(scenarios, units, label_width, config, hide_statistics)
|
|
258
258
|
defp extended_statistics_report(_, _, _, _, true), do: []
|
|
259
259
|
|
|
260
|
- defp extended_statistics_report(scenarios, units, label_width, _config, _hide_statistics) do
|
|
260
|
+ defp extended_statistics_report(scenarios, units, label_width, %{extended_statistics: true}, _) do
|
|
261
261
|
[
|
|
262
262
|
Helpers.descriptor("Extended statistics"),
|
|
263
263
|
extended_column_descriptors(label_width)
|
|
|
@@ -265,6 +265,8 @@ defmodule Benchee.Formatters.Console.Memory do
|
|
265
265
|
]
|
|
266
266
|
end
|
|
267
267
|
|
|
268
|
+ defp extended_statistics_report(_, _, _, _, _), do: []
|
|
269
|
+
|
|
268
270
|
defp extended_column_descriptors(label_width) do
|
|
269
271
|
"\n~*s~*s~*s~*s~*s\n"
|
|
270
272
|
|> :io_lib.format([
|
changed
mix.exs
|
|
@@ -1,7 +1,7 @@
|
|
1
1
|
defmodule Benchee.Mixfile do
|
|
2
2
|
use Mix.Project
|
|
3
3
|
|
|
4
|
- @version "1.0.0"
|
|
4
|
+ @version "1.0.1"
|
|
5
5
|
|
|
6
6
|
def project do
|
|
7
7
|
[
|