
A competitive matrix is a crucial tool for businesses. It provides a visual representation of your competitors’ strengths and weaknesses relative to your own. By analyzing various factors such as pricing, features, and market share, businesses can identify opportunities and threats in their competitive landscape.
The concept of the competitor matrix isn’t new, but its relevance has grown with the increasing complexity of markets. Competitive analysis plays a vital role here, helping companies gain a deeper understanding of their position within the industry. Companies across various industries use competitive matrices to make informed strategic decisions. This guide will delve into the intricacies of competitive matrices, explore different types, and provide templates and examples to help you craft your own.
The definition of a competitive matrix is really important to understand in order to understand how to use it. A competitive matrix, also called “competition matrix” is a strategic tool used to evaluate the competitive landscape of a business. It’s a grid that compares your company against key competitors based on various factors such as price, quality, features, and market share. This visual representation helps highlight where you stand in the market, what your competitive advantages are, and where there might be gaps in your strategy. It’s not just about knowing your rivals but also about self-awareness in the business ecosystem. By understanding both, you can make informed decisions that drive your company forward.

Understanding the competitive landscape is essential for any business strategy, and the competitor matrix serves as a vital tool in this quest. It provides a structured approach to evaluate how your offerings stack up against those of your rivals. With a well-crafted matrix, you can pinpoint where your business excels, where it falls short, and where there’s room to grow. It’s not just about keeping up; it’s about aiming to lead the pack. The insights gained from a competitor matrix can direct your business decisions, from product development to marketing strategies, ensuring that you invest wisely and effectively.
More specifically a competitive matrix can help in:
A competitive landscape chart visually represents the market position of all players in a specific industry. It plots competitors on axes defined by key performance metrics such as market share and product quality.
This matrix helps identify the unique advantages of each competitor. It compares factors such as pricing strategies, customer loyalty, and brand strength to highlight where each company excels.
A competitive comparison grid breaks down the features and benefits of each competitor’s products or services. This granular comparison allows businesses to identify feature gaps and opportunities for improvement.
This matrix focuses on the positioning strategies of different competitors. It examines how each company positions its products in the market, considering factors like target audience, marketing messages, and distribution channels.
A competitor profile matrix provides a detailed analysis of each competitor’s strengths, weaknesses, opportunities, and threats (SWOT). It offers a comprehensive overview of the competitive landscape, aiding in strategic planning.
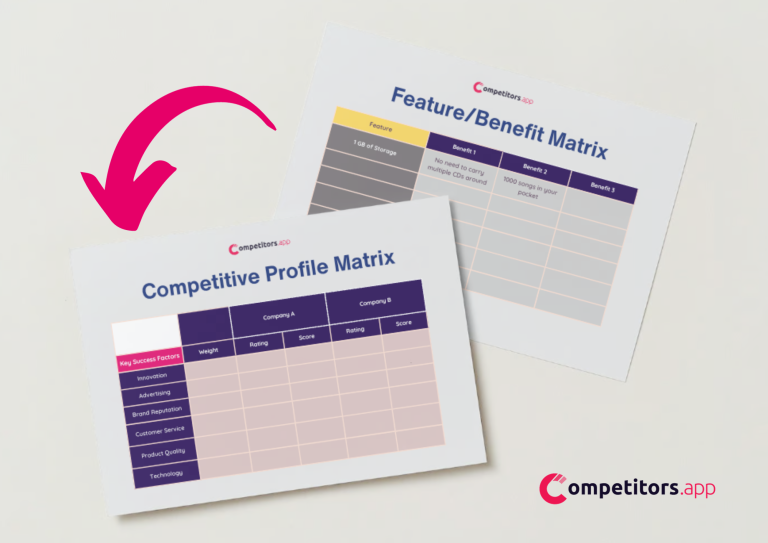
Download Your Competitive Matrix Template
Get your free template by submitting this form and turn competitive analysis into your strategic advantage.

The Competitive Analysis Matrix is a framework that helps businesses evaluate their position relative to their competitors across various factors. It typically includes parameters like market share, product quality, brand reputation, and customer satisfaction. By plotting these factors in a matrix, companies can visualize where they stand in the competitive landscape and identify areas for improvement or differentiation. For instance, if a business finds it has a lower market share but higher customer satisfaction, it may decide to leverage its customer service excellence in marketing campaigns to increase market share.
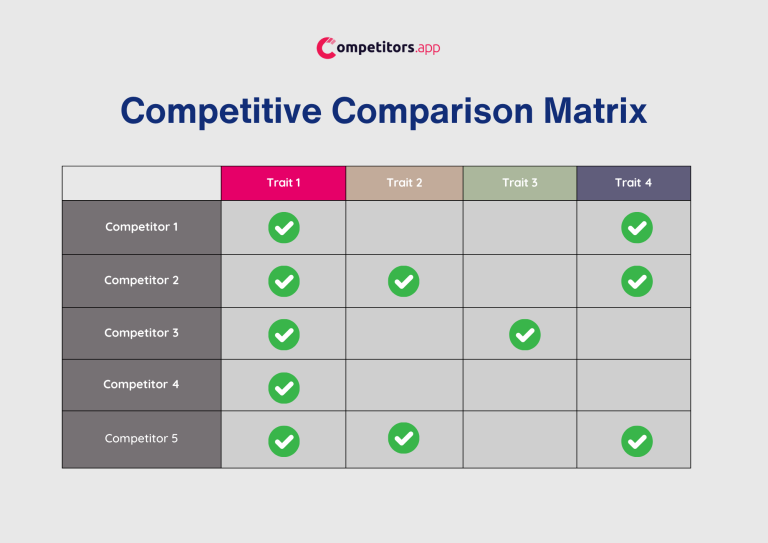
A Competitive Comparison Matrix, or a simple competition chart, is a tool used to compare your company directly with its competitors on a set of criteria deemed critical for success in your industry. This could include pricing, service offerings, technology use, customer service, and more. The simplicity of this matrix lies in its straightforward design, which allows for quick, at-a-glance comparisons. This matrix is particularly useful for identifying direct competitors and understanding how your company’s offerings stack up against them.

The Competitor Profile Matrix (CPM) allows businesses to profile key competitors and compare them based on strategic criteria. This matrix goes beyond surface-level analysis by delving into the operational, cultural, and strategic profiles of competitors. It can cover aspects such as management style, innovation, customer loyalty, and operational efficiency. A well-constructed CPM provides a comprehensive view of the competitive field and can reveal gaps in the market that your business might exploit.competi<br>

This matrix maps competitors based on two dimensions that are critical to customers, such as price level versus quality of service. The Competitive Positioning Matrix helps businesses understand how consumers perceive them in relation to their competitors. It’s a valuable tool for strategic positioning and can guide decisions on whether to compete head-on or to find a niche market.

A Feature Comparison Matrix breaks down products or services into their constituent features and compares them across different offerings in the market. It’s an effective way to highlight how your product stands out in terms of features, functionality, and benefits. This matrix is particularly useful for product development and marketing, as it can help identify which features are unique to your product and which ones are standard across the industry.
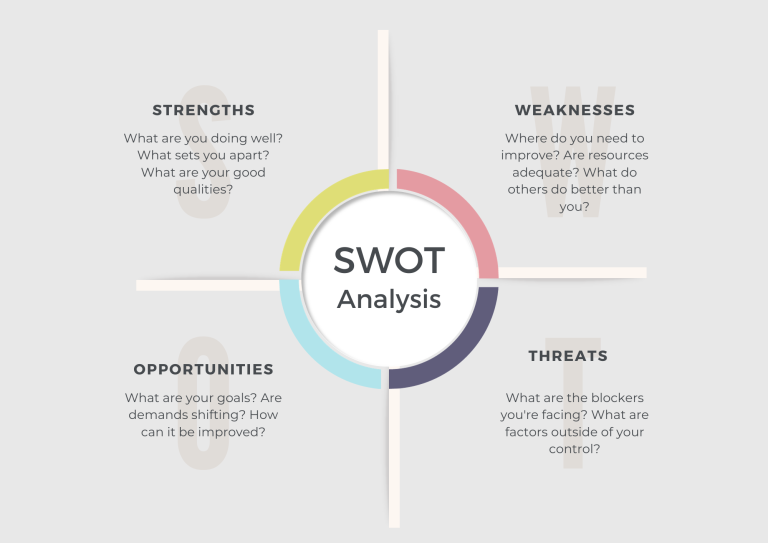
A SWOT Analysis is a strategic planning tool used to identify and analyze the Strengths, Weaknesses, Opportunities, and Threats of a business venture. It involves specifying the objective of the business or project and identifying the internal and external factors that are favorable and unfavorable to achieving that objective. A thorough SWOT analysis provides a strong foundation for strategy development by focusing on the most significant factors that affect business outcomes.

A Sales Matrix is used to analyze and improve sales performance. It can compare sales volume, growth, or profitability across different regions, products, or sales teams. This matrix helps sales managers identify high-performing areas and those that require more attention or resources.
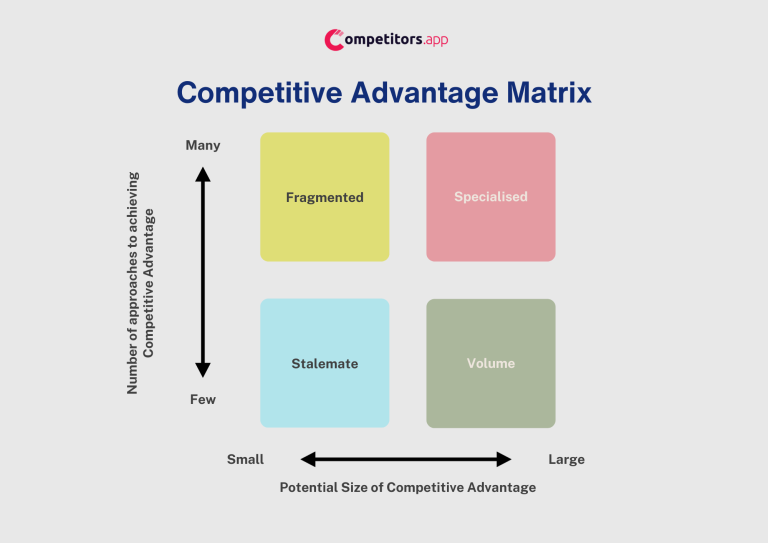
The Competitive Advantage Matrix helps businesses determine their competitive edge by evaluating two dimensions: the company’s strength in the market and the life cycle stage of the industry. It’s a strategic tool that can inform long-term planning, investment decisions, and market entry strategies.

Gartner’s Magic Quadrant is a research methodology and visualization tool for monitoring and evaluating the progress and positions of companies in a specific, technology-based market. It’s highly influential and widely regarded as a go-to source for insights on technology vendors. The quadrant categorizes companies into four types: Leaders, Challengers, Visionaries, and Niche Players, based on their completeness of vision and ability to execute.
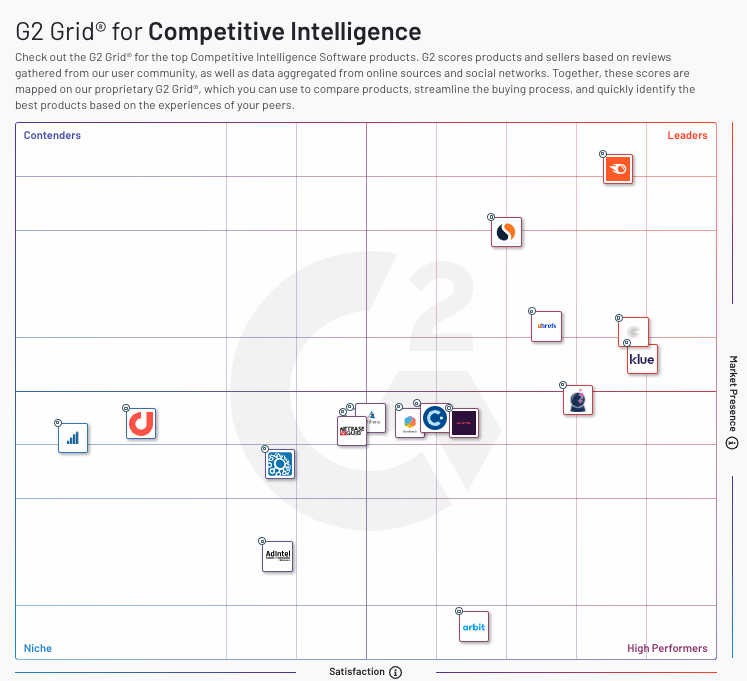
The G2 Crowd Grid is a market-specific tool that plots software products based on user satisfaction and market presence. It’s used primarily in the software industry to help buyers choose the right tool for their needs based on peer reviews and social data. For a company, appearing on the G2 Crowd Grid with high user satisfaction can be a powerful endorsement, influencing potential customers’ purchasing decisions.
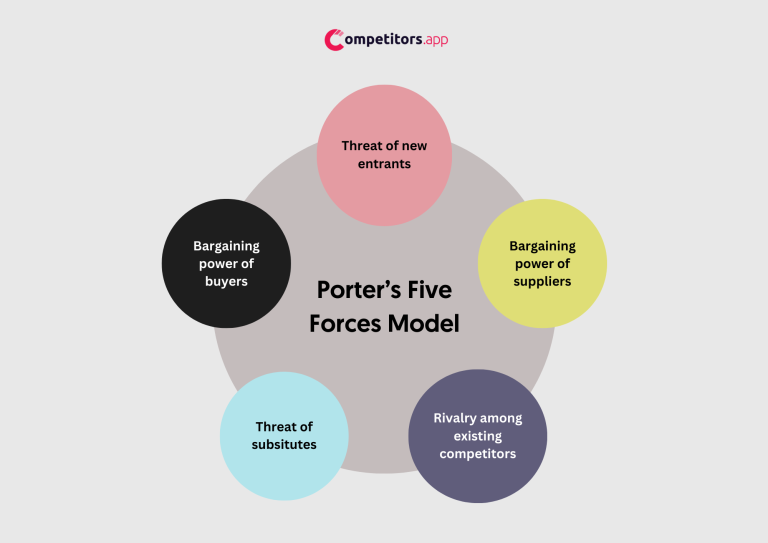
Porter’s Five Forces is a model that identifies and analyzes five competitive forces that shape every industry and helps determine an industry’s weaknesses and strengths. These forces are competition in the industry, potential of new entrants into the industry, power of suppliers, power of customers, and the threat of substitute products. Understanding these forces can help a company adjust its strategy to better use its resources to generate profit.

This matrix helps companies articulate the features of their products alongside the benefits each feature brings to the customer. It’s a useful tool for aligning product development with customer needs and for creating marketing messages that resonate with the target audience.
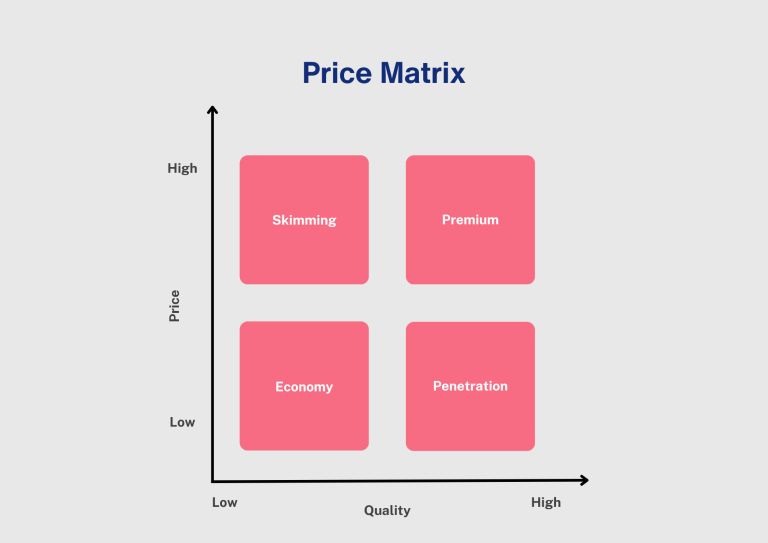
A Price Matrix is used to compare the pricing strategies of different products or services in the market. It can help businesses understand how their pricing fits within the competitive landscape and whether there’s an opportunity to adjust pricing strategies for competitive advantage.

The Growth Share Matrix, also known as the BCG Matrix, developed by the Boston Consulting Group, categorizes a company’s products or services into four categories based on market growth and market share: Stars, Cash Cows, Question Marks, and Dogs. This matrix helps companies allocate resources and prioritize investments based on the products’ current and potential performance.
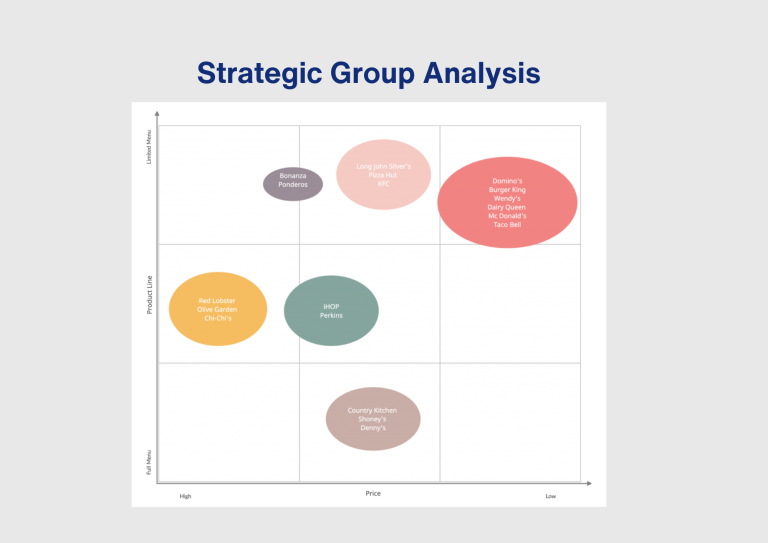
Strategic Group Analysis involves grouping companies within an industry that have similar business models or strategies. By analyzing these groups, companies can identify mobility barriers that protect a group from attacks by other groups and find new spaces in the market to occupy.
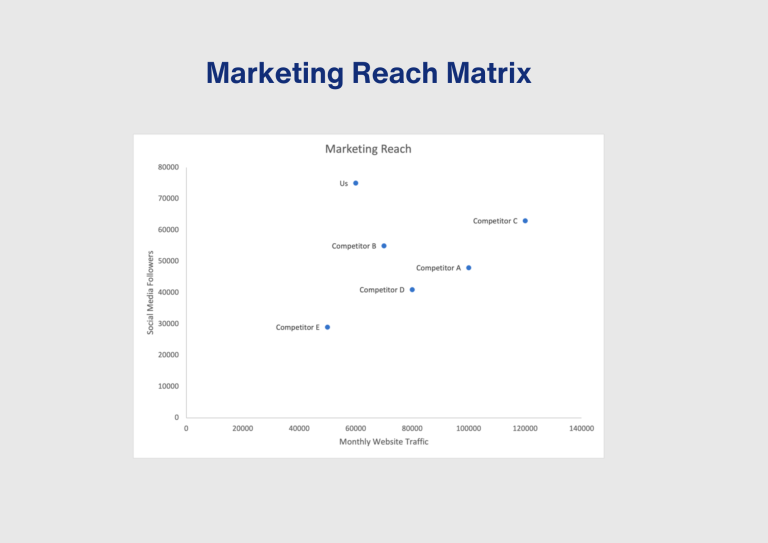
The Marketing Reach Competitor Matrix compares the marketing reach of different companies, often using metrics like website traffic, social media presence, and brand awareness. It’s a valuable tool for understanding the effectiveness of marketing strategies and the brand’s visibility compared to competito
Creating a competitor matrix is a systematic process that provides valuable insights into your market position relative to your competitors. Follow these steps to develop a comprehensive and effective competitor matrix:
Start by listing out your direct and indirect competitors. Direct competitors offer similar products or services and target the same customer base. Indirect competitors may offer different products but satisfy similar customer needs or solve similar problems. To identify competitors:
Choose the key performance indicators (KPIs) that are most relevant to your business and industry. KPIs should provide insights into various aspects of competitive performance. Common KPIs include:
Collect data from reliable sources for each KPI. Ensure the data is accurate and up-to-date to make informed decisions. Sources for data collection include:
Use a matrix template to plot the collected data and visualize the competitive landscape. You can create a matrix using tools like Microsoft Excel, Google Sheets, or specialized software. Follow these steps to plot your data:
Interpret the matrix to identify strengths, weaknesses, opportunities, and threats (SWOT) for each competitor. This analysis will provide insights into your own market position and inform strategic decision-making. Key steps in analyzing the results include:
By following these steps, you can create a comprehensive competitor matrix that helps you understand your market position, identify strategic opportunities, and stay ahead of your competitors.
In this section, we’ll guide you through the steps to create a competitive matrix using Microsoft Excel, focusing on market share and customer reviews as key metrics. This practical approach will help you understand your competitive landscape and identify areas for growth and improvement. Whether you’re a seasoned marketer or new to competitive analysis, this step-by-step guide is designed to provide you with a clear and actionable competitive snapshot.
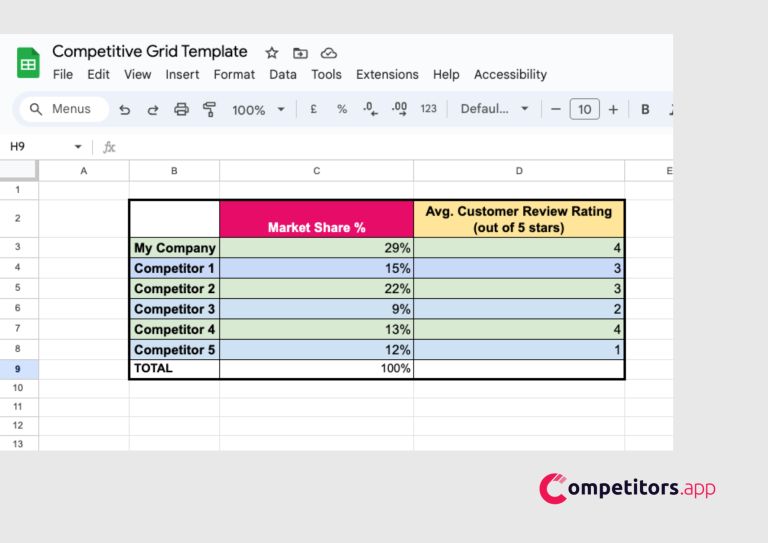
a) Open a new Excel spreadsheet.
b) List your company and competitors in Column A.
c) Enter each company’s market share percentage in Column B.
d) In Column C, input the average customer review rating (for example, out of 5 stars).

Highlight the data in Columns B and C, click on the ‘Insert’ tab, and choose a scatter plot to visualize the data.
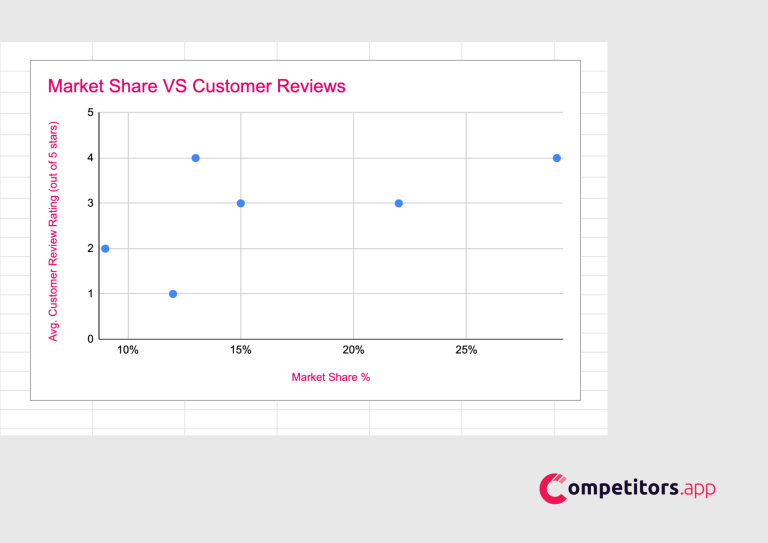
Customize your chart by adding a title, “Market Share vs. Customer Reviews,” and labeling axes for market share and average review rating.
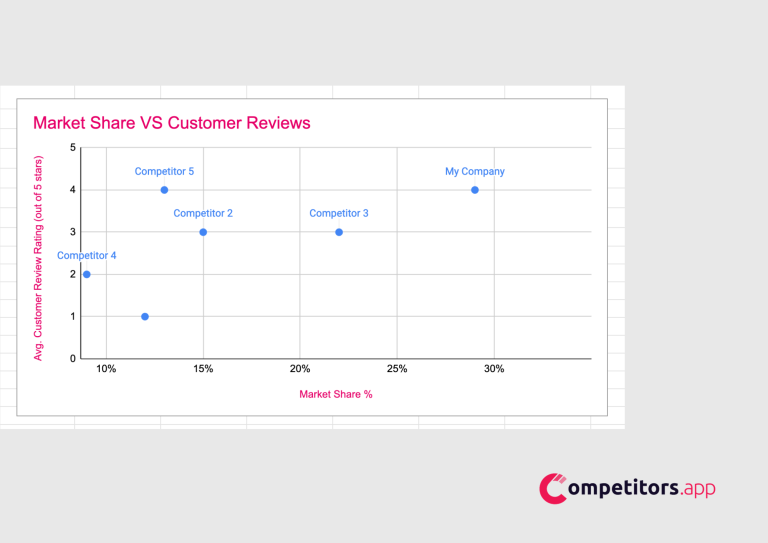
Add data labels to identify each point with the corresponding company name from Column A.
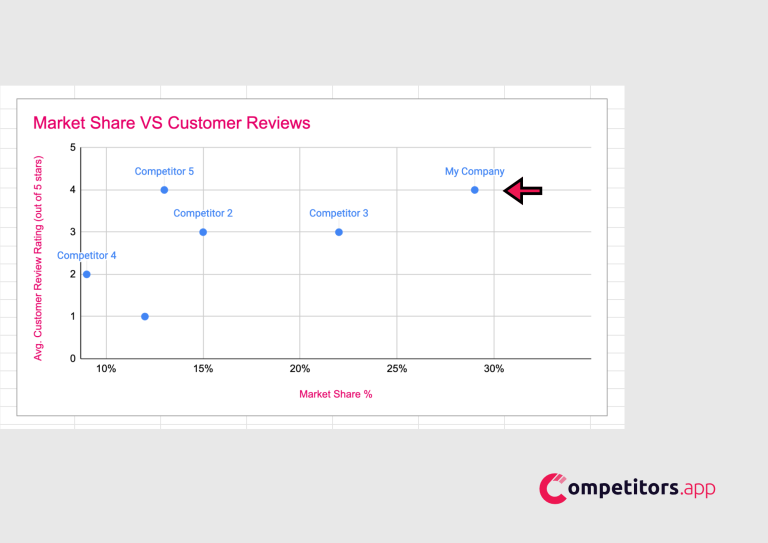
a) Review the scatter plot to see which companies have a strong market share and high customer ratings, indicating market leaders.
b) Use this insight to identify your position and strategize on improving market share or customer satisfaction based on the matrix findings.
Focus on the most relevant key performance indicators (KPIs) to avoid information overload. Select KPIs that provide the most valuable insights into your competitive landscape.
Use reliable data sources and avoid biases. Ensure that the data you include is accurate and comes from reputable sources to maintain the integrity of your analysis.
Keep your matrix up to date to reflect the latest market changes. Regular updates ensure that your competitive analysis remains relevant and accurate.
Incorporate charts and graphs to make the data more digestible. Visual representations help in quickly identifying trends and key differences between competitors.
Ensure that your matrix is easy to read and interpret. Use consistent formatting, clear labels, and organize the data logically to enhance readability.

Creating a competitive matrix is one thing but the important think to succeed in competitive intelligence is being rearlly good at analyzing one to develiver high-value competitive insights. Analyzing a competitive matrix requires a keen eye for detail and a strategic mindset. Here are some tips to effectively analyze your competitive matrix:
1. Look for Patterns: Examine the matrix for any apparent patterns or anomalies. Are there areas where your business consistently outperforms or underperforms?
2. Assess Market Gaps: Identify any market needs that are currently unmet by competitors. These gaps could represent opportunities for your business to differentiate itself.
3. Evaluate Competitor Clustering: Notice if competitors cluster together in certain areas of the matrix. This could indicate a saturated market segment or a common industry focus.
4. Consider Strategic Implications: Reflect on how the matrix insights align with your business strategy. Does the analysis suggest a need to pivot or double down on current strategies?
5. Actionable Insights: Use the matrix to generate actionable insights. For example, if the matrix reveals that competitors are not capitalizing on a particular customer service aspect, consider enhancing your offerings in this area.
Remember, the goal of analyzing a competitive matrix is not just to understand where you stand, but to inform strategic decisions that can lead to a competitive advantage.

A Great Case Study for The Use of Competitive Matrix
In the competitive world of online courses, one company leveraged a competitive matrix to uncover a golden opportunity. Their ppc analysis revealed a widespread issue among competitors: poor handling of payment refunds. Seizing this chance, the company launched targeted campaigns emphasizing their efficient refund process, which resonated with frustrated customers from other services. This strategic move, rooted in competitive intelligence, not only enhanced their brand image but also led to tangible results. Without significant additional spending, they witnessed their marketing ROI soar and their product sign-ups double within two months, a testament to the power of a well-executed competitive matrix in action.
How can you do the same for your business?
Turning a competitive matrix into action for your business involves a few strategic steps. First, conduct a thorough analysis to identify gaps in your competitors’ offerings or service. Look for patterns or recurring issues that customers are vocal about, such as slow service, limited features, or high costs. Once you’ve pinpointed these areas, brainstorm how your business can address these pain points effectively.
Next, develop targeted campaigns or product enhancements that directly speak to these weaknesses. If you find that competitors are weak in customer service, for instance, invest in training for your team and highlight this strength in your marketing materials.
Finally, measure the impact of your actions through increased customer acquisition, satisfaction scores, or sales metrics. Adjust your strategy based on customer feedback and market response to ensure continuous improvement and leverage your competitive edge. By doing so, you can transform insights from a competitive matrix into successful business outcomes.

On their website, HubSpot strategically targets the keyword “Drift VS Intercom,” positioning their offerings in direct comparison with these competitors. They leverage a competitive matrix to clearly articulate their market superiority, providing compelling evidence and detailed analysis to persuade potential customers of their CRM’s leading edge over Drift and Intercom. This approach not only enhances their SEO efforts but also serves as a valuable decision-making tool for readers considering their options in the CRM space.
Understanding and utilizing a competitive matrix is essential for any business aiming to thrive in a competitive market. This guide provides the tools and insights needed to create effective competitive matrices, enabling you to make informed strategic decisions and stay ahead of your competitors.
A competitor matrix helps businesses understand their market position relative to competitors by comparing key performance indicators.
The competitors' performance matrix evaluates the performance of competitors based on various metrics like market share, sales, and customer satisfaction.
The competitors' identification matrix helps businesses identify and categorize their competitors based on specific criteria.
A competitive profile matrix provides a detailed SWOT analysis of competitors.
An example of a competitive profile matrix might include a SWOT analysis of competitors in the tech industry.
The 2x2 competitive matrix plots competitors on two axes to highlight strategic positions.
A competitive analysis grid is a visual tool that compares the features and performance of competitors.
No, the BCG matrix is not a SWOT analysis. While SWOT focuses on strengths, weaknesses, opportunities, and threats of a business, the BCG matrix assesses the relative market share and market growth of products or business units.
Yes, there are several tools available for creating a competitive matrix, including Microsoft Excel, Google Sheets, and specialized software like Competitors.app, which can automate data collection and analysis.
Data for a competitive matrix can be gathered from various sources, including market research reports, public financial records, customer surveys, industry databases, and competitor observation.
A competitive matrix compares multiple companies across various factors, while a SWOT analysis is typically used to evaluate one company's internal and external environment.
Competitors App SRL
support at competitors.app
Sanzienelor 3, Sibiu, Romania
+1 (302) 208-7954